Section 3 (Crop Management)
Section 3 (Crop Management)
Section 3 (Crop Management)

Create successful ePaper yourself
Turn your PDF publications into a flip-book with our unique Google optimized e-Paper software.
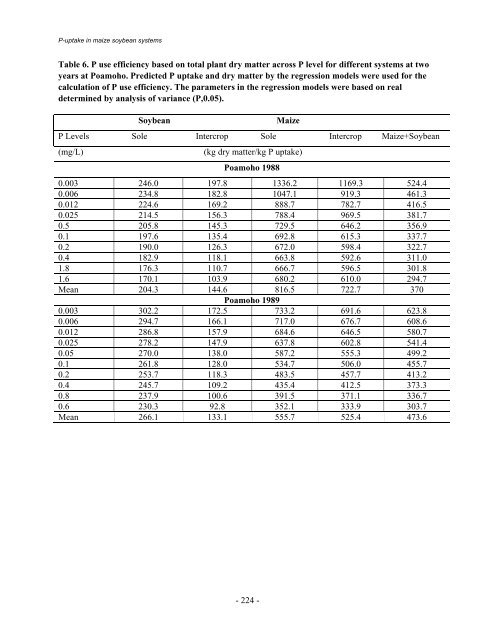
P-uptake in maize soybean systems<br />
Table 6. P use efficiency based on total plant dry matter across P level for different systems at two<br />
years at Poamoho. Predicted P uptake and dry matter by the regression models were used for the<br />
calculation of P use efficiency. The parameters in the regression models were based on real<br />
determined by analysis of variance (P,0.05).<br />
Soybean Maize<br />
P Levels Sole Intercrop Sole Intercrop Maize+Soybean<br />
(mg/L) (kg dry matter/kg P uptake)<br />
Poamoho 1988<br />
0.003 246.0 197.8 1336.2 1169.3 524.4<br />
0.006 234.8 182.8 1047.1 919.3 461.3<br />
0.012 224.6 169.2 888.7 782.7 416.5<br />
0.025 214.5 156.3 788.4 969.5 381.7<br />
0.5 205.8 145.3 729.5 646.2 356.9<br />
0.1 197.6 135.4 692.8 615.3 337.7<br />
0.2 190.0 126.3 672.0 598.4 322.7<br />
0.4 182.9 118.1 663.8 592.6 311.0<br />
1.8 176.3 110.7 666.7 596.5 301.8<br />
1.6 170.1 103.9 680.2 610.0 294.7<br />
Mean 204.3 144.6 816.5 722.7 370<br />
Poamoho 1989<br />
0.003 302.2 172.5 733.2 691.6 623.8<br />
0.006 294.7 166.1 717.0 676.7 608.6<br />
0.012 286.8 157.9 684.6 646.5 580.7<br />
0.025 278.2 147.9 637.8 602.8 541.4<br />
0.05 270.0 138.0 587.2 555.3 499.2<br />
0.1 261.8 128.0 534.7 506.0 455.7<br />
0.2 253.7 118.3 483.5 457.7 413.2<br />
0.4 245.7 109.2 435.4 412.5 373.3<br />
0.8 237.9 100.6 391.5 371.1 336.7<br />
0.6 230.3 92.8 352.1 333.9 303.7<br />
Mean 266.1 133.1 555.7 525.4 473.6<br />
- 224 -