- Page 1:
Hydro-Mechanical Properties of Part
- Page 5:
Acknowledgement The present dissert
- Page 8 and 9:
3.2 Steps of Model Building . . . .
- Page 10 and 11:
11 Summary and Outlook 205 11.1 Gen
- Page 12 and 13:
2.16 Influence of Brooks and Corey
- Page 14 and 15:
6.2 Experimental results of soil-wa
- Page 16 and 17:
7.17 Unsaturated hydraulic conducti
- Page 18 and 19:
B.6 Experimental results and best f
- Page 20 and 21:
8.3 Constitutive parameters for the
- Page 22 and 23:
E ref ur Oedometer reference stiffn
- Page 24:
ρ Density (g/cm 3 ) ρd ρs Dry de
- Page 28 and 29:
2 CHAPTER 1. INTRODUCTION Figure 1.
- Page 30 and 31:
4 CHAPTER 1. INTRODUCTION - Model b
- Page 32 and 33:
6 CHAPTER 1. INTRODUCTION
- Page 34 and 35:
8 CHAPTER 2. STATE OF THE ART condu
- Page 36 and 37:
10 CHAPTER 2. STATE OF THE ART soil
- Page 38 and 39:
12 CHAPTER 2. STATE OF THE ART the
- Page 40 and 41:
14 CHAPTER 2. STATE OF THE ART Figu
- Page 42 and 43:
16 CHAPTER 2. STATE OF THE ART - Su
- Page 44 and 45:
18 CHAPTER 2. STATE OF THE ART - Re
- Page 46 and 47:
20 CHAPTER 2. STATE OF THE ART Volu
- Page 48 and 49:
22 CHAPTER 2. STATE OF THE ART Drai
- Page 50 and 51:
24 CHAPTER 2. STATE OF THE ART wher
- Page 52 and 53:
26 CHAPTER 2. STATE OF THE ART drai
- Page 54 and 55:
28 CHAPTER 2. STATE OF THE ART Tabl
- Page 56 and 57:
30 CHAPTER 2. STATE OF THE ART Tabl
- Page 58 and 59:
32 CHAPTER 2. STATE OF THE ART by W
- Page 60 and 61:
34 CHAPTER 2. STATE OF THE ART proc
- Page 62 and 63:
36 CHAPTER 2. STATE OF THE ART - Im
- Page 64 and 65:
38 CHAPTER 2. STATE OF THE ART auth
- Page 66 and 67:
40 CHAPTER 2. STATE OF THE ART 2.5.
- Page 68 and 69:
42 CHAPTER 2. STATE OF THE ART Volu
- Page 70 and 71:
44 CHAPTER 2. STATE OF THE ART Volu
- Page 72 and 73:
46 CHAPTER 2. STATE OF THE ART fitt
- Page 74 and 75:
48 CHAPTER 2. STATE OF THE ART Satu
- Page 76 and 77:
50 CHAPTER 2. STATE OF THE ART when
- Page 78 and 79:
52 CHAPTER 2. STATE OF THE ART Degr
- Page 80 and 81:
54 CHAPTER 2. STATE OF THE ART 1. T
- Page 82 and 83:
56 CHAPTER 2. STATE OF THE ART 0.2
- Page 84 and 85:
58 CHAPTER 2. STATE OF THE ART meth
- Page 86 and 87:
60 CHAPTER 2. STATE OF THE ART When
- Page 88 and 89:
62 CHAPTER 2. STATE OF THE ART Vert
- Page 90 and 91:
64 CHAPTER 2. STATE OF THE ART a) S
- Page 92 and 93:
66 CHAPTER 2. STATE OF THE ART - Ja
- Page 94 and 95:
68 CHAPTER 2. STATE OF THE ART
- Page 96 and 97:
70 CHAPTER 3. INTRODUCTION TO PROCE
- Page 98 and 99:
72 CHAPTER 3. INTRODUCTION TO PROCE
- Page 100 and 101:
74 CHAPTER 3. INTRODUCTION TO PROCE
- Page 102 and 103:
76 CHAPTER 4. EXPERIMENTAL SETUPS s
- Page 104 and 105:
78 CHAPTER 4. EXPERIMENTAL SETUPS 1
- Page 106 and 107:
80 CHAPTER 4. EXPERIMENTAL SETUPS D
- Page 108 and 109:
82 CHAPTER 4. EXPERIMENTAL SETUPS d
- Page 110 and 111:
84 CHAPTER 4. EXPERIMENTAL SETUPS b
- Page 112 and 113:
86 CHAPTER 4. EXPERIMENTAL SETUPS t
- Page 114 and 115:
88 CHAPTER 4. EXPERIMENTAL SETUPS s
- Page 116 and 117:
90 CHAPTER 4. EXPERIMENTAL SETUPS D
- Page 118 and 119:
92 CHAPTER 4. EXPERIMENTAL SETUPS s
- Page 120 and 121:
94 CHAPTER 4. EXPERIMENTAL SETUPS T
- Page 122 and 123:
96 CHAPTER 5. MATERIAL USED AND EXP
- Page 124 and 125:
98 CHAPTER 5. MATERIAL USED AND EXP
- Page 126 and 127:
100 CHAPTER 5. MATERIAL USED AND EX
- Page 128 and 129:
102 CHAPTER 5. MATERIAL USED AND EX
- Page 130 and 131:
104 CHAPTER 5. MATERIAL USED AND EX
- Page 132 and 133:
106 CHAPTER 5. MATERIAL USED AND EX
- Page 134 and 135:
108 CHAPTER 5. MATERIAL USED AND EX
- Page 136 and 137:
110 CHAPTER 5. MATERIAL USED AND EX
- Page 138 and 139:
112 CHAPTER 5. MATERIAL USED AND EX
- Page 140 and 141:
114 CHAPTER 5. MATERIAL USED AND EX
- Page 142 and 143:
116 CHAPTER 6. EXPERIMENTAL RESULTS
- Page 144 and 145:
118 CHAPTER 6. EXPERIMENTAL RESULTS
- Page 146 and 147:
120 CHAPTER 6. EXPERIMENTAL RESULTS
- Page 148 and 149:
122 CHAPTER 6. EXPERIMENTAL RESULTS
- Page 150 and 151:
124 CHAPTER 6. EXPERIMENTAL RESULTS
- Page 152 and 153:
126 CHAPTER 6. EXPERIMENTAL RESULTS
- Page 154 and 155:
128 CHAPTER 6. EXPERIMENTAL RESULTS
- Page 156 and 157:
130 CHAPTER 6. EXPERIMENTAL RESULTS
- Page 158 and 159:
132 CHAPTER 6. EXPERIMENTAL RESULTS
- Page 160 and 161:
134 CHAPTER 6. EXPERIMENTAL RESULTS
- Page 162 and 163:
136 CHAPTER 7. ANALYSIS AND INTERPR
- Page 164 and 165: 138 Observed values (-) Observed va
- Page 166 and 167: 140 CHAPTER 7. ANALYSIS AND INTERPR
- Page 168 and 169: 142 CHAPTER 7. ANALYSIS AND INTERPR
- Page 170 and 171: 144 CHAPTER 7. ANALYSIS AND INTERPR
- Page 172 and 173: 146 CHAPTER 7. ANALYSIS AND INTERPR
- Page 174 and 175: 148 CHAPTER 7. ANALYSIS AND INTERPR
- Page 176 and 177: 150 CHAPTER 7. ANALYSIS AND INTERPR
- Page 178 and 179: 152 CHAPTER 7. ANALYSIS AND INTERPR
- Page 180 and 181: 154 CHAPTER 7. ANALYSIS AND INTERPR
- Page 182 and 183: 156 CHAPTER 7. ANALYSIS AND INTERPR
- Page 184 and 185: 158 CHAPTER 7. ANALYSIS AND INTERPR
- Page 186 and 187: 160 CHAPTER 7. ANALYSIS AND INTERPR
- Page 188 and 189: 162 CHAPTER 7. ANALYSIS AND INTERPR
- Page 190 and 191: 164 Stiffness modulus (kPa) Stiffne
- Page 192 and 193: 166 CHAPTER 7. ANALYSIS AND INTERPR
- Page 194 and 195: 168 CHAPTER 7. ANALYSIS AND INTERPR
- Page 196 and 197: 170 CHAPTER 7. ANALYSIS AND INTERPR
- Page 198 and 199: 172CHAPTER 8. NEW SWCC MODEL FOR SA
- Page 200 and 201: 174CHAPTER 8. NEW SWCC MODEL FOR SA
- Page 202 and 203: 176CHAPTER 8. NEW SWCC MODEL FOR SA
- Page 204 and 205: 178CHAPTER 8. NEW SWCC MODEL FOR SA
- Page 206 and 207: 180CHAPTER 8. NEW SWCC MODEL FOR SA
- Page 208 and 209: 182CHAPTER 8. NEW SWCC MODEL FOR SA
- Page 210 and 211: 184CHAPTER 8. NEW SWCC MODEL FOR SA
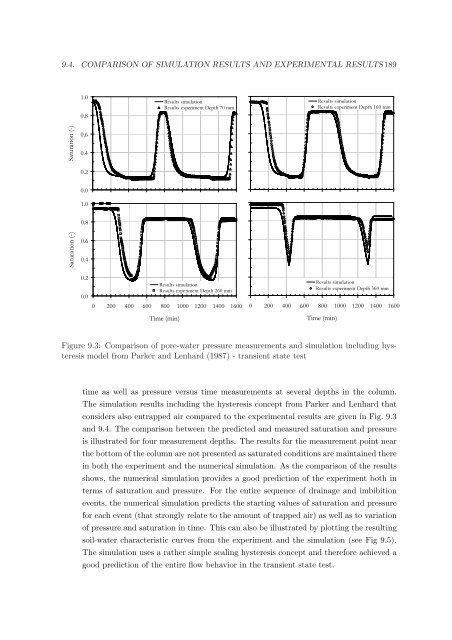
- Page 212 and 213: 186 CHAPTER 9. NUMERICAL SIMULATION
- Page 216 and 217: 190 CHAPTER 9. NUMERICAL SIMULATION
- Page 218 and 219: 192 CHAPTER 9. NUMERICAL SIMULATION
- Page 220 and 221: 194 CHAPTER 9. NUMERICAL SIMULATION
- Page 222 and 223: CHAPTER 10. BEARING CAPACITY OF A S
- Page 224 and 225: CHAPTER 10. BEARING CAPACITY OF A S
- Page 226 and 227: CHAPTER 10. BEARING CAPACITY OF A S
- Page 228 and 229: CHAPTER 10. BEARING CAPACITY OF A S
- Page 230 and 231: 204 CHAPTER 10. BEARING CAPACITY OF
- Page 232 and 233: 206 CHAPTER 11. SUMMARY AND OUTLOOK
- Page 234 and 235: 208 CHAPTER 11. SUMMARY AND OUTLOOK
- Page 236 and 237: 210 CHAPTER 11. SUMMARY AND OUTLOOK
- Page 238 and 239: 212 CHAPTER 11. SUMMARY AND OUTLOOK
- Page 240 and 241: 214 APPENDIX A. DETAILS ZOU’S MOD
- Page 242 and 243: 216 APPENDIX A. DETAILS ZOU’S MOD
- Page 244 and 245: 218 APPENDIX B. SOIL-WATER CHARACTE
- Page 246 and 247: 220 APPENDIX B. SOIL-WATER CHARACTE
- Page 248 and 249: 222 APPENDIX B. SOIL-WATER CHARACTE
- Page 250 and 251: 224 APPENDIX B. SOIL-WATER CHARACTE
- Page 252 and 253: 226 APPENDIX B. SOIL-WATER CHARACTE
- Page 254 and 255: 228 APPENDIX B. SOIL-WATER CHARACTE
- Page 256 and 257: 230 APPENDIX C. COLLAPSE POTENTIAL
- Page 258 and 259: 232 Vertical strain (-) Vertical st
- Page 260 and 261: 234 APPENDIX E. NEW SWCC MODEL - DE
- Page 262 and 263: 236 APPENDIX E. NEW SWCC MODEL - DE
- Page 264 and 265:
238 APPENDIX E. NEW SWCC MODEL - DE
- Page 266 and 267:
240 40 50 30 APPENDIX E. NEW SWCC M
- Page 268 and 269:
242 Observed Values Number of obser
- Page 270 and 271:
244 BIBLIOGRAPHY Aubertin, M., Mbon
- Page 272 and 273:
246 BIBLIOGRAPHY Campbell, J. D. (1
- Page 274 and 275:
248 BIBLIOGRAPHY Davis, J. L. & Ann
- Page 276 and 277:
250 BIBLIOGRAPHY Ferré, P. A. & To
- Page 278 and 279:
252 BIBLIOGRAPHY Grozic, J. L. H.,
- Page 280 and 281:
254 BIBLIOGRAPHY Janbu, N. (1969),
- Page 282 and 283:
256 BIBLIOGRAPHY Lawton, E. C., Fra
- Page 284 and 285:
258 BIBLIOGRAPHY Mualem, Y. (1977),
- Page 286 and 287:
260 BIBLIOGRAPHY Phene, C. J., Hoff
- Page 288 and 289:
262 BIBLIOGRAPHY Rojas, J. C., Sali
- Page 290 and 291:
264 BIBLIOGRAPHY Stoimenova, E., Da
- Page 292 and 293:
266 BIBLIOGRAPHY Vanapalli, S. K. &
- Page 294 and 295:
268 BIBLIOGRAPHY Unsaturated Geotec
- Page 296 and 297:
Schriftenreihe des Lehrstuhls für
- Page 298:
Herausgeber: Th. Triantafyllidis 32