Risk Management and Governance for PFI Project ... - Title Page - MIT
Risk Management and Governance for PFI Project ... - Title Page - MIT
Risk Management and Governance for PFI Project ... - Title Page - MIT
Create successful ePaper yourself
Turn your PDF publications into a flip-book with our unique Google optimized e-Paper software.
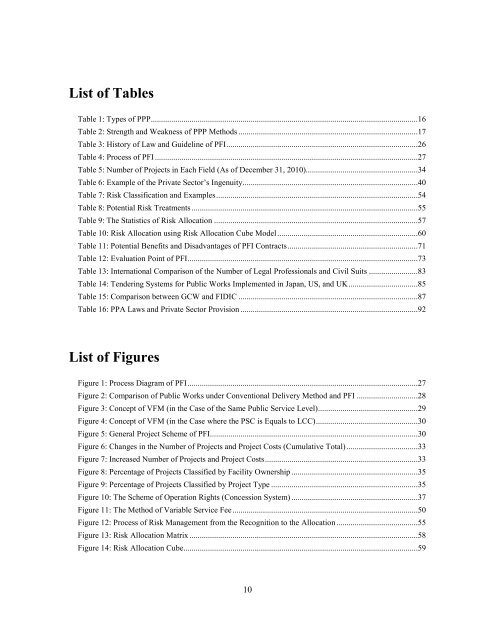
List of Tables<br />
Table 1: Types of PPP ...................................................................................................................................16<br />
Table 2: Strength <strong>and</strong> Weakness of PPP Methods ........................................................................................17<br />
Table 3: History of Law <strong>and</strong> Guideline of <strong>PFI</strong> ..............................................................................................26<br />
Table 4: Process of <strong>PFI</strong> .................................................................................................................................27<br />
Table 5: Number of <strong>Project</strong>s in Each Field (As of December 31, 2010).......................................................34<br />
Table 6: Example of the Private Sector’s Ingenuity ......................................................................................40<br />
Table 7: <strong>Risk</strong> Classification <strong>and</strong> Examples ...................................................................................................54<br />
Table 8: Potential <strong>Risk</strong> Treatments ...............................................................................................................55<br />
Table 9: The Statistics of <strong>Risk</strong> Allocation ....................................................................................................57<br />
Table 10: <strong>Risk</strong> Allocation using <strong>Risk</strong> Allocation Cube Model .....................................................................60<br />
Table 11: Potential Benefits <strong>and</strong> Disadvantages of <strong>PFI</strong> Contracts ................................................................71<br />
Table 12: Evaluation Point of <strong>PFI</strong> .................................................................................................................73<br />
Table 13: International Comparison of the Number of Legal Professionals <strong>and</strong> Civil Suits ........................83<br />
Table 14: Tendering Systems <strong>for</strong> Public Works Implemented in Japan, US, <strong>and</strong> UK ..................................85<br />
Table 15: Comparison between GCW <strong>and</strong> FIDIC ........................................................................................87<br />
Table 16: PPA Laws <strong>and</strong> Private Sector Provision .......................................................................................92<br />
List of Figures<br />
Figure 1: Process Diagram of <strong>PFI</strong> .................................................................................................................27<br />
Figure 2: Comparison of Public Works under Conventional Delivery Method <strong>and</strong> <strong>PFI</strong> ..............................28<br />
Figure 3: Concept of VFM (in the Case of the Same Public Service Level) .................................................29<br />
Figure 4: Concept of VFM (in the Case where the PSC is Equals to LCC) ..................................................30<br />
Figure 5: General <strong>Project</strong> Scheme of <strong>PFI</strong> ......................................................................................................30<br />
Figure 6: Changes in the Number of <strong>Project</strong>s <strong>and</strong> <strong>Project</strong> Costs (Cumulative Total) ...................................33<br />
Figure 7: Increased Number of <strong>Project</strong>s <strong>and</strong> <strong>Project</strong> Costs ...........................................................................33<br />
Figure 8: Percentage of <strong>Project</strong>s Classified by Facility Ownership ..............................................................35<br />
Figure 9: Percentage of <strong>Project</strong>s Classified by <strong>Project</strong> Type ........................................................................35<br />
Figure 10: The Scheme of Operation Rights (Concession System) ..............................................................37<br />
Figure 11: The Method of Variable Service Fee ...........................................................................................50<br />
Figure 12: Process of <strong>Risk</strong> <strong>Management</strong> from the Recognition to the Allocation ........................................55<br />
Figure 13: <strong>Risk</strong> Allocation Matrix ................................................................................................................58<br />
Figure 14: <strong>Risk</strong> Allocation Cube ...................................................................................................................59<br />
10


