SSG No 10 - Shipgaz
SSG No 10 - Shipgaz
SSG No 10 - Shipgaz
- TAGS
- shipgaz
- shipgaz.com

Create successful ePaper yourself
Turn your PDF publications into a flip-book with our unique Google optimized e-Paper software.
OlYMPIC SHIPPING<br />
SHIPPING AND SHIP MANAGEMENT<br />
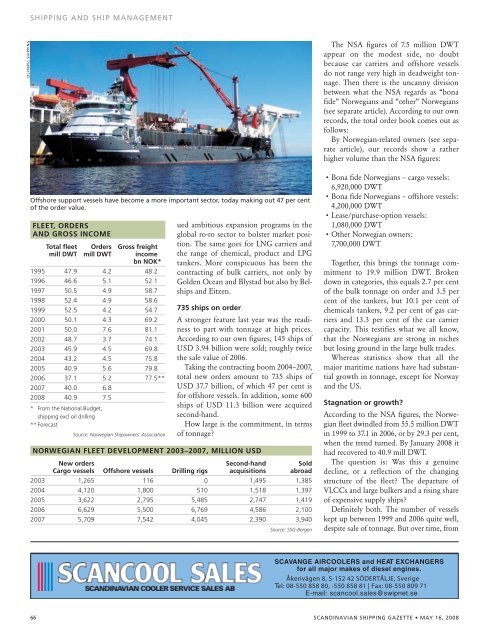
Offshore support vessels have become a more important sector, today making out 47 per cent<br />
of the order value.<br />
FleeT, orDerS<br />
AND groSS INCome<br />
Total fleet orders gross freight<br />
mill DWT mill DWT income<br />
bn <strong>No</strong>K*<br />
1995 47.9 4.2 48.2<br />
1996 46.6 5.1 52.1<br />
1997 50.5 4.9 58.7<br />
1998 52.4 4.9 58.6<br />
1999 52.5 4.2 54.7<br />
2000 50.1 4.3 69.2<br />
2001 50.0 7.6 81.1<br />
2002 48.7 3.7 74.1<br />
2003 45.9 4.5 69.8<br />
2004 43.2 4.5 75.8<br />
2005 40.9 5.6 79.8<br />
2006 37.1 5.2 77.5**<br />
2007 40.0 6.8<br />
2008 40.9 7.5<br />
* From the National Budget,<br />
shipping excl oil drilling<br />
** Forecast<br />
Source: <strong>No</strong>rwegian Shipowners’ Association<br />
ued ambitious expansion programs in the<br />
global ro-ro sector to bolster market position.<br />
The same goes for LNG carriers and<br />
the range of chemical, product and LPG<br />
tankers. More conspicuous has been the<br />
contracting of bulk carriers, not only by<br />
Golden Ocean and Blystad but also by Belships<br />
and Eitzen.<br />
735 ships on order<br />
A stronger feature last year was the readiness<br />
to part with tonnage at high prices.<br />
According to our own figures, 145 ships of<br />
USD 3.94 billion were sold; roughly twice<br />
the sale value of 2006.<br />
Taking the contracting boom 2004–2007,<br />
total new orders amount to 735 ships of<br />
USD 37.7 billion, of which 47 per cent is<br />
for offshore vessels. In addition, some 600<br />
ships of USD 11.3 billion were acquired<br />
second-hand.<br />
How large is the commitment, in terms<br />
of tonnage?<br />
<strong>No</strong>rWegIAN FleeT DevelopmeNT 2003–2007, mIllIoN uSD<br />
New orders Second-hand Sold<br />
Cargo vessels offshore vessels Drilling rigs acquisitions abroad<br />
2003 1,265 116 0 1,495 1,385<br />
2004 4,120 1,800 5<strong>10</strong> 1,518 1,397<br />
2005 3,622 2,795 5,485 2,747 1,419<br />
2006 6,629 5,500 6,769 4,586 2,<strong>10</strong>0<br />
2007 5,709 7,542 4,045 2,390 3,940<br />
Source: <strong>SSG</strong>-Bergen<br />
The NSA figures of 7.5 million DWT<br />
appear on the modest side, no doubt<br />
because car carriers and offshore vessels<br />
do not range very high in deadweight tonnage.<br />
Then there is the uncanny division<br />
between what the NSA regards as “bona<br />
fide” <strong>No</strong>rwegians and “other” <strong>No</strong>rwegians<br />
(see separate article). According to our own<br />
records, the total order book comes out as<br />
follows:<br />
By <strong>No</strong>rwegian-related owners (see separate<br />
article), our records show a rather<br />
higher volume than the NSA figures:<br />
• Bona fide <strong>No</strong>rwegians – cargo vessels:<br />
6,920,000 DWT<br />
• Bona fide <strong>No</strong>rwegians – offshore vessels:<br />
4,200,000 DWT<br />
• Lease/purchase-option vessels:<br />
1,080,000 DWT<br />
• Other <strong>No</strong>rwegian owners:<br />
7,700,000 DWT<br />
Together, this brings the tonnage commitment<br />
to 19.9 million DWT. Broken<br />
down in categories, this equals 2.7 per cent<br />
of the bulk tonnage on order and 3.5 per<br />
cent of the tankers, but <strong>10</strong>.1 per cent of<br />
chemicals tankers, 9.2 per cent of gas carriers<br />
and 13.3 per cent of the car carrier<br />
capacity. This testifies what we all know,<br />
that the <strong>No</strong>rwegians are strong in niches<br />
but losing ground in the large bulk trades.<br />
Whereas statistics show that all the<br />
major maritime nations have had substantial<br />
growth in tonnage, except for <strong>No</strong>rway<br />
and the US.<br />
Stagnation or growth?<br />
According to the NSA figures, the <strong>No</strong>rwegian<br />
fleet dwindled from 55.5 million DWT<br />
in 1999 to 37.1 in 2006, or by 29.3 per cent,<br />
when the trend turned. By January 2008 it<br />
had recovered to 40.9 mill DWT.<br />
The question is: Was this a genuine<br />
decline, or a reflection of the changing<br />
structure of the fleet? The departure of<br />
VLCCs and large bulkers and a rising share<br />
of expensive supply ships?<br />
Definitely both. The number of vessels<br />
kept up between 1999 and 2006 quite well,<br />
despite sale of tonnage. But over time, from<br />
SCAVANGE AIRCOOLERS and HEAT EXCHANGERS<br />
for all major makes of diesel engines.<br />
Åkerivägen 8, S-152 42 SÖDERTÄLJE, Sverige<br />
Tel: 08-550 858 80, -550 858 81 | Fax: 08-550 809 71<br />
E-mail: scancool.sales@swipnet.se<br />
66 SCANDINAVIAN SHIPPING GAZETTE • MAY 16, 2008