2009 Annual Report - CRH
2009 Annual Report - CRH
2009 Annual Report - CRH
- TAGS
- annual
- www.crh.com

You also want an ePaper? Increase the reach of your titles
YUMPU automatically turns print PDFs into web optimized ePapers that Google loves.
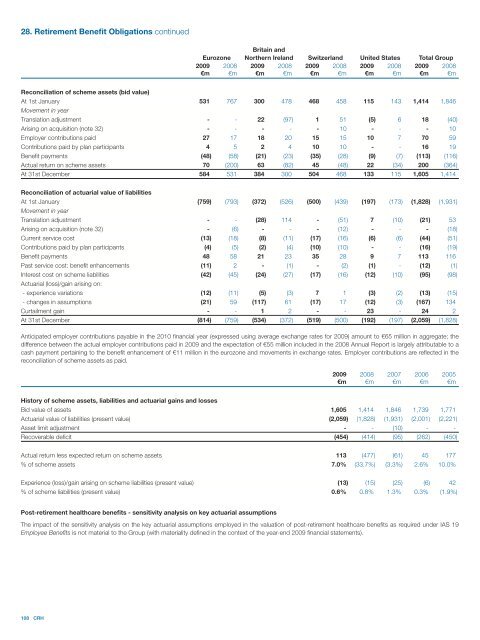
28. Retirement Benefit Obligations continued<br />
108 <strong>CRH</strong><br />
Eurozone<br />
Britain and<br />
Northern Ireland Switzerland United States Total Group<br />
<strong>2009</strong> 2008 <strong>2009</strong> 2008 <strong>2009</strong> 2008 <strong>2009</strong> 2008 <strong>2009</strong> 2008<br />
€m €m €m €m €m €m €m €m €m €m<br />
Reconciliation of scheme assets (bid value)<br />
At 1st January<br />
Movement in year<br />
531 767 300 478 468 458 115 143 1,414 1,846<br />
Translation adjustment - - 22 (97) 1 51 (5) 6 18 (40)<br />
Arising on acquisition (note 32) - - - - - 10 - - - 10<br />
Employer contributions paid 27 17 18 20 15 15 10 7 70 59<br />
Contributions paid by plan participants 4 5 2 4 10 10 - - 16 19<br />
Benefit payments (48) (58) (21) (23) (35) (28) (9) (7) (113) (116)<br />
Actual return on scheme assets 70 (200) 63 (82) 45 (48) 22 (34) 200 (364)<br />
At 31st December 584 531 384 300 504 468 133 115 1,605 1,414<br />
Reconciliation of actuarial value of liabilities<br />
At 1st January<br />
Movement in year<br />
(759) (793) (372) (526) (500) (439) (197) (173) (1,828) (1,931)<br />
Translation adjustment - - (28) 114 - (51) 7 (10) (21) 53<br />
Arising on acquisition (note 32) - (6) - - - (12) - - - (18)<br />
Current service cost (13) (18) (8) (11) (17) (16) (6) (6) (44) (51)<br />
Contributions paid by plan participants (4) (5) (2) (4) (10) (10) - - (16) (19)<br />
Benefit payments 48 58 21 23 35 28 9 7 113 116<br />
Past service cost: benefit enhancements (11) 2 - (1) - (2) (1) - (12) (1)<br />
Interest cost on scheme liabilities<br />
Actuarial (loss)/gain arising on:<br />
(42) (45) (24) (27) (17) (16) (12) (10) (95) (98)<br />
- experience variations (12) (11) (5) (3) 7 1 (3) (2) (13) (15)<br />
- changes in assumptions (21) 59 (117) 61 (17) 17 (12) (3) (167) 134<br />
Curtailment gain - - 1 2 - - 23 - 24 2<br />
At 31st December (814) (759) (534) (372) (519) (500) (192) (197) (2,059) (1,828)<br />
Anticipated employer contributions payable in the 2010 financial year (expressed using average exchange rates for <strong>2009</strong>) amount to €65 million in aggregate; the<br />
difference between the actual employer contributions paid in <strong>2009</strong> and the expectation of €55 million included in the 2008 <strong>Annual</strong> <strong>Report</strong> is largely attributable to a<br />
cash payment pertaining to the benefit enhancement of €11 million in the eurozone and movements in exchange rates. Employer contributions are reflected in the<br />
reconciliation of scheme assets as paid.<br />
<strong>2009</strong> 2008 2007 2006 2005<br />
€m €m €m €m €m<br />
History of scheme assets, liabilities and actuarial gains and losses<br />
Bid value of assets 1,605 1,414 1,846 1,739 1,771<br />
Actuarial value of liabilities (present value) (2,059) (1,828) (1,931) (2,001) (2,221)<br />
Asset limit adjustment - - (10) - -<br />
Recoverable deficit (454) (414) (95) (262) (450)<br />
Actual return less expected return on scheme assets 113 (477) (61) 45 177<br />
% of scheme assets 7.0% (33.7%) (3.3%) 2.6% 10.0%<br />
Experience (loss)/gain arising on scheme liabilities (present value) (13) (15) (25) (6) 42<br />
% of scheme liabilities (present value) 0.6% 0.8% 1.3% 0.3% (1.9%)<br />
Post-retirement healthcare benefits - sensitivity analysis on key actuarial assumptions<br />
The impact of the sensitivity analysis on the key actuarial assumptions employed in the valuation of post-retirement healthcare benefits as required under IAS 19<br />
Employee Benefits is not material to the Group (with materiality defined in the context of the year-end <strong>2009</strong> financial statements).