2009 Annual Report - CRH
2009 Annual Report - CRH
2009 Annual Report - CRH
- TAGS
- annual
- www.crh.com

Create successful ePaper yourself
Turn your PDF publications into a flip-book with our unique Google optimized e-Paper software.
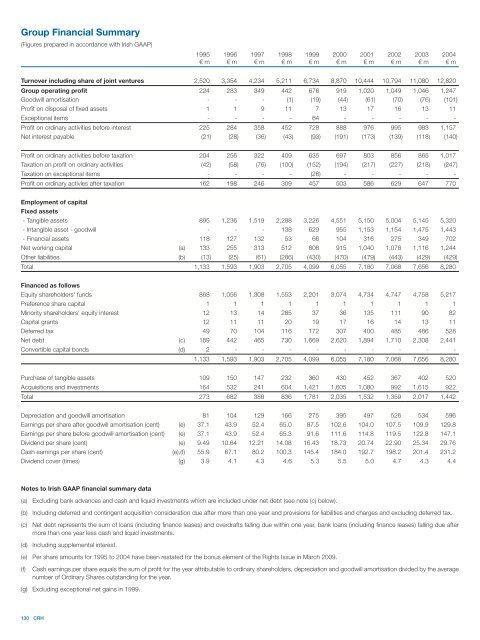
Group Financial Summary<br />
(Figures prepared in accordance with Irish GAAP)<br />
130 <strong>CRH</strong><br />
1995 1996 1997 1998 1999 2000 2001 2002 2003 2004<br />
€ m € m € m € m € m € m € m € m € m € m<br />
Turnover including share of joint ventures 2,520 3,354 4,234 5,211 6,734 8,870 10,444 10,794 11,080 12,820<br />
Group operating profit 224 283 349 442 676 919 1,020 1,049 1,046 1,247<br />
Goodwill amortisation - - - (1) (19) (44) (61) (70) (76) (101)<br />
Profit on disposal of fixed assets 1 1 9 11 7 13 17 16 13 11<br />
Exceptional items - - - - 64 - - - - -<br />
Profit on ordinary activities before interest 225 284 358 452 728 888 976 995 983 1,157<br />
Net interest payable (21) (28) (36) (43) (93) (191) (173) (139) (118) (140)<br />
Profit on ordinary activities before taxation 204 256 322 409 635 697 803 856 865 1,017<br />
Taxation on profit on ordinary activities (42) (58) (76) (100) (152) (194) (217) (227) (218) (247)<br />
Taxation on exceptional items - - - - (26) - - - - -<br />
Profit on ordinary activies after taxation 162 198 246 309 457 503 586 629 647 770<br />
Employment of capital<br />
Fixed assets<br />
- Tangible assets 895 1,236 1,519 2,288 3,226 4,551 5,150 5,004 5,145 5,320<br />
- Intangible asset - goodwill - - - 138 629 955 1,153 1,154 1,475 1,443<br />
- Financial assets 118 127 132 53 66 104 316 275 349 702<br />
Net working capital (a) 133 255 313 512 608 915 1,040 1,078 1,116 1,244<br />
Other liabilities (b) (13) (25) (61) (286) (430) (470) (479) (443) (429) (429)<br />
Total 1,133 1,593 1,903 2,705 4,099 6,055 7,180 7,068 7,656 8,280<br />
Financed as follows<br />
Equity shareholders' funds 868 1,056 1,308 1,553 2,201 3,074 4,734 4,747 4,758 5,217<br />
Preference share capital 1 1 1 1 1 1 1 1 1 1<br />
Minority shareholders' equity interest 12 13 14 285 37 36 135 111 90 82<br />
Capital grants 12 11 11 20 19 17 16 14 13 11<br />
Deferred tax 49 70 104 116 172 307 400 485 486 528<br />
Net debt (c) 189 442 465 730 1,669 2,620 1,894 1,710 2,308 2,441<br />
Convertible capital bonds (d) 2 - - - - - - - - -<br />
1,133 1,593 1,903 2,705 4,099 6,055 7,180 7,068 7,656 8,280<br />
Purchase of tangible assets 109 150 147 232 360 430 452 367 402 520<br />
Acquisitions and investments 164 532 241 604 1,421 1,605 1,080 992 1,615 922<br />
Total 273 682 388 836 1,781 2,035 1,532 1,359 2,017 1,442<br />
Depreciation and goodwill amortisation 81 104 129 166 275 395 497 526 534 596<br />
Earnings per share after goodwill amortisation (cent) (e) 37.1 43.9 52.4 65.0 87.5 102.6 104.0 107.5 109.9 129.8<br />
Earnings per share before goodwill amortisation (cent) (e) 37.1 43.9 52.4 65.3 91.6 111.6 114.8 119.5 122.8 147.1<br />
Dividend per share (cent) (e) 9.49 10.64 12.21 14.08 16.43 18.73 20.74 22.90 25.34 29.76<br />
Cash earnings per share (cent) (e),(f) 55.9 67.1 80.2 100.3 145.4 184.0 192.7 198.2 201.4 231.2<br />
Dividend cover (times) (g) 3.9 4.1 4.3 4.6 5.3 5.5 5.0 4.7 4.3 4.4<br />
Notes to Irish GAAP financial summary data<br />
(a) Excluding bank advances and cash and liquid investments which are included under net debt (see note (c) below).<br />
(b) Including deferred and contingent acquisition consideration due after more than one year and provisions for liabilities and charges and excluding deferred tax.<br />
(c) Net debt represents the sum of loans (including finance leases) and overdrafts falling due within one year, bank loans (including finance leases) falling due after<br />
more than one year less cash and liquid investments.<br />
(d) Including supplemental interest.<br />
(e) Per share amounts for 1995 to 2004 have been restated for the bonus element of the Rights Issue in March <strong>2009</strong>.<br />
(f) Cash earnings per share equals the sum of profit for the year attributable to ordinary shareholders, depreciation and goodwill amortisation divided by the average<br />
number of Ordinary Shares outstanding for the year.<br />
(g) Excluding exceptional net gains in 1999.