2009 Annual Report - CRH
2009 Annual Report - CRH
2009 Annual Report - CRH
- TAGS
- annual
- www.crh.com

Create successful ePaper yourself
Turn your PDF publications into a flip-book with our unique Google optimized e-Paper software.
Notes on Financial Statements<br />
1. Segment Information<br />
<strong>CRH</strong> is a diversified international building materials group which manufactures and distributes a range of building materials products from the fundamentals of heavy<br />
materials and elements to construct the frame, through value-added products that complete the building envelope, to distribution channels which service construction<br />
fit-out and renewal. Based on these key strategic drivers across the value chain, the Group is organised into six business segments comprising Europe Materials<br />
(including activities in China and India), Europe Products, Europe Distribution, Americas Materials, Americas Products and Americas Distribution. No operating<br />
segments have been aggregated to form these segments.<br />
Materials businesses are predominantly engaged in the production and sale of a range of primary materials including cement, aggregates, readymixed concrete,<br />
asphalt/bitumen and agricultural and/or chemical lime.<br />
Products businesses are predominantly engaged in the production and sale of architectural and structural concrete products, clay products, insulation products,<br />
fabricated and tempered glass products, construction accessories and the provision of a wide range of inter-related products and services to the construction sector.<br />
Distribution businesses encompass builders merchanting activities and Do-It-Yourself (DIY) stores engaged in the marketing and sale of supplies to the construction<br />
sector and to the general public.<br />
The principal factors employed in the identification of the six segments reflected in this note include the Group’s organisational structure, the nature of the reporting<br />
lines to the Chief Operating Decision-Maker (as defined in IFRS 8 Operating Segments), the structure of internal reporting documentation such as management<br />
accounts and budgets, and the degree of homogeneity of products, services and geographical areas within each of the segments from which revenue is derived.<br />
The Chief Operating Decision-Maker monitors the operating results of segments separately in order to allocate resources between segments and to assess<br />
performance. Segment performance is predominantly evaluated based on operating profit. As performance is also evaluated using operating profit before depreciation<br />
and amortisation (EBITDA), supplemental information based on EBITDA is also provided below. Given that net finance costs and income tax are managed on a<br />
centralised basis, these items are not allocated between operating segments for the purposes of the information presented to the Chief Operating Decision-Maker<br />
and are accordingly omitted from the detailed segmental analysis below.<br />
Although IFRS 8 is being applied for the first time, there have been no changes to the basis of segmentation or to the basis of measurement of operating profit in<br />
compiling the consolidated financial statements in respect of the year ended 31st December <strong>2009</strong>. In addition, there are no asymmetrical allocations to reporting<br />
segments which would require disclosure.<br />
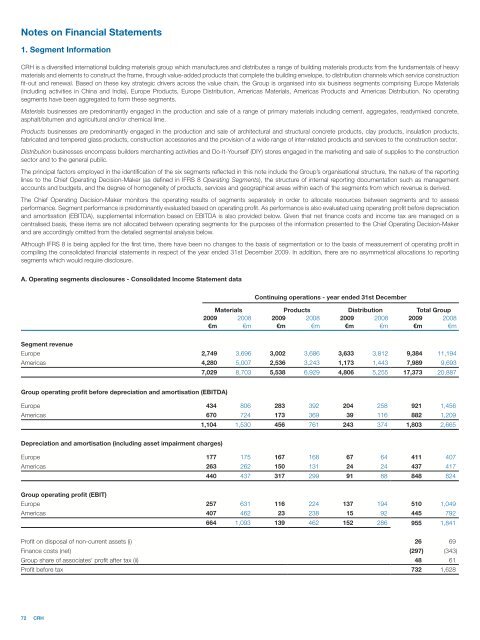
A. Operating segments disclosures - Consolidated Income Statement data<br />
72 <strong>CRH</strong><br />
Continuing operations - year ended 31st December<br />
Materials Products Distribution Total Group<br />
<strong>2009</strong> 2008 <strong>2009</strong> 2008 <strong>2009</strong> 2008 <strong>2009</strong> 2008<br />
€m €m €m €m €m €m €m €m<br />
Segment revenue<br />
Europe 2,749 3,696 3,002 3,686 3,633 3,812 9,384 11,194<br />
Americas 4,280 5,007 2,536 3,243 1,173 1,443 7,989 9,693<br />
7,029 8,703 5,538 6,929 4,806 5,255 17,373 20,887<br />
Group operating profit before depreciation and amortisation (EBITDA)<br />
Europe 434 806 283 392 204 258 921 1,456<br />
Americas 670 724 173 369 39 116 882 1,209<br />
1,104 1,530 456 761 243 374 1,803 2,665<br />
Depreciation and amortisation (including asset impairment charges)<br />
Europe 177 175 167 168 67 64 411 407<br />
Americas 263 262 150 131 24 24 437 417<br />
440 437 317 299 91 88 848 824<br />
Group operating profit (EBIT)<br />
Europe 257 631 116 224 137 194 510 1,049<br />
Americas 407 462 23 238 15 92 445 792<br />
664 1,093 139 462 152 286 955 1,841<br />
Profit on disposal of non-current assets (i) 26 69<br />
Finance costs (net) (297) (343)<br />
Group share of associates' profit after tax (ii) 48 61<br />
Profit before tax 732 1,628