15 February 2012 - Auckland District Health Board
15 February 2012 - Auckland District Health Board
15 February 2012 - Auckland District Health Board
Create successful ePaper yourself
Turn your PDF publications into a flip-book with our unique Google optimized e-Paper software.
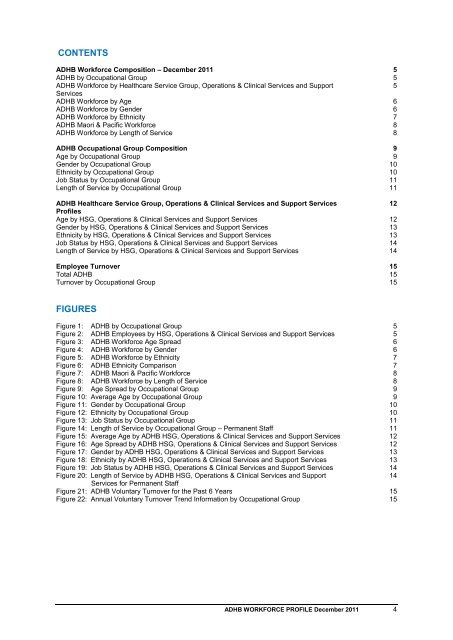
CONTENTS<br />
ADHB Workforce Composition – December 2011 5<br />
ADHB by Occupational Group 5<br />
ADHB Workforce by <strong>Health</strong>care Service Group, Operations & Clinical Services and Support<br />
Services<br />
5<br />
ADHB Workforce by Age 6<br />
ADHB Workforce by Gender 6<br />
ADHB Workforce by Ethnicity 7<br />
ADHB Maori & Pacific Workforce 8<br />
ADHB Workforce by Length of Service 8<br />
ADHB Occupational Group Composition 9<br />
Age by Occupational Group 9<br />
Gender by Occupational Group 10<br />
Ethnicity by Occupational Group 10<br />
Job Status by Occupational Group 11<br />
Length of Service by Occupational Group 11<br />
ADHB <strong>Health</strong>care Service Group, Operations & Clinical Services and Support Services<br />
Profiles<br />
12<br />
Age by HSG, Operations & Clinical Services and Support Services 12<br />
Gender by HSG, Operations & Clinical Services and Support Services 13<br />
Ethnicity by HSG, Operations & Clinical Services and Support Services 13<br />
Job Status by HSG, Operations & Clinical Services and Support Services 14<br />
Length of Service by HSG, Operations & Clinical Services and Support Services 14<br />
Employee Turnover <strong>15</strong><br />
Total ADHB <strong>15</strong><br />
Turnover by Occupational Group <strong>15</strong><br />
FIGURES<br />
Figure 1: ADHB by Occupational Group 5<br />
Figure 2: ADHB Employees by HSG, Operations & Clinical Services and Support Services 5<br />
Figure 3: ADHB Workforce Age Spread 6<br />
Figure 4: ADHB Workforce by Gender 6<br />
Figure 5: ADHB Workforce by Ethnicity 7<br />
Figure 6: ADHB Ethnicity Comparison 7<br />
Figure 7: ADHB Maori & Pacific Workforce 8<br />
Figure 8: ADHB Workforce by Length of Service 8<br />
Figure 9: Age Spread by Occupational Group 9<br />
Figure 10: Average Age by Occupational Group 9<br />
Figure 11: Gender by Occupational Group 10<br />
Figure 12: Ethnicity by Occupational Group 10<br />
Figure 13: Job Status by Occupational Group 11<br />
Figure 14: Length of Service by Occupational Group – Permanent Staff 11<br />
Figure <strong>15</strong>: Average Age by ADHB HSG, Operations & Clinical Services and Support Services 12<br />
Figure 16: Age Spread by ADHB HSG, Operations & Clinical Services and Support Services 12<br />
Figure 17: Gender by ADHB HSG, Operations & Clinical Services and Support Services 13<br />
Figure 18: Ethnicity by ADHB HSG, Operations & Clinical Services and Support Services 13<br />
Figure 19: Job Status by ADHB HSG, Operations & Clinical Services and Support Services 14<br />
Figure 20: Length of Service by ADHB HSG, Operations & Clinical Services and Support<br />
14<br />
Services for Permanent Staff<br />
Figure 21: ADHB Voluntary Turnover for the Past 6 Years <strong>15</strong><br />
Figure 22: Annual Voluntary Turnover Trend Information by Occupational Group<br />
<strong>15</strong><br />
ADHB WORKFORCE PROFILE December 2011 4


