15 February 2012 - Auckland District Health Board
15 February 2012 - Auckland District Health Board
15 February 2012 - Auckland District Health Board

Create successful ePaper yourself
Turn your PDF publications into a flip-book with our unique Google optimized e-Paper software.
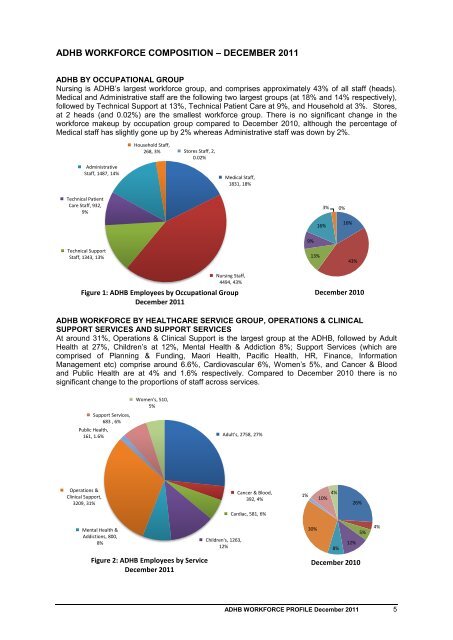
ADHB WORKFORCE COMPOSITION – DECEMBER 2011<br />
ADHB BY OCCUPATIONAL GROUP<br />
Nursing is ADHB’s largest workforce group, and comprises approximately 43% of all staff (heads).<br />
Medical and Administrative staff are the following two largest groups (at 18% and 14% respectively),<br />
followed by Technical Support at 13%, Technical Patient Care at 9%, and Household at 3%. Stores,<br />
at 2 heads (and 0.02%) are the smallest workforce group. There is no significant change in the<br />
workforce makeup by occupation group compared to December 2010, although the percentage of<br />
Medical staff has slightly gone up by 2% whereas Administrative staff was down by 2%.<br />
Administrative<br />
Staff, 1487, 14%<br />
Technical Patient<br />
Care Staff, 932,<br />
9%<br />
Technical Support<br />
Staff, 1343, 13%<br />
Household Staff,<br />
268, 3% Stores Staff, 2,<br />
0.02%<br />
Medical Staff,<br />
1831, 18%<br />
Nursing Staff,<br />
4494, 43%<br />
Figure 1: ADHB Employees by Occupational Group<br />
December 2011<br />
ADHB WORKFORCE BY HEALTHCARE SERVICE GROUP, OPERATIONS & CLINICAL<br />
SUPPORT SERVICES AND SUPPORT SERVICES<br />
At around 31%, Operations & Clinical Support is the largest group at the ADHB, followed by Adult<br />
<strong>Health</strong> at 27%, Children’s at 12%, Mental <strong>Health</strong> & Addiction 8%; Support Services (which are<br />
comprised of Planning & Funding, Maori <strong>Health</strong>, Pacific <strong>Health</strong>, HR, Finance, Information<br />
Management etc) comprise around 6.6%, Cardiovascular 6%, Women’s 5%, and Cancer & Blood<br />
and Public <strong>Health</strong> are at 4% and 1.6% respectively. Compared to December 2010 there is no<br />
significant change to the proportions of staff across services.<br />
Operations &<br />
Clinical Support,<br />
3209, 31%<br />
Support Services,<br />
683 , 6%<br />
Public <strong>Health</strong>,<br />
161, 1.6%<br />
Mental <strong>Health</strong> &<br />
Addictions, 800,<br />
8%<br />
Women's, 510,<br />
5%<br />
Figure 2: ADHB Employees by Service<br />
December 2011<br />
Adult's, 2758, 27%<br />
Children's, 1263,<br />
12%<br />
Cancer & Blood,<br />
392, 4%<br />
Cardiac, 581, 6%<br />
1%<br />
9%<br />
13%<br />
30%<br />
16%<br />
3% 0%<br />
16%<br />
43%<br />
December 2010<br />
10%<br />
12%<br />
26%<br />
ADHB WORKFORCE PROFILE December 2011 5<br />
4%<br />
8%<br />
December 2010<br />
5%<br />
4%