15 February 2012 - Auckland District Health Board
15 February 2012 - Auckland District Health Board
15 February 2012 - Auckland District Health Board

Create successful ePaper yourself
Turn your PDF publications into a flip-book with our unique Google optimized e-Paper software.
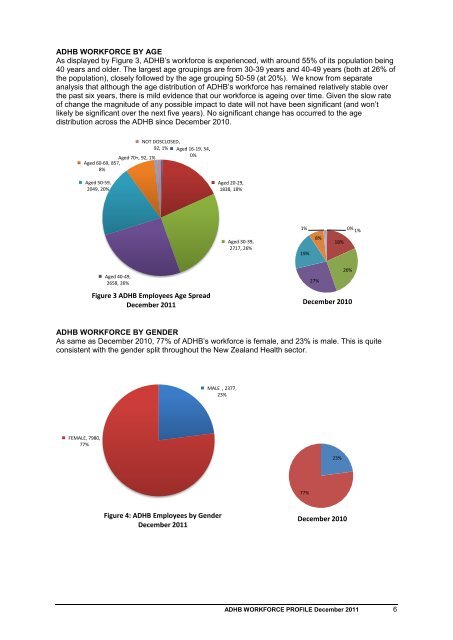
ADHB WORKFORCE BY AGE<br />
As displayed by Figure 3, ADHB’s workforce is experienced, with around 55% of its population being<br />
40 years and older. The largest age groupings are from 30-39 years and 40-49 years (both at 26% of<br />
the population), closely followed by the age grouping 50-59 (at 20%). We know from separate<br />
analysis that although the age distribution of ADHB’s workforce has remained relatively stable over<br />
the past six years, there is mild evidence that our workforce is ageing over time. Given the slow rate<br />
of change the magnitude of any possible impact to date will not have been significant (and won’t<br />
likely be significant over the next five years). No significant change has occurred to the age<br />
distribution across the ADHB since December 2010.<br />
Aged 70+, 92, 1%<br />
Aged 60-69, 857,<br />
8%<br />
Aged 50-59,<br />
2049, 20%<br />
Aged 40-49,<br />
2658, 26%<br />
NOT DOSCLOSED,<br />
92, 1%<br />
Aged 16-19, 54,<br />
0%<br />
Figure 3 ADHB Employees Age Spread<br />
December 2011<br />
Aged 20-29,<br />
1838, 18%<br />
Aged 30-39,<br />
2717, 26%<br />
1% 0% 1%<br />
ADHB WORKFORCE BY GENDER<br />
As same as December 2010, 77% of ADHB’s workforce is female, and 23% is male. This is quite<br />
consistent with the gender split throughout the New Zealand <strong>Health</strong> sector.<br />
FEMALE, 7980,<br />
77%<br />
Figure 4: ADHB Employees by Gender<br />
December 2011<br />
MALE , 2377,<br />
23%<br />
19%<br />
27%<br />
18%<br />
26%<br />
ADHB WORKFORCE PROFILE December 2011 6<br />
8%<br />
December 2010<br />
77%<br />
23%<br />
December 2010