Análisis de la influencia social sobre la mortalidad por cáncer en la
Análisis de la influencia social sobre la mortalidad por cáncer en la
Análisis de la influencia social sobre la mortalidad por cáncer en la

You also want an ePaper? Increase the reach of your titles
YUMPU automatically turns print PDFs into web optimized ePapers that Google loves.
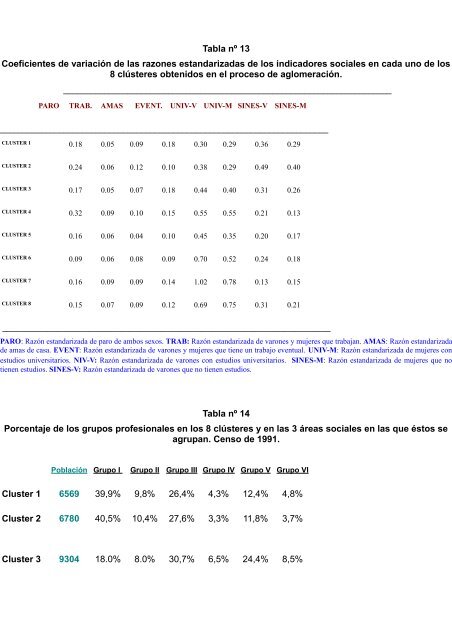
Tab<strong>la</strong> nº 13<br />
Coefici<strong>en</strong>tes <strong>de</strong> variación <strong>de</strong> <strong>la</strong>s razones estandarizadas <strong>de</strong> los indicadores <strong>social</strong>es <strong>en</strong> cada uno <strong>de</strong> los<br />
8 clústeres obt<strong>en</strong>idos <strong>en</strong> el proceso <strong>de</strong> aglomeración.<br />
________________________________________________________________________<br />
PARO TRAB. AMAS EVENT. UNIV-V UNIV-M SINES-V SINES-M<br />
________________________________________________________________________<br />
CLUSTER 1 0.18 0.05 0.09 0.18 0.30 0.29 0.36 0.29<br />
CLUSTER 2 0.24 0.06 0.12 0.10 0.38 0.29 0.49 0.40<br />
CLUSTER 3 0.17 0.05 0.07 0.18 0.44 0.40 0.31 0.26<br />
CLUSTER 4 0.32 0.09 0.10 0.15 0.55 0.55 0.21 0.13<br />
CLUSTER 5 0.16 0.06 0.04 0.10 0.45 0.35 0.20 0.17<br />
CLUSTER 6 0.09 0.06 0.08 0.09 0.70 0.52 0.24 0.18<br />
CLUSTER 7 0.16 0.09 0.09 0.14 1.02 0.78 0.13 0.15<br />
CLUSTER 8 0.15 0.07 0.09 0.12 0.69 0.75 0.31 0.21<br />
________________________________________________________________________<br />
PARO: Razón estandarizada <strong>de</strong> paro <strong>de</strong> ambos sexos. TRAB: Razón estandarizada <strong>de</strong> varones y mujeres que trabajan. AMAS: Razón estandarizada<br />
<strong>de</strong> amas <strong>de</strong> casa. EVENT: Razón estandarizada <strong>de</strong> varones y mujeres que ti<strong>en</strong>e un trabajo ev<strong>en</strong>tual. UNIV-M: Razón estandarizada <strong>de</strong> mujeres con<br />
estudios universitarios. NIV-V: Razón estandarizada <strong>de</strong> varones con estudios universitarios. SINES-M: Razón estandarizada <strong>de</strong> mujeres que no<br />
ti<strong>en</strong><strong>en</strong> estudios. SINES-V: Razón estandarizada <strong>de</strong> varones que no ti<strong>en</strong><strong>en</strong> estudios.<br />
Tab<strong>la</strong> nº 14<br />
Porc<strong>en</strong>taje <strong>de</strong> los grupos profesionales <strong>en</strong> los 8 clústeres y <strong>en</strong> <strong>la</strong>s 3 áreas <strong>social</strong>es <strong>en</strong> <strong>la</strong>s que éstos se<br />
agrupan. C<strong>en</strong>so <strong>de</strong> 1991.<br />
Pob<strong>la</strong>ción Grupo I Grupo II Grupo III Grupo IV Grupo V Grupo VI<br />
Cluster 1 6569 39,9% 9,8% 26,4% 4,3% 12,4% 4,8%<br />
Cluster 2 6780 40,5% 10,4% 27,6% 3,3% 11,8% 3,7%<br />
Cluster 3 9304 18.0% 8.0% 30,7% 6,5% 24,4% 8,5%