Informe Nº 3 - Tribunal de Defensa de la Libre Competencia
Informe Nº 3 - Tribunal de Defensa de la Libre Competencia
Informe Nº 3 - Tribunal de Defensa de la Libre Competencia

Create successful ePaper yourself
Turn your PDF publications into a flip-book with our unique Google optimized e-Paper software.
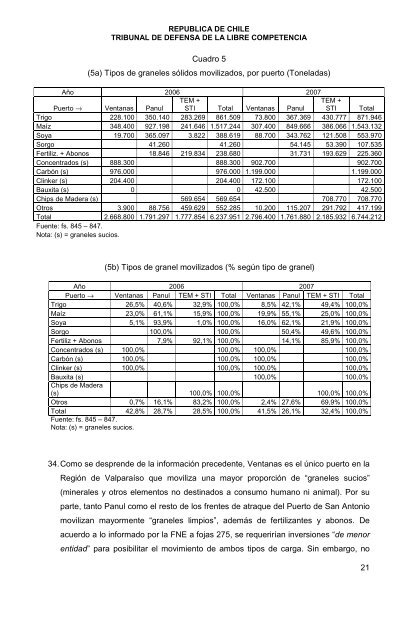
REPUBLICA DE CHILE<br />
TRIBUNAL DE DEFENSA DE LA LIBRE COMPETENCIA<br />
Cuadro 5<br />
(5a) Tipos <strong>de</strong> graneles sólidos movilizados, por puerto (Tone<strong>la</strong>das)<br />
Año 2006 2007<br />
TEM +<br />
TEM +<br />
Puerto → Ventanas Panul STI Total Ventanas Panul STI Total<br />
Trigo 228.100 350.140 283.269 861.509 73.800 367.369 430.777 871.946<br />
Maíz 348.400 927.198 241.646 1.517.244 307.400 849.666 386.066 1.543.132<br />
Soya 19.700 365.097 3.822 388.619 88.700 343.762 121.508 553.970<br />
Sorgo 41.260 41.260 54.145 53.390 107.535<br />
Fertiliz. + Abonos 18.846 219.834 238.680 31.731 193.629 225.360<br />
Concentrados (s) 888.300 888.300 902.700 902.700<br />
Carbón (s) 976.000 976.000 1.199.000 1.199.000<br />
Clinker (s) 204.400 204.400 172.100 172.100<br />
Bauxita (s) 0 0 42.500 42.500<br />
Chips <strong>de</strong> Ma<strong>de</strong>ra (s) 569.654 569.654 708.770 708.770<br />
Otros 3.900 88.756 459.629 552.285 10.200 115.207 291.792 417.199<br />
Total 2.668.800 1.791.297 1.777.854 6.237.951 2.796.400 1.761.880 2.185.932 6.744.212<br />
Fuente: fs. 845 – 847.<br />
Nota: (s) = graneles sucios.<br />
(5b) Tipos <strong>de</strong> granel movilizados (% según tipo <strong>de</strong> granel)<br />
Año 2006 2007<br />
Puerto → Ventanas Panul TEM + STI Total Ventanas Panul TEM + STI Total<br />
Trigo 26,5% 40,6% 32,9% 100,0% 8,5% 42,1% 49,4% 100,0%<br />
Maíz 23,0% 61,1% 15,9% 100,0% 19,9% 55,1% 25,0% 100,0%<br />
Soya 5,1% 93,9% 1,0% 100,0% 16,0% 62,1% 21,9% 100,0%<br />
Sorgo 100,0% 100,0% 50,4% 49,6% 100,0%<br />
Fertiliz + Abonos 7,9% 92,1% 100,0% 14,1% 85,9% 100,0%<br />
Concentrados (s) 100,0% 100,0% 100,0% 100,0%<br />
Carbón (s) 100,0% 100,0% 100,0% 100,0%<br />
Clinker (s) 100,0% 100,0% 100,0% 100,0%<br />
Bauxita (s) 100,0% 100,0%<br />
Chips <strong>de</strong> Ma<strong>de</strong>ra<br />
(s) 100,0% 100,0% 100,0% 100,0%<br />
Otros 0,7% 16,1% 83,2% 100,0% 2,4% 27,6% 69,9% 100,0%<br />
Total 42,8% 28,7% 28,5% 100,0% 41,5% 26,1% 32,4% 100,0%<br />
Fuente: fs. 845 – 847.<br />
Nota: (s) = graneles sucios.<br />
34. Como se <strong>de</strong>spren<strong>de</strong> <strong>de</strong> <strong>la</strong> información prece<strong>de</strong>nte, Ventanas es el único puerto en <strong>la</strong><br />
Región <strong>de</strong> Valparaíso que moviliza una mayor proporción <strong>de</strong> “graneles sucios”<br />
(minerales y otros elementos no <strong>de</strong>stinados a consumo humano ni animal). Por su<br />
parte, tanto Panul como el resto <strong>de</strong> los frentes <strong>de</strong> atraque <strong>de</strong>l Puerto <strong>de</strong> San Antonio<br />
movilizan mayormente “graneles limpios”, a<strong>de</strong>más <strong>de</strong> fertilizantes y abonos. De<br />
acuerdo a lo informado por <strong>la</strong> FNE a fojas 275, se requerirían inversiones “<strong>de</strong> menor<br />
entidad” para posibilitar el movimiento <strong>de</strong> ambos tipos <strong>de</strong> carga. Sin embargo, no<br />
21