Informe Nº 3 - Tribunal de Defensa de la Libre Competencia
Informe Nº 3 - Tribunal de Defensa de la Libre Competencia
Informe Nº 3 - Tribunal de Defensa de la Libre Competencia

You also want an ePaper? Increase the reach of your titles
YUMPU automatically turns print PDFs into web optimized ePapers that Google loves.
REPUBLICA DE CHILE<br />
TRIBUNAL DE DEFENSA DE LA LIBRE COMPETENCIA<br />
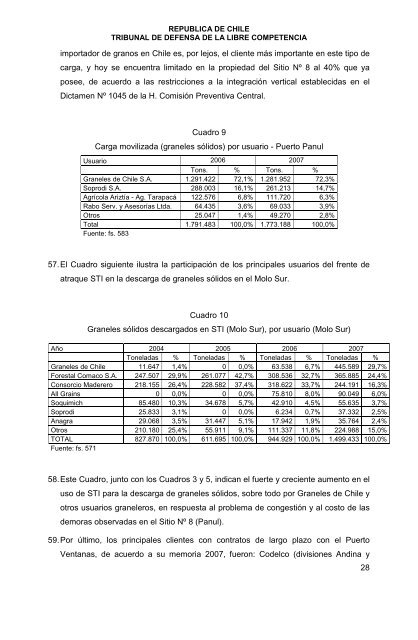
importador <strong>de</strong> granos en Chile es, por lejos, el cliente más importante en este tipo <strong>de</strong><br />
carga, y hoy se encuentra limitado en <strong>la</strong> propiedad <strong>de</strong>l Sitio <strong>Nº</strong> 8 al 40% que ya<br />
posee, <strong>de</strong> acuerdo a <strong>la</strong>s restricciones a <strong>la</strong> integración vertical establecidas en el<br />
Dictamen <strong>Nº</strong> 1045 <strong>de</strong> <strong>la</strong> H. Comisión Preventiva Central.<br />
Cuadro 9<br />
Carga movilizada (graneles sólidos) por usuario - Puerto Panul<br />
Usuario 2006 2007<br />
Tons. % Tons. %<br />
Graneles <strong>de</strong> Chile S.A. 1.291.422 72,1% 1.281.952 72,3%<br />
Soprodi S.A. 288.003 16,1% 261.213 14,7%<br />
Agríco<strong>la</strong> Ariztía - Ag. Tarapacá 122.576 6,8% 111.720 6,3%<br />
Rabo Serv. y Asesorías Ltda. 64.435 3,6% 69.033 3,9%<br />
Otros 25.047 1,4% 49.270 2,8%<br />
Total 1.791.483 100,0% 1.773.188 100,0%<br />
Fuente: fs. 583<br />
57. El Cuadro siguiente ilustra <strong>la</strong> participación <strong>de</strong> los principales usuarios <strong>de</strong>l frente <strong>de</strong><br />
atraque STI en <strong>la</strong> <strong>de</strong>scarga <strong>de</strong> graneles sólidos en el Molo Sur.<br />
Cuadro 10<br />
Graneles sólidos <strong>de</strong>scargados en STI (Molo Sur), por usuario (Molo Sur)<br />
Año 2004 2005 2006 2007<br />
Tone<strong>la</strong>das % Tone<strong>la</strong>das % Tone<strong>la</strong>das % Tone<strong>la</strong>das %<br />
Graneles <strong>de</strong> Chile 11.647 1,4% 0 0,0% 63.538 6,7% 445.589 29,7%<br />
Forestal Comaco S.A. 247.507 29,9% 261.077 42,7% 308.536 32,7% 365.885 24,4%<br />
Consorcio Ma<strong>de</strong>rero 218.155 26,4% 228.582 37,4% 318.622 33,7% 244.191 16,3%<br />
All Grains 0 0,0% 0 0,0% 75.810 8,0% 90.049 6,0%<br />
Soquimich 85.480 10,3% 34.678 5,7% 42.910 4,5% 55.635 3,7%<br />
Soprodi 25.833 3,1% 0 0,0% 6.234 0,7% 37.332 2,5%<br />
Anagra 29.068 3,5% 31.447 5,1% 17.942 1,9% 35.764 2,4%<br />
Otros 210.180 25,4% 55.911 9,1% 111.337 11,8% 224.988 15,0%<br />
TOTAL 827.870 100,0% 611.695 100,0% 944.929 100,0% 1.499.433 100,0%<br />
Fuente: fs. 571<br />
58. Este Cuadro, junto con los Cuadros 3 y 5, indican el fuerte y creciente aumento en el<br />
uso <strong>de</strong> STI para <strong>la</strong> <strong>de</strong>scarga <strong>de</strong> graneles sólidos, sobre todo por Graneles <strong>de</strong> Chile y<br />
otros usuarios graneleros, en respuesta al problema <strong>de</strong> congestión y al costo <strong>de</strong> <strong>la</strong>s<br />
<strong>de</strong>moras observadas en el Sitio <strong>Nº</strong> 8 (Panul).<br />
59. Por último, los principales clientes con contratos <strong>de</strong> <strong>la</strong>rgo p<strong>la</strong>zo con el Puerto<br />
Ventanas, <strong>de</strong> acuerdo a su memoria 2007, fueron: Co<strong>de</strong>lco (divisiones Andina y<br />
28