Documento final del Grupo de Trabajo de Conama 10 Transporte ...
Documento final del Grupo de Trabajo de Conama 10 Transporte ...
Documento final del Grupo de Trabajo de Conama 10 Transporte ...

You also want an ePaper? Increase the reach of your titles
YUMPU automatically turns print PDFs into web optimized ePapers that Google loves.
<strong>Documento</strong> <strong>final</strong> <strong><strong>de</strong>l</strong> <strong>Grupo</strong> <strong>de</strong> <strong>Trabajo</strong> <strong>de</strong> <strong>Conama</strong> <strong>10</strong>:<br />
<strong>Transporte</strong> sostenible<br />
80%<br />
60%<br />
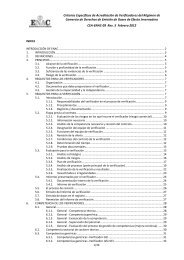
Valor Añadido Bruto por sectores (%)<br />
Venta y Reparación<br />
Vehículos a Motor.<br />
Estaciones <strong>de</strong> Servicio<br />
1,7%<br />
<strong>Transporte</strong> 4,2%<br />
40%<br />
61,2%<br />
20%<br />
Industria <strong><strong>de</strong>l</strong> <strong>Transporte</strong><br />
3,3%<br />
0%<br />
14,8%<br />
9,3%<br />
11,5%<br />
3,2%<br />
Sector Primario <strong>Transporte</strong> Total Construcción Industria y Energía Servicios<br />
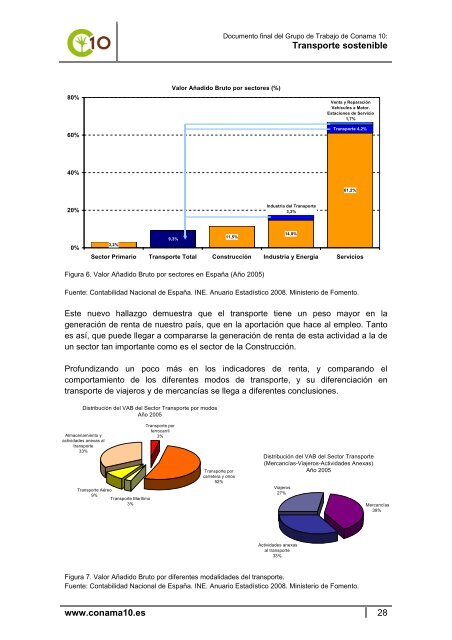
Figura 6. Valor Añadido Bruto por sectores en España (Año 2005)<br />
Fuente: Contabilidad Nacional <strong>de</strong> España. INE. Anuario Estadístico 2008. Ministerio <strong>de</strong> Fomento.<br />
Este nuevo hallazgo <strong>de</strong>muestra que el transporte tiene un peso mayor en la<br />
generación <strong>de</strong> renta <strong>de</strong> nuestro país, que en la aportación que hace al empleo. Tanto<br />
es así, que pue<strong>de</strong> llegar a compararse la generación <strong>de</strong> renta <strong>de</strong> esta actividad a la <strong>de</strong><br />
un sector tan importante como es el sector <strong>de</strong> la Construcción.<br />
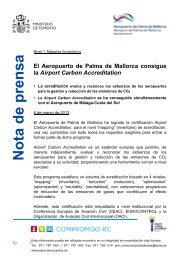
Profundizando un poco más en los indicadores <strong>de</strong> renta, y comparando el<br />
comportamiento <strong>de</strong> los diferentes modos <strong>de</strong> transporte, y su diferenciación en<br />
transporte <strong>de</strong> viajeros y <strong>de</strong> mercancías se llega a diferentes conclusiones.<br />
Distribución <strong><strong>de</strong>l</strong> VAB <strong><strong>de</strong>l</strong> Sector <strong>Transporte</strong> por modos<br />
Año 2005<br />
Almacenamiento y<br />
activida<strong>de</strong>s anexas al<br />
transporte<br />
33%<br />
<strong>Transporte</strong> Aéreo<br />
9%<br />
<strong>Transporte</strong> Marítimo<br />
3%<br />
<strong>Transporte</strong> por<br />
ferrocarril<br />
3%<br />
<strong>Transporte</strong> por<br />
carretera y otros<br />
52%<br />
Distribución <strong><strong>de</strong>l</strong> VAB <strong><strong>de</strong>l</strong> Sector <strong>Transporte</strong><br />
(Mercancías-Viajeros-Activida<strong>de</strong>s Anexas)<br />
Año 2005<br />
Viajeros<br />
27%<br />
Mercancías<br />
39%<br />
Activida<strong>de</strong>s anexas<br />
al transporte<br />
33%<br />
Figura 7. Valor Añadido Bruto por diferentes modalida<strong>de</strong>s <strong><strong>de</strong>l</strong> transporte.<br />
Fuente: Contabilidad Nacional <strong>de</strong> España. INE. Anuario Estadístico 2008. Ministerio <strong>de</strong> Fomento.<br />
www.conama<strong>10</strong>.es 28