Reseña de Valores 2012 - Bolsa de Santiago
Reseña de Valores 2012 - Bolsa de Santiago
Reseña de Valores 2012 - Bolsa de Santiago
- No tags were found...

Create successful ePaper yourself
Turn your PDF publications into a flip-book with our unique Google optimized e-Paper software.
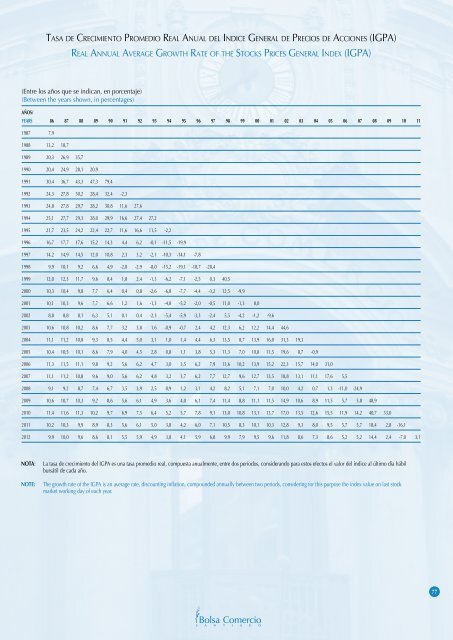
Tasa <strong>de</strong> Crecimiento Promedio Real Anual <strong>de</strong>l Indice General <strong>de</strong> Precios <strong>de</strong> Acciones (IGPA)Real Annual Average Growth Rate of the Stocks Prices General In<strong>de</strong>x (IGPA)(Entre los años que se indican, en porcentaje)(Between the years shown, in percentages)AÑOS/YEARS 86 87 88 89 90 91 92 93 94 95 96 97 98 99 00 01 02 03 04 05 06 07 08 09 10 111987 7,91988 13,2 18,71989 20,3 26,9 35,71990 20,4 24,9 28,1 20,91991 30,4 36,7 43,3 47,3 79,41992 24,3 27,8 30,2 28,4 32,4 -2,31993 24,8 27,8 29,7 28,2 30,8 11,6 27,61994 25,1 27,7 29,3 28,0 29,9 16,6 27,4 27,21995 21,7 23,5 24,2 22,4 22,7 11,6 16,6 11,5 -2,21996 16,7 17,7 17,6 15,2 14,3 4,4 6,2 -0,1 -11,5 -19,91997 14,2 14,9 14,5 12,0 10,8 2,3 3,2 -2,1 -10,3 -14,1 -7,81998 9,9 10,1 9,2 6,6 4,9 -2,8 -2,9 -8,0 -15,2 -19,1 -18,7 -28,41999 12,0 12,3 11,7 9,6 8,4 1,8 2,4 -1,3 -6,2 -7,1 -2,5 0,3 40,52000 10,3 10,4 9,8 7,7 6,4 0,4 0,8 -2,6 -6,8 -7,7 -4,4 -3,2 12,5 -9,92001 10,1 10,3 9,6 7,7 6,6 1,2 1,6 -1,3 -4,8 -5,2 -2,0 -0,5 11,0 -1,3 8,02002 8,8 8,8 8,1 6,3 5,1 0,1 0,4 -2,3 -5,4 -5,9 -3,3 -2,4 5,5 -4,2 -1,2 -9,62003 10,6 10,8 10,2 8,6 7,7 3,2 3,8 1,6 -0,9 -0,7 2,4 4,2 12,3 6,2 12,2 14,4 44,62004 11,1 11,2 10,8 9,3 8,5 4,4 5,0 3,1 1,0 1,4 4,4 6,3 13,5 8,7 13,9 16,0 31,3 19,32005 10,4 10,5 10,1 8,6 7,9 4,0 4,5 2,8 0,8 1,1 3,8 5,3 11,3 7,0 10,8 11,5 19,6 8,7 -0,92006 11,3 11,5 11,1 9,8 9,2 5,6 6,2 4,7 3,0 3,5 6,2 7,9 13,6 10,2 13,9 15,2 22,3 15,7 14,0 31,02007 11,1 11,2 10,8 9,6 9,0 5,6 6,2 4,8 3,2 3,7 6,2 7,7 12,7 9,6 12,7 13,5 18,8 13,1 11,1 17,6 5,52008 9,1 9,2 8,7 7,4 6,7 3,5 3,9 2,5 0,9 1,2 3,1 4,2 8,2 5,1 7,1 7,0 10,0 4,2 0,7 1,3 -11,0 -24,92009 10,6 10,7 10,3 9,2 8,6 5,6 6,1 4,9 3,6 4,0 6,1 7,4 11,4 8,8 11,1 11,5 14,9 10,6 8,9 11,5 5,7 5,8 48,92010 11,4 11,6 11,3 10,2 9,7 6,9 7,5 6,4 5,2 5,7 7,8 9,1 13,0 10,8 13,1 13,7 17,0 13,5 12,6 15,5 11,9 14,2 40,7 33,02011 10,2 10,3 9,9 8,9 8,3 5,6 6,1 5,0 3,8 4,2 6,0 7,1 10,5 8,3 10,1 10,3 12,8 9,3 8,0 9,5 5,7 5,7 18,4 2,8 -16,1<strong>2012</strong> 9,9 10,0 9,6 8,6 8,1 5,5 5,9 4,9 3,8 4,1 5,9 6,8 9,9 7,9 9,5 9,6 11,8 8,6 7,3 8,6 5,2 5,2 14,4 2,4 -7,0 3,177NOTA:NOTE:La tasa <strong>de</strong> crecimiento <strong>de</strong>l IGPA es una tasa promedio real, compuesta anualmente, entre dos períodos, consi<strong>de</strong>rando para estos efectos el valor <strong>de</strong>l índice al último día hábilbursátil <strong>de</strong> cada año.The growth rate of the IGPA is an average rate, discounting inflation, compoun<strong>de</strong>d annually between two periods, consi<strong>de</strong>ring for this purpose the in<strong>de</strong>x value on last stockmarket working day of each year.77