Reseña de Valores 2012 - Bolsa de Santiago
Reseña de Valores 2012 - Bolsa de Santiago
Reseña de Valores 2012 - Bolsa de Santiago
- No tags were found...

Create successful ePaper yourself
Turn your PDF publications into a flip-book with our unique Google optimized e-Paper software.
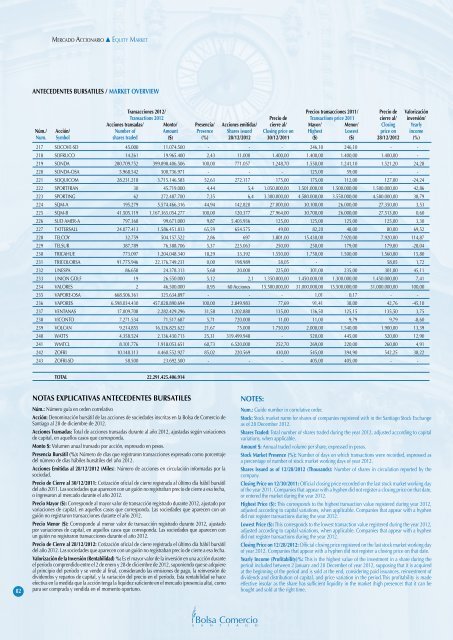
Mercado Accionario s Equity MarketANTECEDENTES BURSATILES / MARKET OVERVIEWTransacciones <strong>2012</strong>/ Precios transacciones 2011/ Precio <strong>de</strong> ValorizaciónTransactions <strong>2012</strong> Precio <strong>de</strong> Transactions price 2011 cierre al/ inversión/Acciones transadas/ Monto/ Presencia/ Acciones emitidas/ cierre al/ Mayor/ Menor/ Closing YearlyNúm./ Acción/ Number of Amount Presence Shares issued Closing price on Highest Lowest price on incomeNum. Symbol shares tra<strong>de</strong>d ($) (%) 28/12/<strong>2012</strong> 30/12/2011 ($) ($) 28/12/<strong>2012</strong> (%)217 SOCOVE-SD 45.000 11.074.500 - - - 246,10 246,10 - -218 SOFRUCO 14.261 19.965.400 2,43 11.000 1.400,00 1.400,00 1.400,00 1.400,00 -219 SONDA 280.709.752 399.898.406.506 100,00 771.057 1.248,70 1.550,00 1.241,10 1.521,20 24,28220 SONDA-OSA 5.968.542 500.736.971 - - - 125,00 59,00 - -221 SOQUICOM 28.231.218 3.715.146.583 52,63 272.117 175,00 175,00 112,00 127,00 -24,24222 SPORTFRAN 30 45.719.000 4,44 5,4 1.050.000,00 1.501.000,00 1.500.000,00 1.500.000,00 42,86223 SPORTING 62 272.487.700 7,35 6,4 3.300.000,00 4.580.000,00 3.550.000,00 4.580.000,00 38,79224 SQM-A 195.279 5.574.466.316 44,94 142.820 27.000,00 30.100,00 26.000,00 27.350,00 3,53225 SQM-B 41.505.119 1.167.365.054.277 100,00 120.377 27.964,00 30.700,00 26.000,00 27.513,00 0,60226 SUD AMER-A 797.368 99.671.000 9,87 5.403.936 125,00 125,00 125,00 125,00 3,30227 TATTERSALL 24.077.413 1.586.451.833 65,59 654.575 49,00 82,20 48,00 80,00 69,52228 TELCOY 32.759 504.157.522 2,86 697 3.801,00 15.430,00 7.920,00 7.920,00 114,87229 TELSUR 387.789 76.388.706 5,37 225.063 250,00 250,00 179,00 179,00 -28,04230 TRICAHUE 773.097 1.204.048.340 18,29 33.392 1.550,00 1.750,00 1.500,00 1.560,00 15,80231 TRICOLORSA 91.775.946 22.176.749.231 0,00 198.989 58,05 - - 58,05 1,72232 UNESPA 86.658 24.378.313 5,68 20.000 225,00 301,00 235,00 301,00 45,11233 UNION GOLF 19 26.550.000 5,12 2,1 1.350.000,00 1.450.000,00 1.300.000,00 1.450.000,00 7,41234 VALORES 2 46.500.000 0,95 60 Acciones 15.500.000,00 31.000.000,00 15.500.000,00 31.000.000,00 100,00235 VAPORE-OSA 668.506.361 325.634.897 - - - 1,01 0,17 - -236 VAPORES 6.598.034.430 457.828.890.694 100,00 2.849.983 77,69 91,41 38,00 42,76 -45,10237 VENTANAS 17.009.708 2.282.429.296 31,58 1.202.880 135,00 136,50 125,15 135,50 3,75238 VICONTO 7.271.534 71.517.687 5,71 720.000 11,00 11,00 9,79 9,79 -8,60239 VOLCAN 9.214.855 16.326.825.622 21,67 75.000 1.750,00 2.000,00 1.540,00 1.900,00 13,39240 WATTS 4.358.524 2.136.430.713 25,31 319.499.948 - 520,00 445,00 520,00 12,90241 WMTCL 8.101.776 1.918.053.651 60,73 6.520.000 252,70 269,00 220,00 260,00 4,91242 ZOFRI 10.148.313 4.460.552.927 85,02 220.569 430,00 545,00 394,90 542,25 38,22243 ZOFRI-SD 58.500 23.692.500 - - - 405,00 405,00 - -TOTAL 22.291.425.406.9148282Notas Explicativas Antece<strong>de</strong>ntes BursAtilesNúm.: Número guía en or<strong>de</strong>n correlativoAcción: Denominación bursátil <strong>de</strong> las acciones <strong>de</strong> socieda<strong>de</strong>s inscritas en la <strong>Bolsa</strong> <strong>de</strong> Comercio <strong>de</strong><strong>Santiago</strong> al 28 <strong>de</strong> diciembre <strong>de</strong> <strong>2012</strong>.Acciones Transadas: Total <strong>de</strong> acciones transadas durante al año <strong>2012</strong>, ajustadas según variaciones<strong>de</strong> capital, en aquellos casos que corresponda.Monto $: Volumen anual transado por acción, expresado en pesos.Presencia Bursátil (%): Número <strong>de</strong> días que registraron transacciones expresado como porcentaje<strong>de</strong>l número <strong>de</strong> días hábiles bursátiles <strong>de</strong>l año <strong>2012</strong>.Acciones Emitidas al 28/12/<strong>2012</strong> (Miles): Número <strong>de</strong> acciones en circulación informadas por lasociedad.Precio <strong>de</strong> Cierre al 30/12/2011: Cotización oficial <strong>de</strong> cierre registrada al último día hábil bursátil<strong>de</strong>l año 2011. Las socieda<strong>de</strong>s que aparecen con un guión no registraban precio <strong>de</strong> cierre a esa fecha,o ingresaron al mercado durante el año <strong>2012</strong>.Precio Mayor ($): Correspon<strong>de</strong> al mayor valor <strong>de</strong> transacción registrado durante <strong>2012</strong>, ajustado porvariaciones <strong>de</strong> capital, en aquellos casos que corresponda. Las socieda<strong>de</strong>s que aparecen con unguión no registraron transacciones durante el año <strong>2012</strong>.Precio Menor ($): Correspon<strong>de</strong> al menor valor <strong>de</strong> transacción registrado durante <strong>2012</strong>, ajustadopor variaciones <strong>de</strong> capital, en aquellos casos que corresponda. Las socieda<strong>de</strong>s que aparecen conun guión no registraron transacciones durante el año <strong>2012</strong>.Precio <strong>de</strong> Cierre al 28/12/<strong>2012</strong>: Cotización oficial <strong>de</strong> cierre registrada el último día hábil bursátil<strong>de</strong>l año <strong>2012</strong>. Las socieda<strong>de</strong>s que aparecen con un guión no registraban precio <strong>de</strong> cierre a esa fecha.Valorización <strong>de</strong> la Inversión (Rentabilidad) %: Es el mayor valor <strong>de</strong> la inversión en una acción duranteel período comprendido entre el 2 <strong>de</strong> enero y 28 <strong>de</strong> diciembre <strong>de</strong> <strong>2012</strong>, suponiendo que se adquiereal principio <strong>de</strong>l período y se ven<strong>de</strong> al final, consi<strong>de</strong>rando las emisiones <strong>de</strong> pago, la reinversión <strong>de</strong>divi<strong>de</strong>ndos y repartos <strong>de</strong> capital, y la variación <strong>de</strong>l precio en el período. Esta rentabilidad se haceefectiva en la medida que la acción tenga la liqui<strong>de</strong>z suficiente en el mercado (presencia alta), comopara ser comprada y vendida en el momento oportuno.NOTES:Num.: Gui<strong>de</strong> number in correlative or<strong>de</strong>r.Stock: Stock market name for shares of companies registered with in the <strong>Santiago</strong> Stock Exchangeas of 28 December <strong>2012</strong>.Shares Tra<strong>de</strong>d: Total number of shares tra<strong>de</strong>d during the year <strong>2012</strong>, adjusted according to capitalvariations, when applicable.Amount $: Annual tra<strong>de</strong>d volume per share, expressed in pesos.Stock Market Presence (%): Number of days on which transactions were recor<strong>de</strong>d, expressed asa percentage of number of stock market working days of year <strong>2012</strong>.Shares Issued as of 12/28/<strong>2012</strong> (Thousands): Number of shares in circulation reported by thecompany.Closing Price on 12/30/2011: Official closing price recor<strong>de</strong>d on the last stock market working dayof the year 2011. Companies that appear with a hyphen did not register a closing price on that date,or entered the market during the year <strong>2012</strong>.Highest Price ($): This corresponds to the highest transaction value registered during year <strong>2012</strong>,adjusted according to capital variations, when applicable. Companies that appear with a hyphendid not register transactions during the year <strong>2012</strong>.Lowest Price ($): This corresponds to the lowest transaction value registered during the year <strong>2012</strong>,adjusted according to capital variations, when applicable. Companies that appear with a hyphendid not register transactions during the year <strong>2012</strong>.Closing Price on 12/28/<strong>2012</strong>: Official closing price registered on the last stock market working dayof year <strong>2012</strong>. Companies that appear with a hyphen did not register a closing price on that date.Yearly Income (Profitability)%: This is the highest value of the investment in a share during theperiod inclu<strong>de</strong>d between 2 January and 28 December of year <strong>2012</strong>, supposing that it is acquiredat the beginning of the period and is sold at the end, consi<strong>de</strong>ring paid issuances, reinvestment ofdivi<strong>de</strong>nds and distribution of capital, and price variation in the period.This profitability is ma<strong>de</strong>effective insofar as the share has sufficient liquidity in the market (high presence) that it can bebought and sold at the right time.