Estimaciones y proyeccion - Ministerio de EconomÃa
Estimaciones y proyeccion - Ministerio de EconomÃa
Estimaciones y proyeccion - Ministerio de EconomÃa

You also want an ePaper? Increase the reach of your titles
YUMPU automatically turns print PDFs into web optimized ePapers that Google loves.
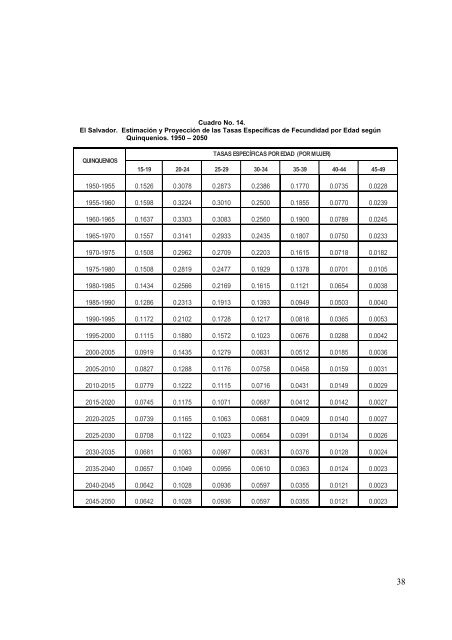
Cuadro No. 14.El Salvador. Estimación y Proyección <strong>de</strong> las Tasas Específicas <strong>de</strong> Fecundidad por Edad segúnQuinquenios. 1950 – 2050QUINQUENIOSTASAS ESPECÍFICAS POR EDAD (POR MUJER)15-19 20-24 25-29 30-34 35-39 40-44 45-491950-1955 0.1526 0.3078 0.2873 0.2386 0.1770 0.0735 0.02281955-1960 0.1598 0.3224 0.3010 0.2500 0.1855 0.0770 0.02391960-1965 0.1637 0.3303 0.3083 0.2560 0.1900 0.0789 0.02451965-1970 0.1557 0.3141 0.2933 0.2435 0.1807 0.0750 0.02331970-1975 0.1508 0.2962 0.2709 0.2203 0.1615 0.0718 0.01821975-1980 0.1508 0.2819 0.2477 0.1929 0.1378 0.0701 0.01051980-1985 0.1434 0.2566 0.2169 0.1615 0.1121 0.0654 0.00381985-1990 0.1286 0.2313 0.1913 0.1393 0.0949 0.0503 0.00401990-1995 0.1172 0.2102 0.1728 0.1217 0.0818 0.0365 0.00531995-2000 0.1115 0.1880 0.1572 0.1023 0.0676 0.0288 0.00422000-2005 0.0919 0.1435 0.1279 0.0831 0.0512 0.0185 0.00362005-2010 0.0827 0.1288 0.1176 0.0758 0.0458 0.0159 0.00312010-2015 0.0779 0.1222 0.1115 0.0716 0.0431 0.0149 0.00292015-2020 0.0745 0.1175 0.1071 0.0687 0.0412 0.0142 0.00272020-2025 0.0739 0.1165 0.1063 0.0681 0.0409 0.0140 0.00272025-2030 0.0708 0.1122 0.1023 0.0654 0.0391 0.0134 0.00262030-2035 0.0681 0.1083 0.0987 0.0631 0.0376 0.0128 0.00242035-2040 0.0657 0.1049 0.0956 0.0610 0.0363 0.0124 0.00232040-2045 0.0642 0.1028 0.0936 0.0597 0.0355 0.0121 0.00232045-2050 0.0642 0.1028 0.0936 0.0597 0.0355 0.0121 0.002338