Estimaciones y proyeccion - Ministerio de EconomÃa
Estimaciones y proyeccion - Ministerio de EconomÃa
Estimaciones y proyeccion - Ministerio de EconomÃa

You also want an ePaper? Increase the reach of your titles
YUMPU automatically turns print PDFs into web optimized ePapers that Google loves.
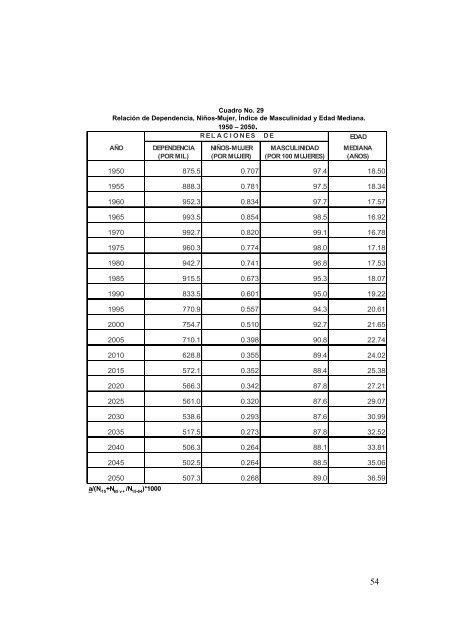
Cuadro No. 29Relación <strong>de</strong> Depen<strong>de</strong>ncia, Niños-Mujer, Índice <strong>de</strong> Masculinidad y Edad Mediana.1950 – 2050.R E L A C I O N E S D EEDADAÑO DEPENDENCIA NIÑOS-MUJER MASCULINIDAD MEDIANA(POR MIL) (POR MUJER) (POR 100 MUJERES) (AÑOS)1950 875.5 0.707 97.4 18.501955 888.3 0.781 97.5 18.341960 952.3 0.834 97.7 17.571965 993.5 0.854 98.5 16.921970 992.7 0.820 99.1 16.781975 960.3 0.774 98.0 17.181980 942.7 0.741 96.8 17.531985 915.5 0.673 95.3 18.071990 833.5 0.601 95.0 19.221995 770.9 0.557 94.3 20.612000 754.7 0.510 92.7 21.652005 710.1 0.398 90.8 22.742010 628.8 0.355 89.4 24.022015 572.1 0.352 88.4 25.382020 566.3 0.342 87.8 27.212025 561.0 0.320 87.6 29.072030 538.6 0.293 87.6 30.992035 517.5 0.273 87.8 32.522040 506.3 0.264 88.1 33.812045 502.5 0.264 88.5 35.062050 507.3 0.268 89.0 36.59a/(N -15+N 65 y +/N 15-64)*100054