


Create successful ePaper yourself
Turn your PDF publications into a flip-book with our unique Google optimized e-Paper software.
Servicio Público <strong>de</strong> Empleo <strong>Estatal</strong><br />
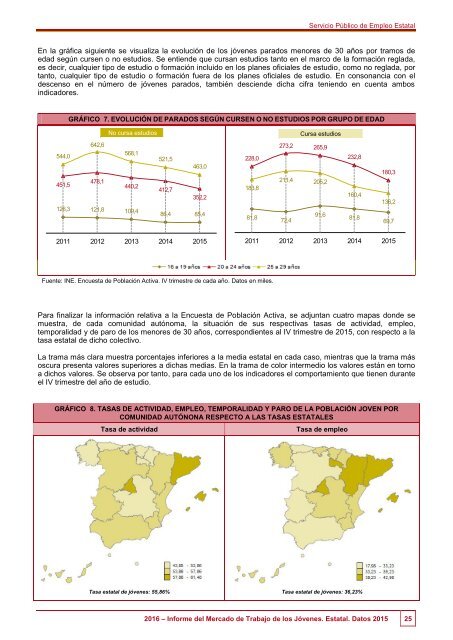
En la gráfica siguiente se visualiza la evolución <strong>de</strong> <strong>los</strong> jóvenes parados menores <strong>de</strong> 30 años por tramos <strong>de</strong><br />
edad según cursen o no estudios. Se entien<strong>de</strong> que cursan estudios tanto en el marco <strong>de</strong> la formación reglada,<br />
es <strong>de</strong>cir, cualquier tipo <strong>de</strong> estudio o formación incluido en <strong>los</strong> planes oficiales <strong>de</strong> estudio, como no reglada, por<br />
tanto, cualquier tipo <strong>de</strong> estudio o formación fuera <strong>de</strong> <strong>los</strong> planes oficiales <strong>de</strong> estudio. En consonancia con el<br />
<strong>de</strong>scenso en el número <strong>de</strong> jóvenes parados, también <strong>de</strong>scien<strong>de</strong> dicha cifra teniendo en cuenta ambos<br />
indicadores.<br />
GRÁFICO 7. EVOLUCIÓN DE PARADOS SEGÚN CURSEN O NO ESTUDIOS POR GRUPO DE EDAD<br />
....No cursa estudios...<br />
.……....Cursa estudios.……....<br />
642,6<br />
544,0<br />
568,1<br />
451,5<br />
478,1<br />
440,2<br />
126,3 121,8 109,4<br />
521,5<br />
463,0<br />
412,7<br />
352,2<br />
86,4 85,4<br />
228,0<br />
183,8<br />
81,8<br />
273,2 265,9<br />
211,4 205,2<br />
91,6<br />
72,4<br />
232,8<br />
160,4<br />
81,8<br />
180,3<br />
136,2<br />
69,7<br />
2011 2012 2013 2014 2015<br />
2011 2012 2013 2014 2015<br />
Fuente: INE. Encuesta <strong>de</strong> Población Activa. IV trimestre <strong>de</strong> cada año. Datos en miles.<br />
Para finalizar la información relativa a la Encuesta <strong>de</strong> Población Activa, se adjuntan cuatro mapas don<strong>de</strong> se<br />
muestra, <strong>de</strong> cada comunidad autónoma, la situación <strong>de</strong> sus respectivas tasas <strong>de</strong> actividad, empleo,<br />
temporalidad y <strong>de</strong> paro <strong>de</strong> <strong>los</strong> menores <strong>de</strong> 30 años, correspondientes al IV trimestre <strong>de</strong> 2015, con respecto a la<br />
tasa estatal <strong>de</strong> dicho colectivo.<br />
La trama más clara muestra porcentajes inferiores a la media estatal en cada caso, mientras que la trama más<br />
oscura presenta valores superiores a dichas medias. En la trama <strong>de</strong> color intermedio <strong>los</strong> valores están en torno<br />
a dichos valores. Se observa por tanto, para cada uno <strong>de</strong> <strong>los</strong> indicadores el comportamiento que tienen durante<br />
el IV trimestre <strong><strong>de</strong>l</strong> año <strong>de</strong> estudio.<br />
GRÁFICO 8. TASAS DE ACTIVIDAD, EMPLEO, TEMPORALIDAD Y PARO DE LA POBLACIÓN JOVEN POR<br />
COMUNIDAD AUTÓNONA RESPECTO A LAS TASAS ESTATALES<br />
Tasa <strong>de</strong> actividad<br />
Tasa <strong>de</strong> empleo<br />
Tasa estatal <strong>de</strong> jóvenes: 55,86% Tasa estatal <strong>de</strong> jóvenes: 36,23%<br />
<strong>2016</strong> – <strong>Informe</strong> <strong><strong>de</strong>l</strong> <strong>Mercado</strong> <strong>de</strong> <strong>Trabajo</strong> <strong>de</strong> <strong>los</strong> <strong>Jóvenes</strong>. <strong>Estatal</strong>. Datos 2015 25