


You also want an ePaper? Increase the reach of your titles
YUMPU automatically turns print PDFs into web optimized ePapers that Google loves.
Servicio Público <strong>de</strong> Empleo <strong>Estatal</strong><br />
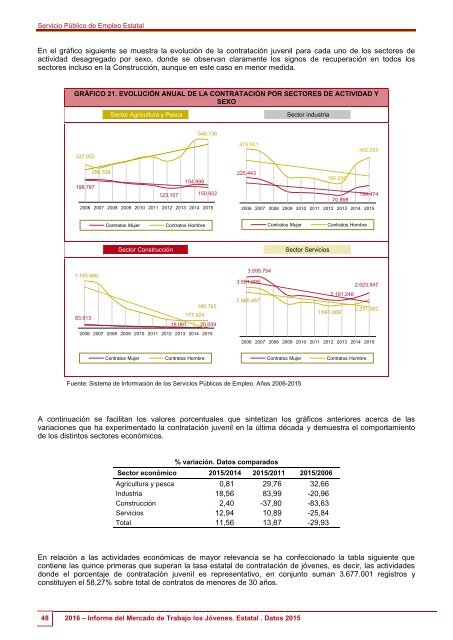
En el gráfico siguiente se muestra la evolución <strong>de</strong> la contratación juvenil para cada uno <strong>de</strong> <strong>los</strong> sectores <strong>de</strong><br />
actividad <strong>de</strong>sagregado por sexo, don<strong>de</strong> se observan claramente <strong>los</strong> signos <strong>de</strong> recuperación en todos <strong>los</strong><br />
sectores incluso en la Construcción, aunque en este caso en menor medida.<br />
GRÁFICO 21. EVOLUCIÓN ANUAL DE LA CONTRATACIÓN POR SECTORES DE ACTIVIDAD Y<br />
SEXO<br />
....Sector Agricultura y Pesca...<br />
………..Sector industria............<br />
546.736<br />
327.052<br />
478.951<br />
402.265<br />
296.534<br />
154.999<br />
198.787<br />
123.107 150.822<br />
2006 2007 2008 2009 2010 2011 2012 2013 2014 2015<br />
225.443<br />
180.500<br />
154.474<br />
70.898<br />
2006 2007 2008 2009 2010 2011 2012 2013 2014 2015<br />
Contratos Mujer<br />
Contratos Hombre<br />
Contratos Mujer<br />
Contratos Hombre<br />
….…Sector Construcción…….<br />
.……....Sector Servicios.……....<br />
1.145.466<br />
180.765<br />
177.924<br />
83.513<br />
18.091 20.359<br />
2006 2007 2008 2009 2010 2011 2012 2013 2014 2015<br />
3.595.754<br />
3.581.009<br />
2.623.947<br />
2.191.248<br />
2.965.467<br />
2.231.082<br />
1.841.889<br />
2006 2007 2008 2009 2010 2011 2012 2013 2014 2015<br />
Contratos Mujer<br />
Contratos Hombre<br />
Contratos Mujer<br />
Contratos Hombre<br />
Fuente: Sistema <strong>de</strong> Información <strong>de</strong> <strong>los</strong> Servicios Públicos <strong>de</strong> Empleo. Años 2006-2015<br />
A continuación se facilitan <strong>los</strong> valores porcentuales que sintetizan <strong>los</strong> gráficos anteriores acerca <strong>de</strong> las<br />
variaciones que ha experimentado la contratación juvenil en la última década y <strong>de</strong>muestra el comportamiento<br />
<strong>de</strong> <strong>los</strong> distintos sectores económicos.<br />
% variación. Datos comparados<br />
Sector económico 2015/2014 2015/2011 2015/2006<br />
Agricultura y pesca 0,81 29,76 32,66<br />
Industria 18,56 83,99 -20,96<br />
Construcción 2,40 -37,80 -83,63<br />
Servicios 12,94 10,89 -25,84<br />
Total 11,56 13,87 -29,93<br />
En relación a las activida<strong>de</strong>s económicas <strong>de</strong> mayor relevancia se ha confeccionado la tabla siguiente que<br />
contiene las quince primeras que superan la tasa estatal <strong>de</strong> contratación <strong>de</strong> jóvenes, es <strong>de</strong>cir, las activida<strong>de</strong>s<br />
don<strong>de</strong> el porcentaje <strong>de</strong> contratación juvenil es representativo, en conjunto suman 3.677.001 registros y<br />
constituyen el 58,27% sobre total <strong>de</strong> contratos <strong>de</strong> menores <strong>de</strong> 30 años.<br />
48 <strong>2016</strong> – <strong>Informe</strong> <strong><strong>de</strong>l</strong> <strong>Mercado</strong> <strong>de</strong> <strong>Trabajo</strong> <strong>los</strong> <strong>Jóvenes</strong>. <strong>Estatal</strong> . Datos 2015