

Dialogue essais-simulation et identification de lois de comportement ...
Dialogue essais-simulation et identification de lois de comportement ...
Dialogue essais-simulation et identification de lois de comportement ...

You also want an ePaper? Increase the reach of your titles
YUMPU automatically turns print PDFs into web optimized ePapers that Google loves.
Partie B – Chapitre 8 : I<strong>de</strong>ntification sur <strong>de</strong>s <strong>essais</strong> complexes - comparaison <strong>et</strong> discussion<br />
0<br />
0 0,5 1 1,5 2 2,5<br />
0<br />
0 0,5 1 1,5 2 2,5<br />
Déformation Ɛ xx<br />
-0,005<br />
-0,01<br />
-0,015<br />
-0,02<br />
Temps<br />
num<br />
exp<br />
Déformation Ɛ xx<br />
-0,005<br />
-0,01<br />
-0,015<br />
-0,02<br />
-0,025<br />
Temps<br />
num<br />
exp<br />
a) en fonction du temps au point E b) en fonction du temps au point C<br />
pastel-00910076, version 1 - 27 Nov 2013<br />
Déformation Ɛ yy<br />
Déformation Ɛ xy<br />
0,05<br />
0,04<br />
0,03<br />
0,02<br />
0,01<br />
0<br />
c) en fonction du temps au point E d) en fonction du temps au point C<br />
0,018<br />
0,015<br />
0,012<br />
0,009<br />
0,006<br />
0,003<br />
0<br />
0 0,5 1 1,5 2 2,5<br />
Temps<br />
num<br />
exp<br />
0 0,5 1 1,5 2 2,5<br />
Temps<br />
num<br />
exp<br />
Déformation Ɛ yy<br />
Déformation Ɛ xy<br />
0,06<br />
0,05<br />
0,04<br />
0,03<br />
0,02<br />
0,01<br />
0<br />
0<br />
-0,002<br />
-0,004<br />
-0,006<br />
-0,008<br />
-0,01<br />
-0,012<br />
-0,014<br />
0 0,5 1 1,5 2 2,5<br />
Temps<br />
num<br />
exp<br />
0 0,5 1 1,5 2 2,5<br />
Temps<br />
num<br />
exp<br />
e) en fonction du temps au point E f) en fonction du temps au point C<br />
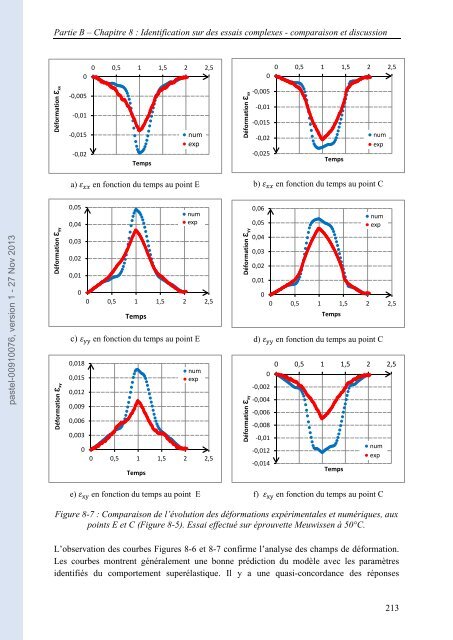
Figure 8-7 : Comparaison <strong>de</strong> l’évolution <strong>de</strong>s déformations expérimentales <strong>et</strong> numériques, aux<br />
points E <strong>et</strong> C (Figure 8-5). Essai effectué sur éprouv<strong>et</strong>te Meuwissen à 50°C.<br />
L’observation <strong>de</strong>s courbes Figures 8-6 <strong>et</strong> 8-7 confirme l’analyse <strong>de</strong>s champs <strong>de</strong> déformation.<br />
Les courbes montrent généralement une bonne prédiction du modèle avec les paramètres<br />
i<strong>de</strong>ntifiés du <strong>comportement</strong> superélastique. Il y a une quasi-concordance <strong>de</strong>s réponses<br />
213


