Baromètre IRSN 2013 - La perception des risques et de la sécurité ...
Baromètre IRSN 2013 - La perception des risques et de la sécurité ...
Baromètre IRSN 2013 - La perception des risques et de la sécurité ...
- No tags were found...

Create successful ePaper yourself
Turn your PDF publications into a flip-book with our unique Google optimized e-Paper software.
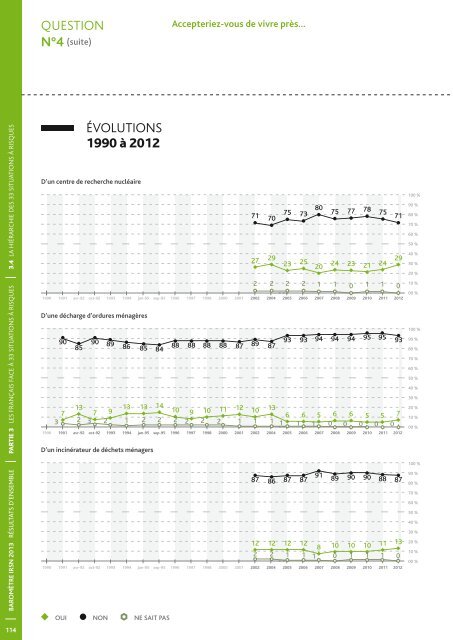
QUESTIONN°4 (suite)Accepteriez-vous <strong>de</strong> vivre près…BAROMÈTRE <strong>IRSN</strong> <strong>2013</strong> RÉSULTATS D’ENSEMBLE PARTIE 3 LES FRANÇAIS FACE À 33 SITUATIONS À RISQUES 3.4 LA HIÉRARCHIE DES 33 SITUATIONS À RISQUESÉVOLUTIONS1990 à 2012D’un centre <strong>de</strong> recherche nucléaire1990 1991 avr-92 oct-92 1993 1994 jan-95 sep-95 1996 1997 1998 2000 2001 2002 2004 2005 2006 2007 2008 2009 2010 2011 2012D’une décharge d’ordures ménagères1990 1991 avr-92 oct-92 1993 1994 jan-95 sep-95 1996 1997 1998 2000 2001 2002 2004 2005 2006 2007 2008 2009 2010 2011 2012D’un incinérateur <strong>de</strong> déch<strong>et</strong>s ménagers1990 1991 avr-92 oct-92 1993 1994 jan-95 sep-95 1996 1997 1998 2000 2001 2002 2004 2005 2006 2007 2008 2009 2010 2011 2012100 %90 %80 %70 %60 %50 %40 %30 %20 %10 %00 %100 %90 %80 %70 %60 %50 %40 %30 %20 %10 %00 %100 %90 %80 %70 %60 %50 %40 %30 %20 %10 %00 %D’une instal<strong>la</strong>tion chimique importante1990 1991 avr-92 oct-92 1993 1994 jan-95 sep-95 1996 1997 1998 2000 2001 2002 2004 2005 2006 2007 2008 2009 2010 2011 2012De lignes à haute tension1990 1991 avr-92 oct-92 1993 1994 jan-95 sep-95 1996 1997 1998 2000 2001 2002 2004 2005 2006 2007 2008 2009 2010 2011 2012D’un parc éolien1990 1991 avr-92 oct-92 1993 1994 jan-95 sep-95 1996 1997 1998 2000 2001 2002 2004 2005 2006 2007 2008 2009 2010 2011 2012100 %90 %80 %70 %60 %50 %40 %30 %20 %10 %00 %100 %90 %80 %70 %60 %50 %40 %30 %20 %10 %00 %100 %90 %80 %70 %60 %50 %40 %30 %20 %10 %00 %BAROMÈTRE <strong>IRSN</strong> <strong>2013</strong>OUI NON NE SAIT PASOUI NON NE SAIT PAS114115