Baromètre IRSN 2013 - La perception des risques et de la sécurité ...
Baromètre IRSN 2013 - La perception des risques et de la sécurité ...
Baromètre IRSN 2013 - La perception des risques et de la sécurité ...
- No tags were found...

You also want an ePaper? Increase the reach of your titles
YUMPU automatically turns print PDFs into web optimized ePapers that Google loves.
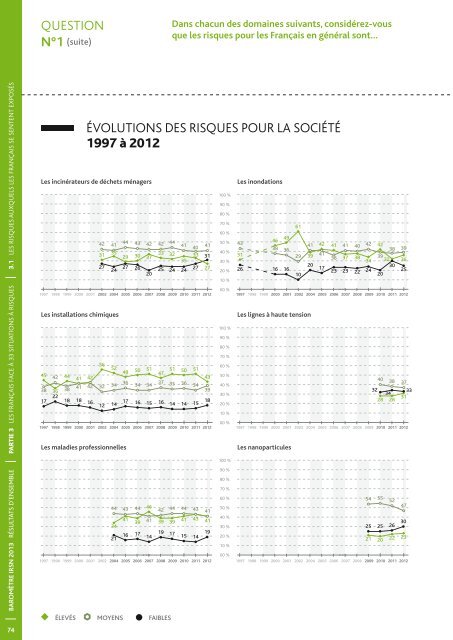
QUESTIONN°1 (suite)Dans chacun <strong><strong>de</strong>s</strong> domaines suivants, considérez-vousque les <strong>risques</strong> pour les Français en général sont…BAROMÈTRE <strong>IRSN</strong> <strong>2013</strong> RÉSULTATS D’ENSEMBLE PARTIE 3 LES FRANÇAIS FACE À 33 SITUATIONS À RISQUES 3.1 LES RISQUES AUXQUELS LES FRANÇAIS SE SENTENT EXPOSÉS74ÉVOLUTIONS DES RISQUES POUR LA SOCIÉTÉ1997 à 2012Les incinérateurs <strong>de</strong> déch<strong>et</strong>s ménagersLes instal<strong>la</strong>tions chimiquesLes ma<strong>la</strong>dies professionnelles100 %90 %80 %70 %60 %50 %40 %30 %20 %10 %Les inondationsLes lignes à haute tensionLes nanoparticulesL’obésité <strong><strong>de</strong>s</strong> jeunes00 %1997 1998 1999 2000 2001 2002 2004 2005 2006 2007 2008 2009 2010 2011 20121997 1998 1999 2000 2001 2002 2004 2005 2006 2007 2008 2009 2010 2011 20121997 1998 1999 2000 2001 2002 2004 2005 2006 2007 2008 2009 2010 2011 2012100 %90 %80 %70 %60 %50 %40 %30 %20 %10 %Les pestici<strong><strong>de</strong>s</strong> <strong>de</strong>puis 2004(les nitrates <strong>et</strong> pestici<strong><strong>de</strong>s</strong> jusqu’en 2001)00 %1997 1998 1999 2000 2001 2002 2004 2005 2006 2007 2008 2009 2010 2011 20121997 1998 1999 2000 2001 2002 2004 2005 2006 2007 2008 2009 2010 2011 20121997 1998 1999 2000 2001 2002 2004 2005 2006 2007 2008 2009 2010 2011 2012100 %90 %80 %70 %60 %50 %40 %30 %20 %10 %<strong>La</strong> pollution <strong><strong>de</strong>s</strong> <strong>la</strong>cs, <strong><strong>de</strong>s</strong> rivières <strong>et</strong> <strong><strong>de</strong>s</strong> mersLes OGM <strong>de</strong>puis 2004(manipu<strong>la</strong>tions génétiques jusqu’en 2002)1997 1998 1999 2000 2001 2002 2004 2005 2006 2007 2008 2009 2010 2011 2012<strong>La</strong> pollution atmosphérique1997 1998 1999 2000 2001 2002 2004 2005 2006 2007 2008 2009 2010 2011 2012<strong>La</strong> pollution <strong><strong>de</strong>s</strong> sols00 %00 %1997 1998 1999 2000 2001 2002 2004 2005 2006 2007 2008 2009 2010 2011 20121997 1998 1999 2000 2001 2002 2004 2005 2006 2007 2008 2009 2010 2011 20121997 1998 1999 2000 2001 2002 2004 2005 2006 2007 2008 2009 2010 2011 20121997 1998 1999 2000 2001 2002 2004 2005 2006 2007 2008 2009 2010 2011 2012ÉLEVÉS MOYENS FAIBLES ÉLEVÉS MOYENS FAIBLES100 %90 %80 %70 %60 %50 %40 %30 %20 %10 %00 %100 %90 %80 %70 %60 %50 %40 %30 %20 %10 %00 %100 %90 %80 %70 %60 %50 %40 %30 %20 %10 %BAROMÈTRE <strong>IRSN</strong> <strong>2013</strong>75