Baromètre IRSN 2013 - La perception des risques et de la sécurité ...
Baromètre IRSN 2013 - La perception des risques et de la sécurité ...
Baromètre IRSN 2013 - La perception des risques et de la sécurité ...
- No tags were found...

Create successful ePaper yourself
Turn your PDF publications into a flip-book with our unique Google optimized e-Paper software.
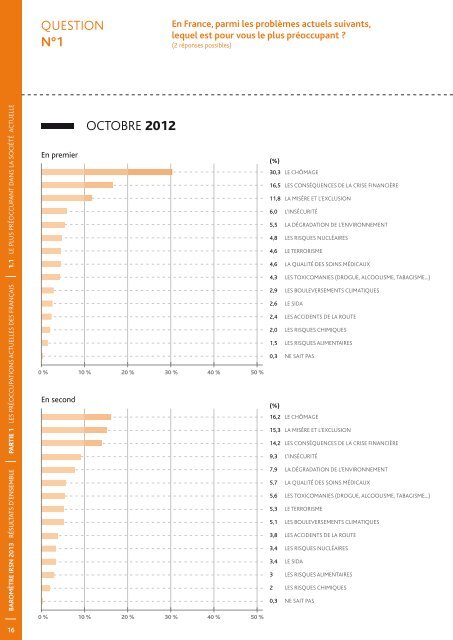
QUESTIONN°1En France, parmi les problèmes actuels suivants,lequel est pour vous le plus préoccupant ?(2 réponses possibles)RÉSULTATS CUMULÉSOCTOBRE 2012Les résultats cumulés correspon<strong>de</strong>nt à <strong>la</strong> somme<strong><strong>de</strong>s</strong> premier <strong>et</strong> second choix. C’est pourquoi le total<strong><strong>de</strong>s</strong> pourcentages <strong>de</strong> réponse peut être supérieur à 100.(%)46,5 LE CHÔMAGE30,6 LES CONSÉQUENCES DE LA CRISE FINANCIÈRE27,1 LA MISÈRE ET L’EXCLUSIONBAROMÈTRE <strong>IRSN</strong> <strong>2013</strong> RÉSULTATS D’ENSEMBLE PARTIE 1 LES PRÉOCCUPATIONS ACTUELLES DES FRANÇAIS 1.1 LE PLUS PRÉOCCUPANT DANS LA SOCIÉTÉ ACTUELLEEn premierOCTOBRE 20120 % 10 % 20 % 30 % 40 % 50 %En second0 % 10 % 20 % 30 % 40 % 50 %(%)30,3 LE CHÔMAGE16,5 LES CONSÉQUENCES DE LA CRISE FINANCIÈRE11,8 LA MISÈRE ET L’EXCLUSION6,0 L’INSÉCURITÉ5,5 LA DÉGRADATION DE L’ENVIRONNEMENT4,8 LES RISQUES NUCLÉAIRES4,6 LE TERRORISME4,6 LA QUALITÉ DES SOINS MÉDICAUX4,3 LES TOXICOMANIES (DROGUE, ALCOOLISME, TABAGISME...)2,9 LES BOULEVERSEMENTS CLIMATIQUES2,6 lE SIDA2,4 LES ACCIDENTS DE LA ROUTE2,0 lES RISQUES CHIMIQUES1,5 lES RISQUES ALIMENTAIRES0,3 NE SAIT PAS(%)16,2 LE CHÔMAGE15,3 LA MISÈRE ET L’EXCLUSION14,2 LES CONSÉQUENCES DE LA CRISE FINANCIÈRE9,3 L’INSÉCURITÉ7,9 LA DÉGRADATION DE L’ENVIRONNEMENT5,7 LA QUALITÉ DES SOINS MÉDICAUX5,6 LES TOXICOMANIES (DROGUE, ALCOOLISME, TABAGISME...)5,3 LE TERRORISME5,1 LES BOULEVERSEMENTS CLIMATIQUES3,8 LES ACCIDENTS DE LA ROUTE3,4 LES RISQUES NUCLÉAIRES3,4 lE SIDA3 lES RISQUES ALIMENTAIRES2 lES RISQUES CHIMIQUES0,3 NE SAIT PAS0 % 10 % 20 % 30 % 40 % 50 %ÉVOLUTIONS SURLES RÉSULTATS CUMULÉS1998 À 201215,2 L’INSÉCURITÉ13,3 LA DÉGRADATION DE L ENVIRONNEMENT10,2 LA QUALITÉ DES SOINS MÉDICAUX9,9 LE TERRORISME9,9 LES TOXICOMANIES (DROGUE, ALCOOLISME, TABAGISME...)8,2 LES RISQUES NUCLÉAIRES8,0 LES BOULEVERSEMENTS CLIMATIQUES6,2 LES ACCIDENTS DE LA ROUTE6,0 lE SIDA4,5 lES RISQUES ALIMENTAIRES4,0 lES RISQUES CHIMIQUES0,3 NE SAIT PASÉvolution <strong><strong>de</strong>s</strong> préoccupations ayant enregistré les taux <strong>de</strong> réponseles plus importants <strong>de</strong>puis 1998. Ne figurent pas sur ce graphique« les <strong>risques</strong> alimentaires », « les <strong>risques</strong> chimiques », « les toxicomanies» (drogue, alcoolisme, tabagisme), qui récoltent <strong>de</strong> manièreconstante environ 5 % <strong>de</strong> réponses cumulées pour les <strong>de</strong>ux premiers<strong>et</strong> autour <strong>de</strong> 10 % pour le <strong>de</strong>rnier.1998 1999 2000 2001 2002 2004 2005 2006 2007 2008 2009 2010 2011 2012Le chômageLES CONSÉQUENCESDE LA CRISE FINANCIÈREL’INSÉCURITÉ<strong>La</strong> misère <strong>et</strong> l’exclusionLes <strong>risques</strong> nucléaires<strong>La</strong> dégradation<strong>de</strong> l’environnementLES BOULEVERSEMENTSCLIMATIQUES70 %60 %50 %40 %30 %20 %10 %00 %BAROMÈTRE <strong>IRSN</strong> <strong>2013</strong>1617