Rapporto ambientale 2012 - Enel.com
Rapporto ambientale 2012 - Enel.com
Rapporto ambientale 2012 - Enel.com

Create successful ePaper yourself
Turn your PDF publications into a flip-book with our unique Google optimized e-Paper software.
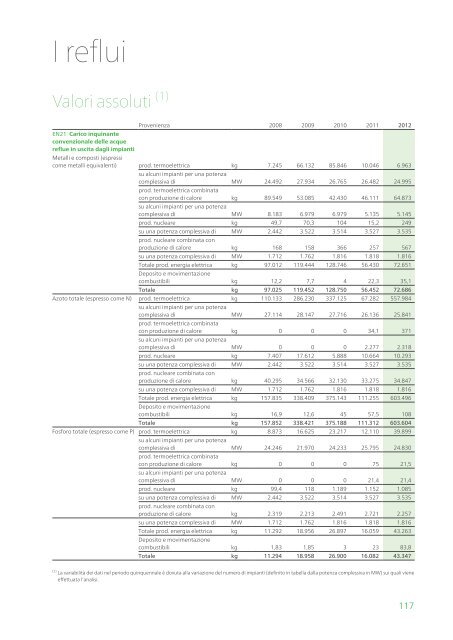
I reflui<br />
Valori assoluti (1)<br />
Provenienza 2008 2009 2010 2011 <strong>2012</strong><br />
EN21 Carico inquinante<br />
convenzionale delle acque<br />
reflue in uscita dagli impianti<br />
Metalli e <strong>com</strong>posti (espressi<br />
<strong>com</strong>e metalli equivalenti) prod. termoelettrica<br />
su alcuni impianti per una potenza<br />
kg 7.245 66.132 85.846 10.046 6.963<br />
<strong>com</strong>plessiva di<br />
prod. termoelettrica <strong>com</strong>binata<br />
MW 24.492 27.934 26.765 26.482 24.995<br />
con produzione di calore<br />
su alcuni impianti per una potenza<br />
kg 89.549 53.085 42.430 46.111 64.873<br />
<strong>com</strong>plessiva di MW 8.183 6.979 6.979 5.135 5.145<br />
prod. nucleare kg 49,7 70,3 104 15,2 249<br />
su una potenza <strong>com</strong>plessiva di<br />
prod. nucleare <strong>com</strong>binata con<br />
MW 2.442 3.522 3.514 3.527 3.535<br />
produzione di calore kg 168 158 366 257 567<br />
su una potenza <strong>com</strong>plessiva di MW 1.712 1.762 1.816 1.818 1.816<br />
Totale prod. energia elettrica<br />
Deposito e movimentazione<br />
kg 97.012 119.444 128.746 56.430 72.651<br />
<strong>com</strong>bustibili kg 12,2 7,7 4 22,3 35,1<br />
Totale kg 97.025 119.452 128.750 56.452 72.686<br />
Azoto totale (espresso <strong>com</strong>e N) prod. termoelettrica<br />
su alcuni impianti per una potenza<br />
kg 110.133 286.230 337.125 67.282 557.984<br />
<strong>com</strong>plessiva di<br />
prod. termoelettrica <strong>com</strong>binata<br />
MW 27.114 28.147 27.716 26.136 25.841<br />
con produzione di calore<br />
su alcuni impianti per una potenza<br />
kg 0 0 0 34,1 371<br />
<strong>com</strong>plessiva di MW 0 0 0 2.277 2.318<br />
prod. nucleare kg 7.407 17.612 5.888 10.664 10.293<br />
su una potenza <strong>com</strong>plessiva di<br />
prod. nucleare <strong>com</strong>binata con<br />
MW 2.442 3.522 3.514 3.527 3.535<br />
produzione di calore kg 40.295 34.566 32.130 33.275 34.847<br />
su una potenza <strong>com</strong>plessiva di MW 1.712 1.762 1.816 1.818 1.816<br />
Totale prod. energia elettrica<br />
Deposito e movimentazione<br />
kg 157.835 338.409 375.143 111.255 603.496<br />
<strong>com</strong>bustibili kg 16,9 12,6 45 57,5 108<br />
Totale kg 157.852 338.421 375.188 111.312 603.604<br />
Fosforo totale (espresso <strong>com</strong>e P) prod. termoelettrica<br />
su alcuni impianti per una potenza<br />
kg 8.873 16.625 23.217 12.110 39.899<br />
<strong>com</strong>plessiva di<br />
prod. termoelettrica <strong>com</strong>binata<br />
MW 24.246 21.970 24.233 25.795 24.830<br />
con produzione di calore<br />
su alcuni impianti per una potenza<br />
kg 0 0 0 75 21,5<br />
<strong>com</strong>plessiva di MW 0 0 0 21,4 21,4<br />
prod. nucleare kg 99,4 118 1.189 1.152 1.085<br />
su una potenza <strong>com</strong>plessiva di<br />
prod. nucleare <strong>com</strong>binata con<br />
MW 2.442 3.522 3.514 3.527 3.535<br />
produzione di calore kg 2.319 2.213 2.491 2.721 2.257<br />
su una potenza <strong>com</strong>plessiva di MW 1.712 1.762 1.816 1.818 1.816<br />
Totale prod. energia elettrica<br />
Deposito e movimentazione<br />
kg 11.292 18.956 26.897 16.059 43.263<br />
<strong>com</strong>bustibili kg 1,83 1,85 3 23 83,8<br />
Totale kg 11.294 18.958 26.900 16.082 43.347<br />
(1) La variabilità dei dati nel periodo quinquennale è dovuta alla variazione del numero di impianti (definito in tabella dalla potenza <strong>com</strong>plessiva in MW) sui quali viene<br />
effettuata l’analisi.<br />
117