rivista italiana di economia demografia e statistica - Sieds
rivista italiana di economia demografia e statistica - Sieds
rivista italiana di economia demografia e statistica - Sieds
- No tags were found...

You also want an ePaper? Increase the reach of your titles
YUMPU automatically turns print PDFs into web optimized ePapers that Google loves.
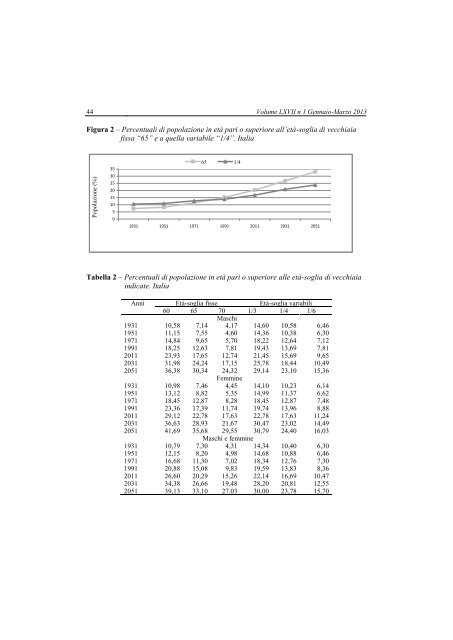
Popolazione (%)44 Volume LXVII n 1 Gennaio-Marzo 2013Figura 2 – Percentuali <strong>di</strong> popolazione in età pari o superiore all’età-soglia <strong>di</strong> vecchiaiafissa “65” e a quella variabile “1/4”. Italia3530252015105065 1/41931 1951 1971 1991 2011 2031 2051Tabella 2 – Percentuali <strong>di</strong> popolazione in età pari o superiore alle età-soglia <strong>di</strong> vecchiaiain<strong>di</strong>cate. ItaliaAnni Età-soglia fisse Età-soglia variabili60 65 70 1/3 1/4 1/61931 10,58 7,14MaschiMaschi 4,17 14,60 10,58 6,461951 11,15 7,55 4,60 14,36 10,38 6,301971 14,84 9,65 5,70 18,22 12,64 7,121991 18,25 12,63 7,81 19,43 13,69 7,812011 23,93 17,65 12,74 21,45 15,69 9,652031 31,98 24,24 17,15 25,78 18,44 10,492051 36,38 30,34 24,32 29,14 23,10 15,36Femmine1931 10,98 7,46 4,45 14,10 10,23 6,141951 13,12 8,82 5,35 14,99 11,37 6,621971 18,45 12,87 8,28 18,45 12,87 7,481991 23,36 17,39 11,74 19,74 13,96 8,882011 29,12 22,78 17,63 22,78 17,63 11,242031 36,63 28,93 21,67 30,47 23,02 14,492051 41,69 35,68 29,55 30,79 24,40 16,03Maschi e femmine1931 10,79 7,30 4,31 14,34 10,40 6,301951 12,15 8,20 4,98 14,68 10,88 6,461971 16,68 11,30 7,02 18,34 12,76 7,301991 20,88 15,08 9,83 19,59 13,83 8,362011 26,60 20,29 15,26 22,14 16,69 10,472031 34,38 26,66 19,48 28,20 20,81 12,552051 39,13 33,10 27,03 30,00 23,78 15,70