I denne artikkelen gir professor Harry Arne Solberg og professor Kjetil Haugen en analyse avsammenhengen mellom landslagenes prestasjoner og import/eksport av spillere over landegrensene.Artikkelen ble publisert i International Journal of Sport Marketing & Sponsorship -http://www.imrpublications.com/SM/IJSM/The international trade of players in Europeanclub football: Consequences for national teamsAv Harry Arne Solberg,Trondheim Business School, Sør-Trøndelag University Collegeog Kjetil K. Haugen,Department of Economics, Molde University CollegeAbstractThe international trade of players in European club football does not seem tohave had any negative effects on the national teams in the major leagues.Data presented in this article indicate a potentially positive effect for Englandand no effect for Spain, Italy and Germany. Contrary to this, the nationalteams in Norway, Greece and France seem to have benefited from exportingplayers to leagues of better quality than their own domestic leagues.Executive summaryThis case study analyses some of the effects of the international tradeof players in European club football and particularly the consequences fornational teams, both the importing and exporting nations. Analyses basedon FIFA rankings do not indicate that the growth in the import of foreignershas had a negative impact upon the national teams in the most successfulfootballing nations. This does not correspond with the idea that foreignplayers are to blame for the lack of success of a national team – a commonlyheld attitude among English football fans. Indeed, for England, the correlationcoefficient indicates that the opposite effect is more likely, namely thatthe national team has benefited from importing foreigners to the EnglishPremier League (EPL). During the 2006-07 season 42% of the EPL playerswere foreigners, assuming players from Scotland, Wales, Northern Irelandand Ireland be counted as ‘English’. If the latter group had been registeredas foreigners, the proportion would increase to 62%. In all of the top fourteams (Arsenal, Chelsea, Liverpool and Manchester United), the proportionof foreigners exceeded 50%.One explanation for this could be that foreign players have improved thelearning environment for the English players – i.e. for those who have notbeen displaced from their clubs. The import of foreigners has enabled themto play with, and against, more talented players than would otherwise havebeen possible. This, in turn, may have improved their quality as players.The analyses did not reveal any effects, either positive or negative, fornational teams in the other major European football nations, i.e. Spain, Italyand Germany. The data indicates that the national teams in Norway, Greeceand even France have benefited from exporting their best footballers to theleagues in the major nations, according to the FIFA ranking. The most likelyreason for this is that players from these nations have improved by movingto clubs operating in leagues where the learning environment is better thanat home. In turn, this may have benefited their respective national teams.IntroductionThe international trade of players in European club football is well established.It involves both import from other continents and the movementwithin Europe of European players. These developments have also influencedfrom which domestic clubs the national teams recruit their players.Until the mid-1990s the majority of European internationals played forclubs in their own domestic leagues. Since the start of the 21st century thispattern has been dramatically altered, with football players moving acrossborders in much the same way as other imports and exports.Many in the ‘football family’ have not been happy with this development,mainly through fear that foreigners will displace local talent and therebyreduce the quality of the national team. Sepp Blatter, FIFA president, hasargued for introducing an article in a new EU treaty to allow quotas on foreignfootballers. Trevor Brooking, the former England international, who by2007 was the English Football Association's director of development, hasexpressed similar views. Brooking suggests the growing number of foreignplayers in the Premier League has deprived domestic talent of first-teamfootball, which, in turn, has had a detrimental effect on England’s chancesof being successful in major tournaments (Slater, 2007): ”The national teamhas to be under threat – the numbers show that. I don't think you can underestimateit. It’s a major concern.”Norway’s national team coach, Åge Hareide, has expressed similar concerns:“The development is unfortunate. When young players are disallowedfrom playing, this will reduce the quality of the national team” (Vik &Mørseth, 2007).Grassroots football fans have also expressed their concerns. Among Englishfans, 59% feared that the influx of foreign stars to the Premier Leaguehad had a negative impact on the national side, according to The FootballFans Census (Payne, 2007). This corresponds with the results of a surveyconducted by Sky News, where the majority blamed the Premier League’sforeign legion as the major cause for England being dumped out of the EuropeanChampionships (Bowden, 2007).Michel Platini, UEFA president, has expressed a different view and insteadsupported the European Commission’s principle of free labour movementwithin the EU, which allows European soccer players to seek employmentwherever they want among the 27 nations (Associated Press, 2007).This case study focuses on the consequences of the developments discussedabove, with special attention given to national teams in both the importand the export nations. It provides an overview of developments sinceearly in the 1990s and goes on to discuss whether the import/export offootballers has had an effect on the quality of national football teams.TABLE 1 Percentage of foreign players in European football leaguesThe international trade of inputsIn this paper, football players are regarded as inputs to the production offootball games. The presence of foreigners in European club football is nota new phenomenon. For several decades clubs in Portugal and Spain haveimported Latin American players.Nevertheless, the rate of import was relatively moderate before the mid-1990s (see Tables 1 and 2). By the start of the 21st century, foreigners weremoving from all over the world, including from other European nations. Table3 shows the native countries of foreign players in the major five Europeanleagues. It reveals that English and German clubs recruited the largest contingentfrom other European nations; Italian and Spanish clubs preferredLatin Americans; and French clubs preferred Africans.As shown in Table 2, foreign players were in a majority in several clubs.The English Premier League (EPL) had the highest proportion (62%) duringthe 2006-07 season, assuming the players from Scotland, Wales, NorthernIreland, and Ireland were registered as non-English (Table 2). If the latterwere registered as English, the proportion was reduced to 43% (Table 1).Of the 10 European clubs with the highest proportion of foreign players,seven were English. In England, Italy and Spain, the top clubs had a higherproportion than other clubs – a pattern that was not replicated in France,Germany and the Netherlands.The most talented players have moved directly to the best clubs in the topfootballing nations. Those further down the ‘quality ladder’ have moved tolower-rated clubs in these leagues or to clubs outside the top five.34 FOTBALLtreneren - nr. 5 - 2009
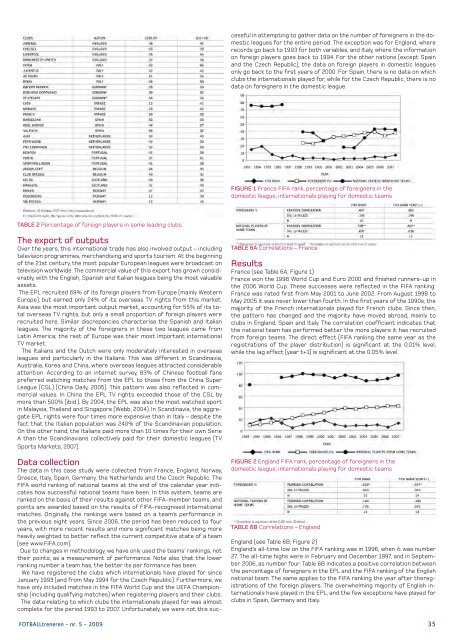
Data collectionThe data in this case study were collected from France, England, Norway,Greece, Italy, Spain, Germany, the Netherlands and the Czech Republic. TheFIFA world ranking of national teams at the end of the calendar year indicateshow successful national teams have been. In this system, teams areranked on the basis of their results against other FIFA-member teams, andpoints are awarded based on the results of FIFA-recognised internationalmatches. Originally, the rankings were based on a team’s performance inthe previous eight years. Since 2006, the period has been reduced to fouryears, with more recent results and more significant matches being moreheavily weighted to better reflect the current competitive state of a team(see www.FIFA.com).Due to changes in methodology, we have only used the teams’ rankings, nottheir points, as a measurement of performance. Note also that the lowerranking number a team has, the better its per formance has been.We have registered the clubs which internationals have played for sinceJanuary 1993 (and from May 1994 for the Czech Republic). Furthermore, wehave only included matches in the FIFA World Cup and the UEFA Championship(including qualifying matches) when registering players and their clubs.The data relating to which clubs the internationals played for was almostcomplete for the period 1993 to 2007. Unfortunately, we were not this successfulin attempting to gather data on the number of foreigners in the domesticleagues for the entire period. The exception was for England, whererecords go back to 1993 for both variables, and Italy, where the informationon foreign players goes back to 1994. For the other nations (except Spainand the Czech Republic), the data on foreign players in domestic leaguesonly go back to the first years of 2000. For Spain, there is no data on whichclubs the internationals played for, while for the Czech Republic, there is nodata on foreigners in the domestic league.FIGURE 1 France FIFA rank, percentage of foreigners in thedomestic league, internationals playing for domestic teamsTABLE 2 Percentage of foreign players in some leading clubsThe export of outputsOver the years, this international trade has also involved output – includingtelevision programmes, merchandising and sports tourism. At the beginningof the 21st century, the most popular European leagues were broadcast ontelevision worldwide. The commercial value of this export has grown considerably,with the English, Spanish and Italian leagues being the most valuableassets.The EPL recruited 69% of its foreign players from Europe (mainly WesternEurope), but earned only 24% of its overseas TV rights from this market.Asia was the most important output market, accounting for 55% of its totaloverseas TV rights, but only a small proportion of foreign players wererecruited here. Similar discrepancies characterise the Spanish and Italianleagues. The majority of the foreigners in these two leagues came fromLatin America; the rest of Europe was their most important internationalTV market.The Italians and the Dutch were only moderately interested in overseasleagues and particularly in the Italians. This was different in Scandinavia,Australia, Korea and China, where overseas leagues attracted considerableattention. According to an inter<strong>net</strong> survey, 83% of Chinese football fanspreferred watching matches from the EPL to those from the China SuperLeague (CSL) (China Daily, 2005). This pattern was also reflected in commercialvalues. In China the EPL TV rights exceeded those of the CSL bymore than 500% (ibid.). By 2004, the EPL was also the most watched sportin Malaysia, Thailand and Singapore (Webb, 2004). In Scandinavia, the aggregateEPL rights were four times more expensive than in Italy – despite thefact that the Italian population was 240% of the Scandinavian population.On the other hand, the Italians paid more than 10 times for their own SerieA than the Scandinavians collectively paid for their domestic leagues (TVSports Markets, 2007).TABLE 6A Correlations – FranceResultsFrance (see Table 6A; Figure 1)France won the 1998 World Cup and Euro 2000 and finished runners-up inthe 2006 World Cup. These successes were reflected in the FIFA ranking:France was rated first from May 2001 to June 2002. From August 1998 toMay 2005 it was never lower than fourth. In the first years of the 1990s, themajority of the French internationals played for French clubs. Since then,the pattern has changed and the majority have moved abroad, mainly toclubs in England, Spain and Italy. The correlation coefficient indicates thatthe national team has performed better the more players it has recruitedfrom foreign teams. The direct effect (FIFA ranking the same year as theregistrations of the player distribution) is significant at the 0.01% level,while the lag effect (year t+1) is significant at the 0.05% level.FIGURE 2 England FIFA rank, percentage of foreigners in thedomestic league, internationals playing for domestic teamsTABLE 6B Correlations – EnglandEngland (see Table 6B; Figure 2)England’s all-time low on the FIFA ranking was in 1996, when it was number27. The all-time highs were in February and December 1997, and in September2006, as number four. Table 6B indicates a positive correlation betweenthe percentage of foreigners in the EPL and the FIFA ranking of the Englishnational team. The same applies to the FIFA ranking the year after theregistrationsof the foreign players. The overwhelming majority of English internationalshave played in the EPL, and the few exceptions have played forclubs in Spain, Germany and Italy.FOTBALLtreneren - nr. 5 - 2009 35