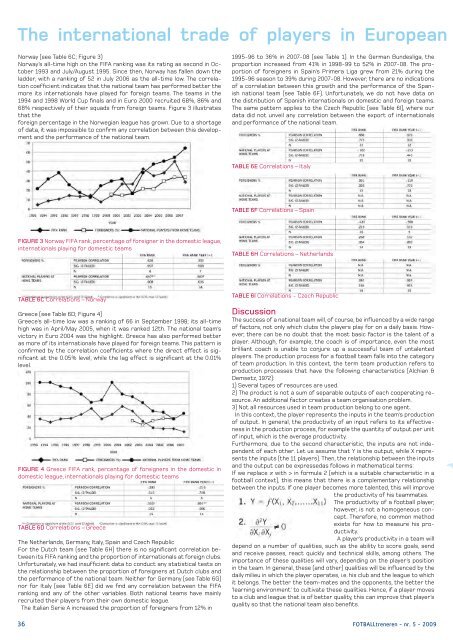
The international trade of players in EuropeanNorway (see Table 6C; Figure 3)Norway’s all-time high on the FIFA ranking was its rating as second in October1993 and July/August 1995. Since then, Norway has fallen down theladder, with a ranking of 52 in July 2006 as the all-time low. The correlationcoefficient indicates that the national team has performed better themore its internationals have played for foreign teams. The teams in the1994 and 1998 World Cup finals and in Euro 2000 recruited 68%, 86% and68% respectively of their squads from foreign teams. Figure 3 illustratesthat theforeign percentage in the Norwegian league has grown. Due to a shortageof data, it was impossible to confirm any correlation between this developmentand the performance of the national team.1995-96 to 36% in 2007-08 (see Table 1). In the German Bundesliga, theproportion increased from 41% in 1998-99 to 52% in 2007-08. The proportionof foreigners in Spain’s Primera Liga grew from 21% during the1995-96 season to 39% during 2007-08. However, there are no indicationsof a correlation between this growth and the performance of the Spanishnational team (see Table 6F). Unfortunately, we do not have data onthe distribution of Spanish internationals on domestic and foreign teams.The same pattern applies to the Czech Republic (see Table 6I), where ourdata did not unveil any correlation between the export of internationalsand performance of the national team.TABLE 6E Correlations – ItalyTABLE 6F Correlations – SpainFIGURE 3 Norway FIFA rank, percentage of foreigner in the domestic league,internationals playing for domestic teamsTABLE 6H Correlations – NetherlandsTABLE 6C Correlations – NorwayGreece (see Table 6D; Figure 4)Greece’s all-time low was a ranking of 66 in September 1998; its all-timehigh was in April/May 2005, when it was ranked 12th. The national team’svictory in Euro 2004 was the highlight. Greece has also performed betteras more of its internationals have played for foreign teams. This pattern isconfirmed by the correlation coefficients where the direct effect is significantat the 0.05% level, while the lag effect is significant at the 0.01%level.FIGURE 4 Greece FIFA rank, percentage of foreigners in the domestic indomestic league, internationals playing for domestic teamsTABLE 6D Correlations – GreeceThe Netherlands, Germany, Italy, Spain and Czech RepublicFor the Dutch team (see Table 6H) there is no significant correlation betweenits FIFA ranking and the proportion of internationals at foreign clubs.Unfortunately, we had insufficient data to conduct any statistical tests onthe relationship between the proportion of foreigners at Dutch clubs andthe performance of the national team. Neither for Germany (see Table 6G)nor for Italy (see Table 6E) did we find any correlation between the FIFAranking and any of the other variables. Both national teams have mainlyrecruited their players from their own domestic league.The Italian Serie A increased the proportion of foreigners from 12% inTABLE 6I Correlations - Czech RepublicDiscussionThe success of a national team will, of course, be influenced by a wide rangeof factors, not only which clubs the players play for on a daily basis. However,there can be no doubt that the most basic factor is the talent of aplayer. Although, for example, the coach is of importance, even the mostbrilliant coach is unable to conjure up a successful team of untalentedplayers. The production process for a football team falls into the categoryof team production. In this context, the term team production refers toproduction processes that have the following characteristics (Alchian &Demsetz, 1972):1) Several types of resources are used.2) The product is not a sum of separable outputs of each cooperating resource.An additional factor creates a team organisation problem.3) Not all resources used in team production belong to one agent.In this context, the player represents the inputs in the team’s productionof output. In general, the productivity of an input refers to its effectivenessin the production process, for example the quantity of output per unitof input, which is the average productivity.Furthermore, due to the second characteristic, the inputs are not independentof each other. Let us assume that Y is the output, while X representsthe inputs (the 11 players). Then, the relationship between the inputsand the output can be expressedas follows in mathematical terms:If we replace ≠ with > in formula 2 (which is a suitable characteristic in afootball context), this means that there is a complementary relationshipbetween the inputs. If one player becomes more talented, this will improvethe productivity of his teammates.The productivity of a football player,however, is not a homogeneous concept.Therefore, no common methodexists for how to measure his productivity.A player’s productivity in a team willdepend on a number of qualities, such as the ability to score goals, sendand receive passes, react quickly and technical skills, among others. Theimportance of these qualities will vary, depending on the player’s positionin the team. In general, these (and other) qualities will be influenced by thedaily milieu in which the player operates, i.e. his club and the league to whichit belongs. The better the team-mates and the opponents, the better the‘learning environment’ to cultivate these qualities. Hence, if a player movesto a club and league that is of better quality, this can improve that player’squality so that the national team also benefits.36 FOTBALLtreneren - nr. 5 - 2009
club football: Consequences for national teamsIn Europe, the leagues in England, Spain, Italy and Germany have been of thebest quality, according to the performances in the UEFA Champions League– see Table 7. Together, they had 79% of the quarterfinalists, 73% of thesemi-finalists and 84% of the finalists between 1994-95 and 2006-07. Theseleagues have also earned the lion’s share of the revenues in European clubfootball, a pattern that has been documented by Deloitte’s annual footballreview reports (Deloitte, 2007).If foreigners displace all domestic talent to lower divisions, then the nationalteam will be negatively affected. The consequences of a moderate import,however, are more complicated. If foreigners are more talented thanthe displaced domestic players, then the quality of the domestic league willimprove. This, in turn, will improve the learning environment for those whokeep their places. They will play both together with and against more talentedteam-mates and opponents, compared to a situation where there is noimport. This also applies to imported players, assuming that their new club(and league) has more talented players than their former club/league. Thisassumes there are quality differences between the leagues in the importingand exporting nations. If not, the players would be unlikely to improve bymoving back and forth.Only for England did we uncover a relationship between the growth in thenumber of foreign payers and the performance of the national team. Thecorrelation coefficient indicates a positive relationship. This does not supportthe idea that the foreigners in the EPL are to blame for the lack ofsuccess of the English national team. One explanation for this could be thatthe English talents have improved through playing with foreigners who weremore talented than the domestic players they displaced. Although localplayers have been displaced, during the 2006-07 season about 100 playersin the EPL were English.For them, the learning environment ought to have been better than if therehad been no imports.England also failed to qualify for the World Cup finals in 1974, 1978 and1994, and at that time the EPL hardly had any foreigners from outside theBritish Isles. The majority of English internationals have played for domesticclubs since the FIFA ranking was launched. The few exceptions have playedfor clubs in Spain, Italy and Germany, which are of about the same quality asthe English clubs.A different pattern was uncovered for France, Greece and Norway, all ofwhich have performed better the more their internationals have played forforeign teams. One reason for this could be that players have improved bymoving to leagues of better quality than their home leagues. This certainlyapplies to the Norwegian league, which is not of the same quality as theleagues in the major European football nations.TABLE 7 Distribution of teams in UEFA Champions League1994/95 – 2006/07Greece improved its FIFA ranking during the first years of this century, aperiod in which the proportion of Greece’s internationals playing for foreignclubs grew. The correlation coefficients indicate that even France may havebenefited from exporting players. It won two international championshipsand finished once as runner-up since 1998. Although French clubs have performedquite well in the UEFA Champions League, they have not been assuccessful as clubs from Italy, Spain, England and Germany. The majority ofFrench internationals have played for clubs in these nations since the late1990s.The correlation coefficients did not indicate any effects for the Netherlandsand the Czech Republic, both having been quite successful in thepast two decades. However, the proportions of their internationals playingabroad have been high, and stable, so this in itself made it difficult tomeasure whether the export of domestic talents had had any effect on thenational teams.ConclusionTo summarise, our findings do not indicate that the national teams in themajor football nations have suffered through importing foreigners. Indeed,the opposite effect seems to be likely for England, while no effects wererevealed for Italy, Spain and Germany.On the other hand, the national teams outside the top leagues may havebenefited from exporting their internationals to these leagues.This movement of players can also influence the commercial values ofclubs and national teams. In general, sponsors want to maximise attentionfor themselves and their products. The better the players and the nationalteam perform, the more sponsors will be willing to pay to by connected tothem. Furthermore, if players are recruited by special popular teams, thiscan in itself provide more attention in the media and hence also benefittheir respective national teams. Two examples of this are the Norwegian internationalsOle Gunnar Solskjær and John Arne Riise, who for several yearsplayed for Manchester United and Liverpool respectively. Not only did theyimprove as football players by playing for two of the best clubs in the world,they also generated more attention for the Norwegian national team.Finally, some comments on data and methodological issues. The fact thatthe trade of football players really only took off in the 1990s means thatthe data available is limited. This reduces our ability to conduct more sophisticatedstatistical analyses. Therefore, the statistical measurementsonly consist of computation of correlation coefficients. However, where nocorrelation existed, then there would be no reason to continue, for example,with multiple regression analysis. Furthermore, a team’s FIFA ranking isbased on its performances over the previous four years (or the past eightyears until 1999), while we have used the end-of-year ranking in one alternativeand the following year in the second alternative. This, of course is amethodological shortcoming. However, the fact that the two sets of resultscorrespond does indicate some stability. Hence, the method is acceptablefor our main purpose: to question whether the international movement ofplayers had had negative effects on the national teams.This case study is explorative in character. To our knowledge it is one of thefirst analyses of this issue. Therefore, other researchers are invited to takeup the baton and produce analyses of this and related issues. We acknowledgethat the issues investigated in this paper are complicated and thatthe performances of national teams are influenced by many other factorsthan whether its internationals play for domestic or foreign clubs. Therefore,future research should also analyse other factors beyond the limits ofour research.© 2008 International Marketing Reports. Artikkelen er litt forkortet.BiographiesHarry Arne Solberg is Professor of Economics at TrondheimBusiness School at Sør-Trøndelag University College,Norway. He has published a number of articles inthe field of sports economics and sports management– with particular attention to the economics of sportingevents and sports broadcasting. In 2007, with professorChris Gratton, he published the text book The Economicsof Sport Broadcasting. Solberg is a member of theeditorial boards of the International Journal of Sport Financeand European Sport Management Quarterly. He isalso a regular reviewer for several other journals.Kjetil K. Haugen is Professor of Logistics at Molde UniversityCollege, Norway, and holds academic positions inthe Norwegian University of Science and Technology. Hegraduated with an MSc in operations research in 1984and earned a PhD in computer science in 1991 from theNorwegian University of Science and Technology. He hasheld various research administrative positions at SIN-TEF in Trondheim and More Research, Molde. His currentinterests include sports economics (mainly soccer) andhe is a solid supporter of Molde Fotballklubb, the smallestcity ever to have a team in the Champions League.ReferencesAlchian, A.A. & Demsetz, H. (1972) Production, informationcosts and economic organisation, American EconomicReview 62(5), 777-95. Bowden, D. (2007) Foreignstars blamed for England exit, Sky.com. Retrieved 23May 2008 from: http://news.sky.com/skynews/article/0,,30100-1293996,00.htmlCentre internationald’etude du sport [International centre for sports studies](2007) Etude anuelle du marché du travail Européendes footballeurs [Annual review of the Europeanfootball players’ labour market]. Neuchâtel. China Daily(2005) Super girls beat the Super League, 24 August.Retrieved 23 May 2008 from: http://china.org.cn/english/sports/139588.htmDeloitte (2007) Deloitte AnnualReview of Football Finance – Taking new directions.Manchester: Deloitte & Touche LLP. European footballclubs and squads (2007) Retrieved 15 October 2007from: http://www.eufo.de FootballSquads (2008) Retrieved23 May 2008 from: http://www.footballsquads.co.uk/national.htm Payne, G. (2007) Just 4% of fansbacking 2010 glory, The Sun, 28 November. Retrieved23 May 2008 from:http://www.thesun.co.uk/sol/homepage/sport/football/article515697.ece.Slater,M. (2007)English football under threat, BBC.co.uk. Retrieved 23May 2008 from: http://news.bbc.co.uk/sport2/hi/football/6975955.stmThe Associated Press (2007) Platinisays FIFA plans on foreign player limits are impossible,11 October. Retrieved 23 May 2008 from: http://www.iht.com/articles/ap/2007/10/11/sports/EU-SPTSOC-Platini-Foreign-Players.php SportBusiness Group Ltd.(2006) TV Sports Markets 10(21/22), London. SportBusinessGroup Ltd. (2007) TV Sports Markets 11(17), London.UEFA (2008) Retrieved 14 May 2008 from: http://www.uefa.com/competitions/ucl/index.html Vik, Ø. & Mørseth,T.O. (2007) Bt.no. Utlendinger overtar norsk fotball. [Foreignerstake over Norwegian football]. Retrieved 23 May2008 from: http://fotball.bt.no/eliteserien/article77359.ece Webb, N. (2004) TV rights soar as Asia brands it likeBeckham. Retrieved 23 May 2008 from: http://unison.ie/irish_independent/stories.php3?ca=35&si=1261 912&issue_id=11502FOTBALLtreneren - nr. 5 - 2009 37