Dóra Fazekas Carbon Market Implications for new EU - UniCredit ...
Dóra Fazekas Carbon Market Implications for new EU - UniCredit ...
Dóra Fazekas Carbon Market Implications for new EU - UniCredit ...

You also want an ePaper? Increase the reach of your titles
YUMPU automatically turns print PDFs into web optimized ePapers that Google loves.
of installations in each category changes as a result of <strong>new</strong> installations beginning operations and<br />
installations facing closure.<br />
Installation<br />
Verified CO 2<br />
emissions<br />
2005 2006 2007<br />
Zero emitters 0 kt 2 0.87% 2 0.89% 1 0.59%<br />
“De minimis”<br />
emitters<br />
Small emitters<br />
Medium emitters<br />
under 10 kt 75 32.75% 71 31.70% 43 25.29%<br />
between 10 and 50<br />
kt<br />
between 50 and<br />
500 kt<br />
98 42.79% 97 43.30% 84 49.41%<br />
42 18.34% 42 18.75% 33 19.41%<br />
Large emitters over 500 kt 12 5.24% 12 5.36% 9 5.29%<br />
Provided all necessary in<strong>for</strong>mation 229 100.00% 224 100.00% 170 100.00%<br />
Provided only incomplete in<strong>for</strong>mation 19 7.60% 24 9.60% 78 30.71%<br />
All installations 250 100.00% 250 100.00% 254 100.00%<br />
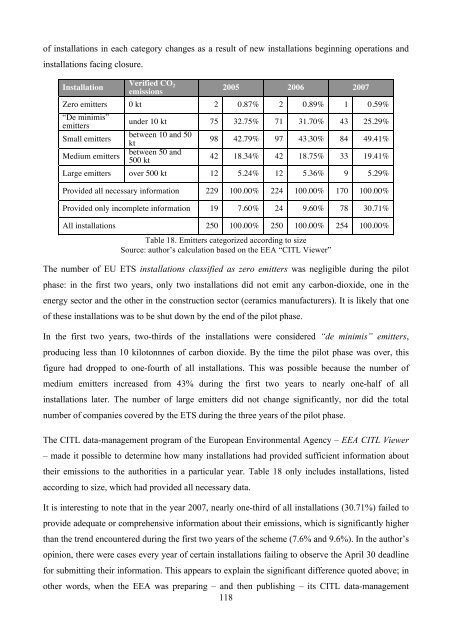
Table 18. Emitters categorized according to size<br />
Source: author’s calculation based on the EEA “CITL Viewer”<br />
The number of <strong>EU</strong> ETS installations classified as zero emitters was negligible during the pilot<br />
phase: in the first two years, only two installations did not emit any carbon-dioxide, one in the<br />
energy sector and the other in the construction sector (ceramics manufacturers). It is likely that one<br />
of these installations was to be shut down by the end of the pilot phase.<br />
In the first two years, two-thirds of the installations were considered “de minimis” emitters,<br />
producing less than 10 kilotonnnes of carbon dioxide. By the time the pilot phase was over, this<br />
figure had dropped to one-fourth of all installations. This was possible because the number of<br />
medium emitters increased from 43% during the first two years to nearly one-half of all<br />
installations later. The number of large emitters did not change significantly, nor did the total<br />
number of companies covered by the ETS during the three years of the pilot phase.<br />
The CITL data-management program of the European Environmental Agency – EEA CITL Viewer<br />
– made it possible to determine how many installations had provided sufficient in<strong>for</strong>mation about<br />
their emissions to the authorities in a particular year. Table 18 only includes installations, listed<br />
according to size, which had provided all necessary data.<br />
It is interesting to note that in the year 2007, nearly one-third of all installations (30.71%) failed to<br />
provide adequate or comprehensive in<strong>for</strong>mation about their emissions, which is significantly higher<br />
than the trend encountered during the first two years of the scheme (7.6% and 9.6%). In the author’s<br />
opinion, there were cases every year of certain installations failing to observe the April 30 deadline<br />
<strong>for</strong> submitting their in<strong>for</strong>mation. This appears to explain the significant difference quoted above; in<br />
other words, when the EEA was preparing – and then publishing – its CITL data-management<br />
118