Dóra Fazekas Carbon Market Implications for new EU - UniCredit ...
Dóra Fazekas Carbon Market Implications for new EU - UniCredit ...
Dóra Fazekas Carbon Market Implications for new EU - UniCredit ...

Create successful ePaper yourself
Turn your PDF publications into a flip-book with our unique Google optimized e-Paper software.
Zero<br />
„De<br />
minimis” Small Medium Large<br />
!! emitters! emitters! emitters! emitters! emitters! Total!<br />
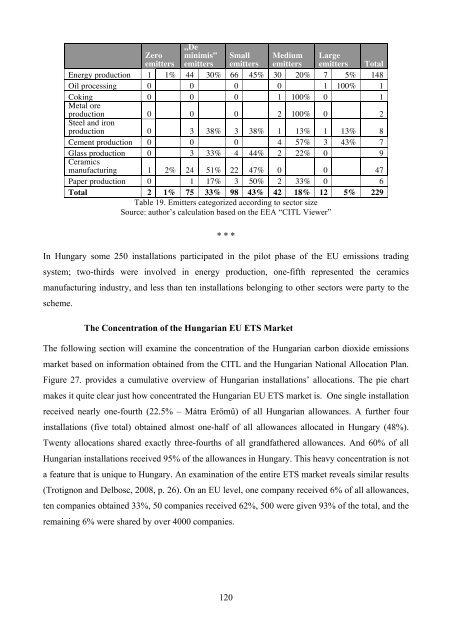
Energy production 1 1% 44 30% 66 45% 30 20% 7 5% 148<br />
Oil processing 0 ! 0 ! 0 ! 0 ! 1 100% 1<br />
Coking<br />
Metal ore<br />
0 ! 0 ! 0 ! 1 100% 0 ! 1<br />
production<br />
Steel and iron<br />
0 !! 0 !! 0 !! 2 100% 0 !! 2<br />
production 0 ! 3 38% 3 38% 1 13% 1 13% 8<br />
Cement production 0 ! 0 ! 0 ! 4 57% 3 43% 7<br />
Glass production<br />
Ceramics<br />
0 ! 3 33% 4 44% 2 22% 0 ! 9<br />
manufacturing 1 2% 24 51% 22 47% 0 ! 0 ! 47<br />
Paper production 0 !! 1 17% 3 50% 2 33% 0 !! 6<br />
Total! 2 1% 75 33% 98 43% 42 18% 12 5% 229<br />
Table 19. Emitters categorized according to sector size<br />
Source: author’s calculation based on the EEA “CITL Viewer”<br />
* * *<br />
In Hungary some 250 installations participated in the pilot phase of the <strong>EU</strong> emissions trading<br />
system; two-thirds were involved in energy production, one-fifth represented the ceramics<br />
manufacturing industry, and less than ten installations belonging to other sectors were party to the<br />
scheme.<br />
The Concentration of the Hungarian <strong>EU</strong> ETS <strong>Market</strong><br />
The following section will examine the concentration of the Hungarian carbon dioxide emissions<br />
market based on in<strong>for</strong>mation obtained from the CITL and the Hungarian National Allocation Plan.<br />
Figure 27. provides a cumulative overview of Hungarian installations’ allocations. The pie chart<br />
makes it quite clear just how concentrated the Hungarian <strong>EU</strong> ETS market is. One single installation<br />
received nearly one-fourth (22.5% – Mátra Er"m!) of all Hungarian allowances. A further four<br />
installations (five total) obtained almost one-half of all allowances allocated in Hungary (48%).<br />
Twenty allocations shared exactly three-fourths of all grandfathered allowances. And 60% of all<br />
Hungarian installations received 95% of the allowances in Hungary. This heavy concentration is not<br />
a feature that is unique to Hungary. An examination of the entire ETS market reveals similar results<br />
(Trotignon and Delbosc, 2008, p. 26). On an <strong>EU</strong> level, one company received 6% of all allowances,<br />
ten companies obtained 33%, 50 companies received 62%, 500 were given 93% of the total, and the<br />
remaining 6% were shared by over 4000 companies.<br />
120