- Page 1 and 2:
PhD Program in Management and Busin
- Page 3 and 4:
List of figures Figure 1. Optimal l
- Page 5 and 6:
„If you want to understand today,
- Page 7 and 8:
Neither the theory nor the empirica
- Page 9 and 10:
Table 1. Installations receiving th
- Page 11 and 12:
oth on national and corporate level
- Page 13 and 14:
1. Climate Change Regulation The fi
- Page 15 and 16:
approaches, activities that are not
- Page 17 and 18:
In Europe the United Kingdom and De
- Page 19 and 20:
(2) Allocating emission rights is d
- Page 21 and 22:
Figure 2. The cap determines the ma
- Page 23 and 24:
Table 5. Tradeable certificates (ba
- Page 25 and 26:
value, sectoral and spatial coverag
- Page 27 and 28:
with their quantified reduction tar
- Page 29 and 30:
* * * Several authors (Hahn and Sta
- Page 31 and 32:
EU ETS Within the context of the UN
- Page 33 and 34:
establishing an international marke
- Page 35 and 36:
(c) Allowances can also be distribu
- Page 37 and 38:
• ETS in New Zealand; • Volunta
- Page 39 and 40:
emissions trading schemes, making i
- Page 41 and 42:
end of the pilot phase. Since Augus
- Page 43 and 44:
Figure 10. Distance to burden-shari
- Page 45 and 46:
Early attitude of companies towards
- Page 47 and 48:
high quality, differentiated produc
- Page 49 and 50:
investments needed in the industry.
- Page 51 and 52:
3.2. Emission Trading in the new EU
- Page 53 and 54:
environmental benefits at a relativ
- Page 55 and 56:
well below their Kyoto target (EEA,
- Page 57 and 58:
lawsuits against the Commission for
- Page 59 and 60:
The most active countries to host J
- Page 61 and 62:
Figure 14. Hot air as supply for AA
- Page 63 and 64:
There have been three proposals on
- Page 65 and 66:
transparency of AAU transfers; redu
- Page 67 and 68:
Figure 18. Tradeable Hungarian AAU
- Page 69 and 70:
“Think Globally, Act Locally” I
- Page 71 and 72:
At the same time, this relatively f
- Page 73 and 74:
processes on the whole act a sink,
- Page 75 and 76:
directly from CO2 emissions are ess
- Page 77 and 78:
1.2. A Review of the Hungarian Lite
- Page 79 and 80:
2. Introducing the EU ETS in Hungar
- Page 81 and 82:
databases containing common data el
- Page 83 and 84:
instances where inconsistent decisi
- Page 85 and 86:
emissions each calendar year Non-tr
- Page 87 and 88:
is found to be in order, they may s
- Page 89 and 90:
economy to a market economy, as is
- Page 91 and 92:
the EU ETS. Many observers believe
- Page 93 and 94:
Emissions allowances to be allocate
- Page 95 and 96:
2005 2006 2007 Installation Alloc.
- Page 97 and 98:
Finance is putting much of the reve
- Page 99 and 100:
conclusion. It is safe to conclude
- Page 101 and 102: allowance surplus, and then increas
- Page 103 and 104: agent. 23 Denmark sold 2,762 thousa
- Page 105 and 106: and Water prepared its proposal on
- Page 107 and 108: What was the reason for this anomal
- Page 109 and 110: considered a “transfer.” Apart
- Page 111 and 112: When allowances are recognized as g
- Page 113 and 114: provision is to be formed against t
- Page 115 and 116: the model shall be supplemented wit
- Page 117 and 118: Participants of the Hungarian EU ET
- Page 119 and 120: program, full sets of emissions dat
- Page 121 and 122: Figure 27. The Concentration of the
- Page 123 and 124: Figure 30. The Hungarian EU ETS mar
- Page 125 and 126: Figure 32. Positions of Hungarian E
- Page 127 and 128: Figure 40 below shows the allocatio
- Page 129 and 130: 3.2. The Impact of the EU ETS on Hu
- Page 131 and 132: interviews, that companies looked u
- Page 133 and 134: neither emissions-reduction targets
- Page 135 and 136: was considered, since they all obta
- Page 137 and 138: spillover effect; this, however, co
- Page 139 and 140: During the pilot period, Hungarian
- Page 141 and 142: to comply shall have their names pu
- Page 143 and 144: eact efficiently to regulations. Th
- Page 145 and 146: ensuring great enough profit, it sw
- Page 147 and 148: combined with an internal price tha
- Page 149 and 150: Were Emissions Actually Reduced? Co
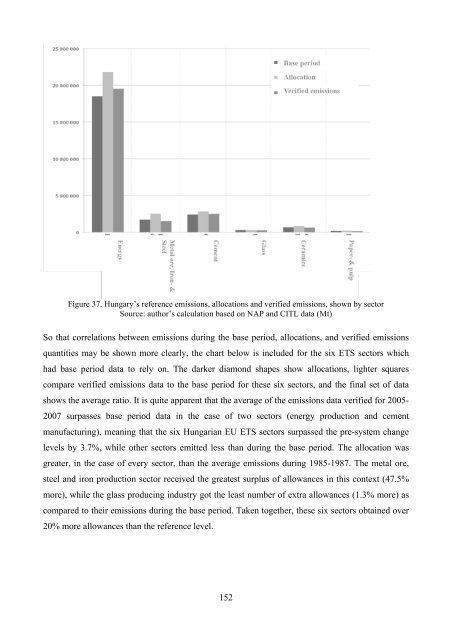
- Page 151: column) and the verified emissions
- Page 155 and 156: * * * The effects of the EU ETS on
- Page 157 and 158: (2) Transfer account of allowances,
- Page 159 and 160: In an EU-context, Hungary held its
- Page 161 and 162: installations the author spoke to w
- Page 163 and 164: Companies, which were certain of th
- Page 165 and 166: Figure 42. Hungarian transactions d
- Page 167 and 168: phase. CITL Data The transaction da
- Page 169 and 170: International Transfers The author
- Page 171 and 172: Based on these numbers, it may be c
- Page 173 and 174: The two right-hand side columns in
- Page 175 and 176: sales, and how much was accounted f
- Page 177 and 178: the CITL only contains data on wher
- Page 179 and 180: approximately two-fifths of the vol
- Page 181 and 182: (3) Installations that had shut dow
- Page 183 and 184: production, one-fifth represented t
- Page 185 and 186: IV. EXPERIENCES OF THE EU ETS PILOT
- Page 187 and 188: starting in 2012, the European Unio
- Page 189 and 190: originally allocated. Based on thes
- Page 191 and 192: economic development rather than as
- Page 193 and 194: Hungary has still to learn to opera
- Page 195 and 196: Appendix I. - Questionnaire 3.c. Cl
- Page 197 and 198: Had surplus but did not sell EUAs ,
- Page 199 and 200: Appendix III. - Accounting Aspects
- Page 201 and 202: Appendix V. - Overview and main fea
- Page 203 and 204:
Appendix VII. - Foreign emission al
- Page 205 and 206:
Hungária Cementipari Rt. 2006 HU 5
- Page 207 and 208:
Reductions Clean Development Mechan
- Page 209 and 210:
Linking Directive from project acti
- Page 211 and 212:
VII. REFERENCES Ahman, M. - Burtraw
- Page 213 and 214:
Burtraw, D. - Palmer, K. - Bharvirk
- Page 215 and 216:
EEA (2006): Greenhouse gas emission
- Page 217 and 218:
Hahn, R. - Stavins, R. (1999): What
- Page 219 and 220:
Kaderják, P. (1997): Economics for
- Page 221 and 222:
Montero, J. P. (1997): Marketable P
- Page 223 and 224:
Philibert, C. (2006): Certainty ver
- Page 225 and 226:
Tietenberg, T. (1992): Relevant Exp
- Page 227 and 228:
Woerdmann, E. (2003): Developing ca
- Page 229 and 230:
Hungarian law - Hungarian governmen
- Page 231 and 232:
Oxford University Press, USA http:/
- Page 233:
Author’s Publications related to