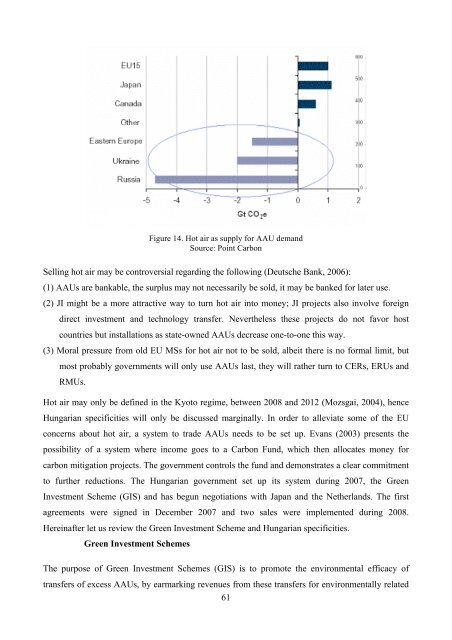
of this decade as a result of economic re-growth and industrial consolidation achieved by some countries. Missfeldt and Villavicencio attempted to quantify hot air trading first in 2000, then in 2002. In 2000 they compared target emissions to projected levels <strong>for</strong> 2010. They defined hot air is as the difference between CO2 emissions as required by the target in the period 2008-12 and CO2 emissions projected <strong>for</strong> 2010. In 2002, they compared hot air to baseline emissions. Table 12 and figure 14. give an overview of their results. Negative numbers indicate that emissions overshoot the target and that, unless more stringent domestic measures are taken, the corresponding countries have to acquire emissions. To calculate the value of hot air trading in 2000 they assumed the price to be USD35 per tonne of CO2, and then in 2002 they calculated with USD5 per tonne of CO2. The value is presented <strong>for</strong> the average current market price (#20 in April, 2008). The table clearly shows that Russia and Ukraine, and Romania have the highest potential. Countries Hot air * (thousand tonnes) Hot air ** (thousand tonnes) Spare CO2 emissions in % of projected 2010 CO2 emissions * % of base year ** Hot air evaluated at current market price (!20) * ** Bulgaria 22,651 -8,581.6 34 6,07 453,020 -171,632 Croatia -10,200 5,844.09 -31 18,29 -204,000 116,882 Czech -13,749 -17,216.20 -8 8,96 Republic -274,980 -344,324 Estonia 9,877 14,578.98 40 35,80 197,540 291,580 Hungary 11,152 10,221.40 17 9,82 223,040 204,428 Latvia N/A 12,676.48 N/A 35,54 N/A 253,530 Lithuania 1,372 -3,253.84 4 6,31 27,440 -65,076.8 Poland 8 83,452 -53,972.5 18,250.40 23 -11 3,19 1,669,040 -1,079,450 365,008 Romania 18,273 58,437.68 11 20,48 365,460 1,168,754 Russian 72,300 128,532.00 3 4,23 Federation 1,446,000 2,570,640 Slovakia 363 180.40 1 0,25 7,260 3,608 Slovenia -3,680 -1,758.29 -22 9,15 -73,600 -35,165.8 Ukraine 105,776 138,338.00 18 15,27 2,115,520 2,766,760 Table 12. Comparing result of two studies by Missfeldt and Villavicencio (2000 and 2002) * Missfeldt and Villavicencio (2000) ** Missfeldt and Villavicencio (2002) 8 For Poland two different estimates have been made. Poland-1 uses the projections presented in the first Polish national communication, and Poland-2 presents the projections from the second national communication. As the example of Poland shows, these calculations remain highly uncertain. (p.386) 60
Figure 14. Hot air as supply <strong>for</strong> AAU demand Source: Point <strong>Carbon</strong> Selling hot air may be controversial regarding the following (Deutsche Bank, 2006): (1) AAUs are bankable, the surplus may not necessarily be sold, it may be banked <strong>for</strong> later use. (2) JI might be a more attractive way to turn hot air into money; JI projects also involve <strong>for</strong>eign direct investment and technology transfer. Nevertheless these projects do not favor host countries but installations as state-owned AAUs decrease one-to-one this way. (3) Moral pressure from old <strong>EU</strong> MSs <strong>for</strong> hot air not to be sold, albeit there is no <strong>for</strong>mal limit, but most probably governments will only use AAUs last, they will rather turn to CERs, ERUs and RMUs. Hot air may only be defined in the Kyoto regime, between 2008 and 2012 (Mozsgai, 2004), hence Hungarian specificities will only be discussed marginally. In order to alleviate some of the <strong>EU</strong> concerns about hot air, a system to trade AAUs needs to be set up. Evans (2003) presents the possibility of a system where income goes to a <strong>Carbon</strong> Fund, which then allocates money <strong>for</strong> carbon mitigation projects. The government controls the fund and demonstrates a clear commitment to further reductions. The Hungarian government set up its system during 2007, the Green Investment Scheme (GIS) and has begun negotiations with Japan and the Netherlands. The first agreements were signed in December 2007 and two sales were implemented during 2008. Hereinafter let us review the Green Investment Scheme and Hungarian specificities. Green Investment Schemes The purpose of Green Investment Schemes (GIS) is to promote the environmental efficacy of transfers of excess AAUs, by earmarking revenues from these transfers <strong>for</strong> environmentally related 61
- Page 1 and 2:
PhD Program in Management and Busin
- Page 3 and 4:
List of figures Figure 1. Optimal l
- Page 5 and 6:
„If you want to understand today,
- Page 7 and 8:
Neither the theory nor the empirica
- Page 9 and 10: Table 1. Installations receiving th
- Page 11 and 12: oth on national and corporate level
- Page 13 and 14: 1. Climate Change Regulation The fi
- Page 15 and 16: approaches, activities that are not
- Page 17 and 18: In Europe the United Kingdom and De
- Page 19 and 20: (2) Allocating emission rights is d
- Page 21 and 22: Figure 2. The cap determines the ma
- Page 23 and 24: Table 5. Tradeable certificates (ba
- Page 25 and 26: value, sectoral and spatial coverag
- Page 27 and 28: with their quantified reduction tar
- Page 29 and 30: * * * Several authors (Hahn and Sta
- Page 31 and 32: EU ETS Within the context of the UN
- Page 33 and 34: establishing an international marke
- Page 35 and 36: (c) Allowances can also be distribu
- Page 37 and 38: • ETS in New Zealand; • Volunta
- Page 39 and 40: emissions trading schemes, making i
- Page 41 and 42: end of the pilot phase. Since Augus
- Page 43 and 44: Figure 10. Distance to burden-shari
- Page 45 and 46: Early attitude of companies towards
- Page 47 and 48: high quality, differentiated produc
- Page 49 and 50: investments needed in the industry.
- Page 51 and 52: 3.2. Emission Trading in the new EU
- Page 53 and 54: environmental benefits at a relativ
- Page 55 and 56: well below their Kyoto target (EEA,
- Page 57 and 58: lawsuits against the Commission for
- Page 59: The most active countries to host J
- Page 63 and 64: There have been three proposals on
- Page 65 and 66: transparency of AAU transfers; redu
- Page 67 and 68: Figure 18. Tradeable Hungarian AAU
- Page 69 and 70: “Think Globally, Act Locally” I
- Page 71 and 72: At the same time, this relatively f
- Page 73 and 74: processes on the whole act a sink,
- Page 75 and 76: directly from CO2 emissions are ess
- Page 77 and 78: 1.2. A Review of the Hungarian Lite
- Page 79 and 80: 2. Introducing the EU ETS in Hungar
- Page 81 and 82: databases containing common data el
- Page 83 and 84: instances where inconsistent decisi
- Page 85 and 86: emissions each calendar year Non-tr
- Page 87 and 88: is found to be in order, they may s
- Page 89 and 90: economy to a market economy, as is
- Page 91 and 92: the EU ETS. Many observers believe
- Page 93 and 94: Emissions allowances to be allocate
- Page 95 and 96: 2005 2006 2007 Installation Alloc.
- Page 97 and 98: Finance is putting much of the reve
- Page 99 and 100: conclusion. It is safe to conclude
- Page 101 and 102: allowance surplus, and then increas
- Page 103 and 104: agent. 23 Denmark sold 2,762 thousa
- Page 105 and 106: and Water prepared its proposal on
- Page 107 and 108: What was the reason for this anomal
- Page 109 and 110: considered a “transfer.” Apart
- Page 111 and 112:
When allowances are recognized as g
- Page 113 and 114:
provision is to be formed against t
- Page 115 and 116:
the model shall be supplemented wit
- Page 117 and 118:
Participants of the Hungarian EU ET
- Page 119 and 120:
program, full sets of emissions dat
- Page 121 and 122:
Figure 27. The Concentration of the
- Page 123 and 124:
Figure 30. The Hungarian EU ETS mar
- Page 125 and 126:
Figure 32. Positions of Hungarian E
- Page 127 and 128:
Figure 40 below shows the allocatio
- Page 129 and 130:
3.2. The Impact of the EU ETS on Hu
- Page 131 and 132:
interviews, that companies looked u
- Page 133 and 134:
neither emissions-reduction targets
- Page 135 and 136:
was considered, since they all obta
- Page 137 and 138:
spillover effect; this, however, co
- Page 139 and 140:
During the pilot period, Hungarian
- Page 141 and 142:
to comply shall have their names pu
- Page 143 and 144:
eact efficiently to regulations. Th
- Page 145 and 146:
ensuring great enough profit, it sw
- Page 147 and 148:
combined with an internal price tha
- Page 149 and 150:
Were Emissions Actually Reduced? Co
- Page 151 and 152:
column) and the verified emissions
- Page 153 and 154:
Figure 38. Hungarian reference peri
- Page 155 and 156:
* * * The effects of the EU ETS on
- Page 157 and 158:
(2) Transfer account of allowances,
- Page 159 and 160:
In an EU-context, Hungary held its
- Page 161 and 162:
installations the author spoke to w
- Page 163 and 164:
Companies, which were certain of th
- Page 165 and 166:
Figure 42. Hungarian transactions d
- Page 167 and 168:
phase. CITL Data The transaction da
- Page 169 and 170:
International Transfers The author
- Page 171 and 172:
Based on these numbers, it may be c
- Page 173 and 174:
The two right-hand side columns in
- Page 175 and 176:
sales, and how much was accounted f
- Page 177 and 178:
the CITL only contains data on wher
- Page 179 and 180:
approximately two-fifths of the vol
- Page 181 and 182:
(3) Installations that had shut dow
- Page 183 and 184:
production, one-fifth represented t
- Page 185 and 186:
IV. EXPERIENCES OF THE EU ETS PILOT
- Page 187 and 188:
starting in 2012, the European Unio
- Page 189 and 190:
originally allocated. Based on thes
- Page 191 and 192:
economic development rather than as
- Page 193 and 194:
Hungary has still to learn to opera
- Page 195 and 196:
Appendix I. - Questionnaire 3.c. Cl
- Page 197 and 198:
Had surplus but did not sell EUAs ,
- Page 199 and 200:
Appendix III. - Accounting Aspects
- Page 201 and 202:
Appendix V. - Overview and main fea
- Page 203 and 204:
Appendix VII. - Foreign emission al
- Page 205 and 206:
Hungária Cementipari Rt. 2006 HU 5
- Page 207 and 208:
Reductions Clean Development Mechan
- Page 209 and 210:
Linking Directive from project acti
- Page 211 and 212:
VII. REFERENCES Ahman, M. - Burtraw
- Page 213 and 214:
Burtraw, D. - Palmer, K. - Bharvirk
- Page 215 and 216:
EEA (2006): Greenhouse gas emission
- Page 217 and 218:
Hahn, R. - Stavins, R. (1999): What
- Page 219 and 220:
Kaderják, P. (1997): Economics for
- Page 221 and 222:
Montero, J. P. (1997): Marketable P
- Page 223 and 224:
Philibert, C. (2006): Certainty ver
- Page 225 and 226:
Tietenberg, T. (1992): Relevant Exp
- Page 227 and 228:
Woerdmann, E. (2003): Developing ca
- Page 229 and 230:
Hungarian law - Hungarian governmen
- Page 231 and 232:
Oxford University Press, USA http:/
- Page 233:
Author’s Publications related to