The Potential of Electricity Generation from Poultry Waste in ...
The Potential of Electricity Generation from Poultry Waste in ...
The Potential of Electricity Generation from Poultry Waste in ...

Create successful ePaper yourself
Turn your PDF publications into a flip-book with our unique Google optimized e-Paper software.
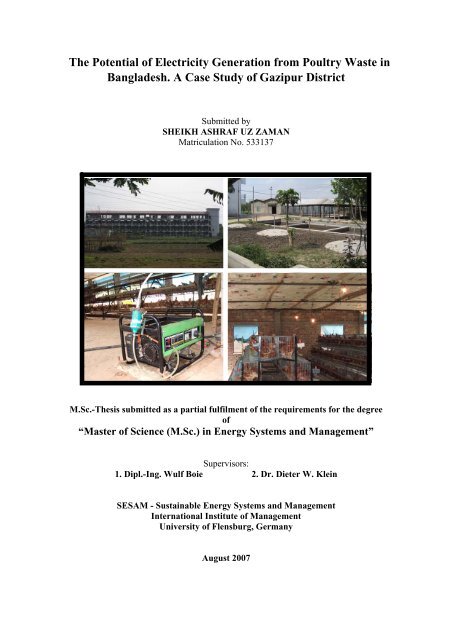
<strong>The</strong> <strong>Potential</strong> <strong>of</strong> <strong>Electricity</strong> <strong>Generation</strong> <strong>from</strong> <strong>Poultry</strong> <strong>Waste</strong> <strong>in</strong><br />
Bangladesh. A Case Study <strong>of</strong> Gazipur District<br />
Submitted by<br />
SHEIKH ASHRAF UZ ZAMAN<br />
Matriculation No. 533137<br />
M.Sc.-<strong>The</strong>sis submitted as a partial fulfilment <strong>of</strong> the requirements for the degree<br />
<strong>of</strong><br />
“Master <strong>of</strong> Science (M.Sc.) <strong>in</strong> Energy Systems and Management”<br />
Supervisors:<br />
1. Dipl.-Ing. Wulf Boie 2. Dr. Dieter W. Kle<strong>in</strong><br />
SESAM - Susta<strong>in</strong>able Energy Systems and Management<br />
International Institute <strong>of</strong> Management<br />
University <strong>of</strong> Flensburg, Germany<br />
August 2007
TABLE OF CONTENTS<br />
Title Page<br />
TABLE OF CONTENTS ........................................................................................................ii<br />
LIST OF ABBREVIATION ...................................................................................................v<br />
LIST OF TABLE ...................................................................................................................vii<br />
LIST OF FIGURES..............................................................................................................viii<br />
LIST OF UNITS.......................................................................................................................x<br />
ACKNOWLEDGEMENT......................................................................................................xi<br />
EXECUTIVE SUMMARY ...................................................................................................xii<br />
ZUSAMMENFASSUNG (Summary <strong>in</strong> German)..............................................................xvi<br />
CHAPTER 1 INTRODUCTION ........................................................................................1<br />
1.1 Background................................................................................................................1<br />
1.2 Objective <strong>of</strong> the Study ...............................................................................................2<br />
1.3 Research Question .....................................................................................................3<br />
1.4 Research Hypothesis:.................................................................................................3<br />
1.5 Significance <strong>of</strong> the Study:..........................................................................................4<br />
1.6 Overview <strong>of</strong> the Chapters ..........................................................................................4<br />
CHAPTER 2 BACKGROUND INFORMATION ............................................................5<br />
2.1 Country Background..................................................................................................5<br />
2.1.1 General Overview ...........................................................................................5<br />
2.1.2 Energy Sector <strong>in</strong> Bangladesh..........................................................................7<br />
2.1.3 <strong>Poultry</strong> Sector <strong>in</strong> Bangladesh........................................................................13<br />
2.2 Study Area Background...........................................................................................15<br />
2.2.1 Geography.....................................................................................................15<br />
2.2.2 Key Statistics <strong>of</strong> the Study Area ...................................................................16<br />
2.2.3 Available Energy <strong>in</strong>formation <strong>in</strong> the study area ...........................................16<br />
2.2.4 <strong>Poultry</strong> Sector <strong>in</strong> the Study Area ..................................................................17<br />
CHAPTER 3 METHODOLOGY .....................................................................................20<br />
3.1 Approach..................................................................................................................20<br />
3.2 Sampl<strong>in</strong>g Method.....................................................................................................21<br />
3.3 Data Collection ........................................................................................................22<br />
3.3.1 Secondary Data Collection ...........................................................................23<br />
3.3.2 Primary Data Collection ...............................................................................23<br />
3.4 Data Analysis...........................................................................................................23<br />
ii
TABLE OF CONTENTS (Contd…)<br />
Title Page<br />
3.5 Scenario Method ......................................................................................................24<br />
3.6 <strong>The</strong> Scope and Limitation <strong>of</strong> the Study ...................................................................25<br />
CHAPTER 4 ENERGY CONSUMPTION STATUS IN POULTRY FARMS ............27<br />
4.1 EXISTING UTILIZATION OF ELECTRICITY....................................................27<br />
4.1.1 <strong>Electricity</strong> consumption <strong>of</strong> major electrical appliances used........................27<br />
4.1.2 Daily <strong>Electricity</strong> Consumption Pattern .........................................................32<br />
4.1.3 <strong>Electricity</strong> Deficit and the Use <strong>of</strong> Back Up System......................................33<br />
4.2 EXISTING UTILIZATION OF OTHER ENERGY ...............................................35<br />
4.2.1 Use <strong>of</strong> Biogas + Size <strong>of</strong> Exist<strong>in</strong>g Biogas Plant.............................................35<br />
4.2.2 Use <strong>of</strong> Slurry and Disposal <strong>of</strong> <strong>Poultry</strong> <strong>Waste</strong> ...............................................36<br />
4.3 Attitudes and Barriers ..............................................................................................38<br />
CHAPTER 5 PRESENT STATUS OF ELECTRICITY GENERATION FROM<br />
POULTRY WASTE ...................................................................................39<br />
5.1 Some Properties <strong>of</strong> Biogas:......................................................................................41<br />
5.1.1 Characteristics <strong>of</strong> Biogas ..............................................................................41<br />
5.1.2 Impact <strong>of</strong> H2S................................................................................................42<br />
5.1.3 Impact <strong>of</strong> CO2 ...............................................................................................42<br />
5.2 Status <strong>of</strong> Technology Used <strong>in</strong> GTZ Flagship Project at Raj <strong>Poultry</strong> Farm .............43<br />
5.2.1 Biogas plant ..................................................................................................44<br />
5.2.2 H2S Removal Unit.........................................................................................45<br />
5.2.3 Moisture Removal Unit.................................................................................47<br />
5.2.4 Generator.......................................................................................................48<br />
5.2.5 Regeneration <strong>of</strong> Steel Wool and Silica Gel ..................................................49<br />
5.3 Status <strong>of</strong> Technology used <strong>in</strong> the Study Area:.........................................................49<br />
5.4 Status <strong>of</strong> Energy <strong>Generation</strong> ....................................................................................51<br />
5.5 Problems Encountered with the Technology (Owners’ View):...............................52<br />
CHAPTER 6 POTENTIAL OF ELECTRICITY GENERATION FROM POULTRY<br />
WASTE........................................................................................................53<br />
6.1 F<strong>in</strong>ancial Analysis....................................................................................................54<br />
6.1.1 Assumptions:.................................................................................................55<br />
6.1.2 Overview <strong>of</strong> Scenario result: ........................................................................60<br />
6.2 Analysis <strong>of</strong> Scenario I & II results:..........................................................................62<br />
6.3 Estimate <strong>of</strong> Total <strong>Potential</strong>.......................................................................................67<br />
6.4 Sensitivity Analysis .................................................................................................69<br />
6.4.1 Effect <strong>of</strong> variation <strong>of</strong> <strong>in</strong>vestment cost...........................................................69<br />
6.4.2 Effect <strong>of</strong> variation <strong>of</strong> Discount Rate .............................................................71<br />
iii
TABLE OF CONTENTS (Contd…)<br />
Title Page<br />
CHAPTER 7 CONCLUSION AND RECOMMENDATION........................................75<br />
7.1 Conclusions..............................................................................................................75<br />
7.2 Recommendation .....................................................................................................77<br />
BIBLIOGRAPHY..................................................................................................................78<br />
APPENDICES .....................................................................................................................81<br />
DECLARATION .................................................................................................................100<br />
iv
LIST OF ABBREVIATION<br />
°C : degree Celsius<br />
°F : degree Fahrenheit<br />
am : ante meridiem<br />
BB : Bangladesh Bank<br />
BBS : Bangladesh Bureau <strong>of</strong> Statistics<br />
BCAS : Bangladesh Centre for Advance Studies<br />
BCSIR : Bangladesh Council for Scientific and Industrial Research<br />
BDT : Bangladesh currency Taka<br />
BPDB : Bangladesh Power Development Board<br />
cc : cubic centimeter<br />
CDM : Clean Development Mechanism<br />
CFL : Compact Fluorescent Lamp<br />
CPP : Captive Power Plant<br />
dia : diameter<br />
DLO : District Livestock Officer<br />
DLS : Department <strong>of</strong> Livestock Services<br />
ft 3 : cubic feet<br />
g : gram<br />
GDP : Gross Domestic Product<br />
GS : Grameen Shakti<br />
GTZ : German Technical Cooperation<br />
GWh : Gigawatt hour<br />
HP : Horse Power<br />
HZ : Hertz<br />
IRR : Internal rate <strong>of</strong> return<br />
IPP : Independent Power Producer<br />
kg : kilogram<br />
kgoe : kilogram <strong>of</strong> oil equivalent<br />
KV : kilovolt<br />
kW : Kilowatt<br />
kWh : Kilowatt hour<br />
v
LIST OF ABBREVIATION (Contd…)<br />
l : litre<br />
LGED : Local Government Eng<strong>in</strong>eer<strong>in</strong>g Department<br />
LPG : Liquid Petroleum Gas<br />
m³ : Cubic meter<br />
MJ : Mega Joule<br />
MMCF : Million cubic feet<br />
MW : Megawatt<br />
MWh : Megawatt hour<br />
NEP : National Energy Policy<br />
NPV : Net present value<br />
PBP : Pay back period<br />
PBS : Palli Bidyuit Samity<br />
pm : post meridiem<br />
PPA : Power Purchase Agreement<br />
ppm : parts per million<br />
PVC : Polyv<strong>in</strong>yl chloride<br />
REB : Rural Electrification Board<br />
SPP : Small Power Plant<br />
sq km : square kilometer<br />
TCE : Ton <strong>of</strong> coal equivalent<br />
TCF : Trillion cubic feet<br />
TGTDCL : Titas Gas Transmission and Distribution Company Limited<br />
VAT : Value Added Tax<br />
vi
LIST OF TABLE<br />
Title Page<br />
Table 2.1 Estimated sizes <strong>of</strong> the poultry farms........................................................................14<br />
Table 2.2 Key Statistic <strong>of</strong> Gazipur District..............................................................................16<br />
Table 3.1 Sample distribution <strong>of</strong> different size <strong>of</strong> poultry farm ..............................................22<br />
Table 5.1 Heat<strong>in</strong>g values <strong>of</strong> commercial fuels and its correspond to Biogas..........................41<br />
Table 5.2 Test results <strong>of</strong> dry biogas produced <strong>from</strong> poultry litter ...........................................42<br />
Table 6.1 Cost <strong>of</strong> Generators ...................................................................................................57<br />
Table 6.2 F<strong>in</strong>ancial parameters................................................................................................60<br />
Table 6.3 Cost <strong>of</strong> different sizes generators <strong>from</strong> Fair Trade International.............................64<br />
Table 6.4 Summary <strong>of</strong> estimated potential <strong>of</strong> electricity generation, fertilizer production and<br />
CO2 sav<strong>in</strong>gs <strong>in</strong> Scenario I ................................................................................................68<br />
Table 6.5 Summary <strong>of</strong> estimated potential <strong>of</strong> electricity generation, fertilizer production and<br />
CO2 sav<strong>in</strong>gs <strong>in</strong> Scenario II...............................................................................................68<br />
Table 6.6 Summary <strong>of</strong> estimated potential <strong>of</strong> electricity generation <strong>in</strong> GWh/ Year <strong>in</strong> Gazipur<br />
district ..............................................................................................................................71<br />
Table 6.7 Summary <strong>of</strong> estimated potential <strong>of</strong> electricity generation <strong>in</strong> GWh/ Year <strong>in</strong><br />
Bangladesh.......................................................................................................................71<br />
Table 6.8 Summary <strong>of</strong> estimated potential <strong>of</strong> electricity generation <strong>in</strong> GWh/ Year <strong>in</strong> Gazipur<br />
district ..............................................................................................................................73<br />
Table 6.9 Summary <strong>of</strong> estimated potential <strong>of</strong> electricity generation <strong>in</strong> GWh/ Year <strong>in</strong><br />
Bangladesh.......................................................................................................................74<br />
vii
LIST OF FIGURES<br />
Title page<br />
Figure 2.1 Show<strong>in</strong>g the Geography <strong>of</strong> Bangladesh ...................................................................6<br />
Figure 2.2 Consumption <strong>of</strong> natural gas by category <strong>of</strong> sectors..................................................7<br />
Figure 2.3 Total Installed Capacity by Type <strong>of</strong> Fuel.................................................................8<br />
Figure 2.4 Sector wise F<strong>in</strong>al Consumption <strong>of</strong> Commercial Energy ..........................................9<br />
Figure 2.5 Estimates <strong>of</strong> Energy Supplied by Traditional Fuels.................................................9<br />
Figure 2.6 Trend <strong>of</strong> growth <strong>of</strong> poultry birds <strong>in</strong> Bangladesh dur<strong>in</strong>g 2001-02 to 2005-06.......13<br />
Figure 2.7 Trend <strong>of</strong> growth <strong>of</strong> poultry farms <strong>in</strong> Bangladesh <strong>in</strong> different periods ...................13<br />
Figure 2.8 Geography <strong>of</strong> Gazipur District ...............................................................................15<br />
Figure 2.9 Upazillawise total number <strong>of</strong> poultry farm ............................................................18<br />
Figure 2.10 Upazillawise total number <strong>of</strong> poultry bird............................................................18<br />
Figure 2.11 Average number <strong>of</strong> bird <strong>in</strong> layer farm <strong>in</strong> different upazilla .................................19<br />
Figure 3.1 Sample distribution accord<strong>in</strong>g to upazilla and biogas plant...................................22<br />
Figure 4.1 Show<strong>in</strong>g different types <strong>of</strong> lamp ............................................................................28<br />
Figure 4.2 <strong>The</strong> percentage <strong>of</strong> poultry farms us<strong>in</strong>g different types <strong>of</strong> bulb ..............................28<br />
Figure 4.3 Show<strong>in</strong>g Fan...........................................................................................................29<br />
Figure 4.4 Duration <strong>of</strong> us<strong>in</strong>g fan <strong>in</strong> poultry farms...................................................................30<br />
Figure 4.5 Show<strong>in</strong>g the brooder...............................................................................................31<br />
Figure 4.6 Show<strong>in</strong>g Electric Pump and Hand Tube Well........................................................32<br />
Figure 4.7 <strong>The</strong> daily electricity consumption pattern <strong>in</strong> summer ............................................33<br />
Figure 4.8 <strong>The</strong> daily energy consumption pattern <strong>in</strong> w<strong>in</strong>ter....................................................33<br />
Figure 4.9 Duration <strong>of</strong> load shedd<strong>in</strong>g frequency .....................................................................34<br />
Figure 4.10 Percentage <strong>of</strong> back up system...............................................................................34<br />
Figure 4.11 Exist<strong>in</strong>g size <strong>of</strong> biogas plant as a percentage <strong>of</strong> total potential............................36<br />
Figure 4.12 Disposal <strong>of</strong> poultry dropp<strong>in</strong>gs ..............................................................................37<br />
Figure 5.1 Show<strong>in</strong>g different components <strong>of</strong> power plant at Bogra <strong>Poultry</strong> Complex ...........39<br />
Figure 5.2 Show<strong>in</strong>g different components <strong>of</strong> power plant at Bogra <strong>Poultry</strong> Complex ...........40<br />
Figure 5.3 Moisture filter and Generator set <strong>in</strong> Faridpur Muslim Mission .............................41<br />
Figure 5.4 Flow diagram <strong>of</strong> GTZ Flagship Project at Raj <strong>Poultry</strong> Farm.................................44<br />
Figure 5.5 Biogas plants <strong>in</strong> Raj <strong>Poultry</strong> Farm..........................................................................45<br />
Figure 5.6 Shows the H2S removal unit...................................................................................46<br />
Figure 5.7 Moisture removal unit ............................................................................................48<br />
viii
LIST OF FIGURE (Contd...)<br />
Title page<br />
Figure 5.8 Shows the generator and venturi ............................................................................49<br />
Figure 5.9 Flow diagram <strong>of</strong> produc<strong>in</strong>g electricity <strong>in</strong> the study area........................................50<br />
Figure 5.10 Different components <strong>of</strong> the plant........................................................................51<br />
Figure 6.1 Cost <strong>of</strong> bio gas plant...............................................................................................56<br />
Figure 6.2 NPV <strong>of</strong> different size <strong>of</strong> farms with different product for revenue under Scenario I<br />
.........................................................................................................................................61<br />
Figure 6.3 NPV <strong>of</strong> different size <strong>of</strong> farms with different product for revenue under Scenario II<br />
.........................................................................................................................................61<br />
Figure 6.4 IRR <strong>of</strong> different size <strong>of</strong> farms with different product for revenue under Scenario I<br />
.........................................................................................................................................62<br />
Figure 6.5 IRR <strong>of</strong> different size <strong>of</strong> farms with different product for revenue under Scenario II<br />
.........................................................................................................................................62<br />
Figure 6.6 IRR <strong>of</strong> different size <strong>of</strong> farms with cost digression <strong>of</strong> generators for Scenario I...65<br />
Figure 6.7 IRR <strong>of</strong> different size <strong>of</strong> farms with cost digression <strong>of</strong> generators for Scenario II .66<br />
Figure 6.8 IRR at different <strong>in</strong>vestment cost (1000 birds farm)................................................70<br />
Figure 6.9 IRR at different <strong>in</strong>vestment cost (1000 birds farm)................................................70<br />
Figure 6.10 NPV at different discount factor (3000 birds farm) .............................................72<br />
Figure 6.11 NPV at different discount factor (3000 birds farm) .............................................73<br />
ix
LIST OF UNITS<br />
1 Ton <strong>of</strong> coal equivalent = 0.695 Ton <strong>of</strong> oil equivalent<br />
1 Ton <strong>of</strong> coal equivalent = 27.55 ×10 6 British thermal unit<br />
1 MMSCF <strong>of</strong> natural gas = 172.3 barrels <strong>of</strong> crude oil equivalent<br />
1 MJ = 947.8171 British thermal unit<br />
1 GWh = 10 9 kWh<br />
1 kWh = 3.6 MJ<br />
1 HP = 0.746 kW<br />
1 MMCF = 28316.85 m³<br />
1 kgoe = 42 MJ = 11.63 kWh<br />
1 m 3 = 35.31 ft 3<br />
Currency conversion<br />
<strong>The</strong> exchange rate was considered at 68.50 BDT/ US$.<br />
Source: http://www.bangladesh-bank.org/econdata/exchangerate.php date:06.07.2007<br />
x
ACKNOWLEDGEMENT<br />
<strong>The</strong> author is grateful to express his s<strong>in</strong>cere gratitude to Deutscher Akademischer Austausch-<br />
Dienst (DAAD) for provid<strong>in</strong>g him an opportunity to pursue higher education <strong>in</strong> Germany.<br />
<strong>The</strong> author is also grateful to University <strong>of</strong> Flensburg, where he ga<strong>in</strong>ed <strong>in</strong>valuable academic<br />
knowledge dur<strong>in</strong>g sem<strong>in</strong>ar phase. In this connection, the author expresses his hearty gratitude<br />
to the pr<strong>of</strong>essors and lecturers who contributed a lot <strong>in</strong> the sem<strong>in</strong>ars. <strong>The</strong> author is gratified to<br />
express his deep s<strong>in</strong>cere thanks to Dipl.-Ing. Wulf Boie and Dr.Dieter W. Kle<strong>in</strong> for their<br />
valuable guidance and suggestion at different stages <strong>of</strong> this research. <strong>The</strong> author would like to<br />
express his gratitude to Pr<strong>of</strong>. Dr. M. A. Rashid Sarkar for supervis<strong>in</strong>g him dur<strong>in</strong>g the field<br />
research. <strong>The</strong>n his s<strong>in</strong>cere thanks go to Dr. Khursheed-Ul-Islam and Dr. M. Khaleq-uz-zaman<br />
<strong>of</strong> GTZ Bangladesh and Mr. M. A. G<strong>of</strong>ran <strong>of</strong> Grameen Shakti for support<strong>in</strong>g to carry out the<br />
field visit and provid<strong>in</strong>g relevant <strong>in</strong>formation <strong>of</strong> the study. <strong>The</strong> author also expresses his<br />
s<strong>in</strong>cere thanks to all the stakeholders <strong>of</strong> the study area for provid<strong>in</strong>g <strong>in</strong>formation regard<strong>in</strong>g<br />
this research. <strong>The</strong> author is also grateful to Titas Gas Transmission & Distribution Company<br />
Limited for giv<strong>in</strong>g the opportunity to pursue this study. At last but not least, the author<br />
expresses his s<strong>in</strong>cere thanks Ms. Khetsiwe Khumalo and Ms. Skadi Zscheile for their k<strong>in</strong>d<br />
cooperation.<br />
<strong>The</strong> Author<br />
xi
EXECUTIVE SUMMARY<br />
Introduction: <strong>The</strong> Per capita energy consumption <strong>in</strong> Bangladesh is 197 kg <strong>of</strong> oil equivalent<br />
(kgoe), which is far less than the averages for low <strong>in</strong>come (563 kgoe) countries 1 . Around<br />
33% (Hossa<strong>in</strong> and Tamim, 2005/2006, p. 16) <strong>of</strong> the total population is covered by electricity<br />
network and 4% (ibid, p. 13) are covered under natural gas network. About 40% <strong>of</strong> the total<br />
primary energy <strong>of</strong> the country comes <strong>from</strong> renewable energy, ma<strong>in</strong>ly biomass (Draft NEP,<br />
2006, p. 1). Biogas is one <strong>of</strong> the promis<strong>in</strong>g renewable energy sources <strong>in</strong> Bangladesh.<br />
Different sources <strong>of</strong> biogas <strong>in</strong> the country are cattle dung, poultry dropp<strong>in</strong>g, crop residue,<br />
kitchen waste etc. <strong>The</strong> country has a promis<strong>in</strong>g poultry <strong>in</strong>dustry to meet up the prote<strong>in</strong> need<br />
<strong>of</strong> the people. <strong>The</strong>re were about 130 thousand poultry farms <strong>in</strong> the country <strong>in</strong> 2005-2006 2 .<br />
<strong>The</strong> number <strong>of</strong> birds <strong>in</strong> poultry farms was about 194.82 million <strong>in</strong> 2005-2006 (ibid). <strong>The</strong>se<br />
poultry farms have a huge potential to produce biogas which can later be used to generate<br />
electricity. Recently, the government, non government organizations (NGO) and private<br />
entrepreneurs have <strong>in</strong>stalled small scale gas generators <strong>in</strong> some poultry farms to produce<br />
electricity. At the same time the poultry farms <strong>in</strong> the country are fac<strong>in</strong>g enormous power<br />
shortage every day which hampers the production <strong>of</strong> the <strong>in</strong>dustry. Dissem<strong>in</strong>ation <strong>of</strong> the<br />
technology could meet the poultry sector’s electricity demand as well as the need <strong>of</strong> adjacent<br />
households. This can reduce the burden on national electricity grid and contribute to the<br />
national economy as well.<br />
Objective: <strong>The</strong> ma<strong>in</strong> objective <strong>of</strong> the study was to identify the economic potential <strong>of</strong><br />
electricity generation <strong>from</strong> poultry waste <strong>in</strong> commercial poultry sector <strong>in</strong> Bangladesh.<br />
Methodology: <strong>The</strong> study was carried out as a case study <strong>in</strong> Gazipur district <strong>of</strong> Bangladesh<br />
dur<strong>in</strong>g April 2007 to June 2007. Data was collected by <strong>in</strong>terview<strong>in</strong>g poultry farmers with<br />
structured questionnaire, visit<strong>in</strong>g poultry farms, discussions and <strong>in</strong>terviews with key<br />
personnel and visit<strong>in</strong>g different concerned <strong>in</strong>stitutions. All the quantitative data was analyzed<br />
us<strong>in</strong>g Micros<strong>of</strong>t excel. To f<strong>in</strong>d out the m<strong>in</strong>imum size <strong>of</strong> poultry farm f<strong>in</strong>ancial analysis was<br />
done for different size <strong>of</strong> poultry farms. For f<strong>in</strong>ancial analysis, the technology used <strong>in</strong> GTZ<br />
flagship project at Raj <strong>Poultry</strong> Farm <strong>in</strong> Faridpur district was considered. Two different<br />
scenarios were considered <strong>in</strong> the analysis based on the time duration for which the poultry<br />
1<br />
http://www.acdis.uiuc.edu/Research/OPs/Samr<strong>in</strong>a/contents/part1.html, pr<strong>in</strong>ted on 18.08.2007<br />
2<br />
Data provided by Mr. A. S. Md. Abdul Hannan, Scientific Officer, Department <strong>of</strong> Livestock Services (DLS),<br />
Dhaka-1215, Bangladesh, 17.05.2007<br />
xii
farms can produce electricity. Scenario I considered electricity production for five hours <strong>in</strong><br />
the country peak hour while Scenario II considered electricity production for twelve hours,<br />
which is the total daily consumption <strong>of</strong> the poultry farms. Four different cases were<br />
considered under each scenario. <strong>The</strong> first case considered only electricity as a product to earn<br />
revenue, while the second case considered cost <strong>of</strong> CO2 and cost <strong>of</strong> electricity as revenue<br />
earn<strong>in</strong>g products. Third case considered the cost <strong>of</strong> fertilizer and cost <strong>of</strong> electricity as<br />
products to earn revenue and lastly, the fourth case considered CO2, fertilizer and electricity<br />
all together as revenue earn<strong>in</strong>g products. All these cases were considered under each scenario<br />
to f<strong>in</strong>d out the m<strong>in</strong>imum sizes <strong>of</strong> poultry farm. <strong>The</strong>n the potential <strong>of</strong> electricity production for<br />
different cases under different scenarios were estimated on the basis <strong>of</strong> sample data <strong>in</strong> the<br />
study area.<br />
Energy Consumption Status <strong>in</strong> <strong>Poultry</strong> Farms: <strong>Electricity</strong> is <strong>in</strong>evitable for the production<br />
<strong>of</strong> eggs and for the growth <strong>of</strong> the birds as well. <strong>Electricity</strong> is used <strong>in</strong> the <strong>in</strong>dustry ma<strong>in</strong>ly by<br />
lamps to provide proper light<strong>in</strong>g <strong>in</strong> the poultry shed, fans to ma<strong>in</strong>ta<strong>in</strong> the required<br />
temperature, brooder to brood up the chicks and the water pumps to supply water.<br />
<strong>The</strong> daily electricity consumption <strong>of</strong> poultry farms usually starts at about 10 am <strong>in</strong> the<br />
morn<strong>in</strong>g and cont<strong>in</strong>ues till 10 pm <strong>in</strong> the even<strong>in</strong>g. 100% poultry farms experience load<br />
shedd<strong>in</strong>g for about 4 hours a day mostly <strong>in</strong> the even<strong>in</strong>g. Only 30% <strong>of</strong> the farms have backup<br />
system to face power cut whereas the rest 70% does not have any back up system.<br />
Biogas produced <strong>in</strong> different poultry farms is used ma<strong>in</strong>ly for household cook<strong>in</strong>g. Very few<br />
poultry farms <strong>in</strong> Gazipur district and as well as <strong>in</strong> the country use biogas both for thermal<br />
purpose and produc<strong>in</strong>g electricity. About 38% farms can sell their biogas to at least one<br />
customer and the rest 62% does not have any market to sell it. So production <strong>of</strong> electricity<br />
could be an option to utilize the biogas properly. Only 8% <strong>of</strong> the farms use slurry as fertilizer,<br />
whereas the rest 92% does not use it as fertilizer due to lack <strong>of</strong> awareness <strong>of</strong> the farmers<br />
about the benefit <strong>of</strong> us<strong>in</strong>g it. At the same time, the exist<strong>in</strong>g law does not permit farmers to sell<br />
slurry without patent. Currently there is no market for slurry. However, few large farms sell<br />
slurry as fertilizer with patent.<br />
Present Status <strong>of</strong> <strong>Electricity</strong> <strong>Generation</strong> <strong>from</strong> <strong>Poultry</strong> <strong>Waste</strong>: <strong>Electricity</strong> production <strong>from</strong><br />
poultry waste is relatively new <strong>in</strong> Bangladesh. Different types <strong>of</strong> technologies are be<strong>in</strong>g used<br />
<strong>in</strong> different poultry farms <strong>in</strong> the country. <strong>The</strong> most common one is to use natural gas<br />
generator which uses biogas as fuel. Most <strong>of</strong> the farms which are produc<strong>in</strong>g electricity <strong>from</strong><br />
poultry waste do not have any H2S removal unit. H2S is severely corrosive to all metals<br />
xiii
associated with the transportation <strong>of</strong> gas and metal parts <strong>of</strong> eng<strong>in</strong>e which is driven by such<br />
gas conta<strong>in</strong><strong>in</strong>g H2S. To overcome these problems associated with H2S, GTZ Bangladesh has<br />
<strong>in</strong>stalled a flagship project at Raj <strong>Poultry</strong> Farm <strong>in</strong> Faridpur district which is more scientific<br />
than any other technology be<strong>in</strong>g used <strong>in</strong> the currently.<br />
F<strong>in</strong>ancial Analysis: On the basis <strong>of</strong> different assumption NPV, IRR and Payback Period<br />
were calculated for poultry farms with the sizes <strong>of</strong> 500, 1000, 2000, 3000, 4000, 5000, 6000,<br />
7000, 8000, 9000, 10000, 15000, 20000 and 50000 birds. <strong>The</strong> discount rate was considered at<br />
8% and the life <strong>of</strong> the project was considered 20 years. NPV, IRR and Payback Period were<br />
calculated for each size <strong>of</strong> poultry farms under both Scenarios I & II for four different cases.<br />
<strong>The</strong> calculation was done to f<strong>in</strong>d out the m<strong>in</strong>imum sizes <strong>of</strong> poultry farms which could<br />
produce electricity with f<strong>in</strong>ancial viability.<br />
It was found that poultry farms rang<strong>in</strong>g <strong>from</strong> 500 birds to 50000 birds all face negative NPV<br />
and lower IRR than the discount rate and very high payback period <strong>in</strong> the case when only<br />
electricity is considered as a product to earn revenue. In addition <strong>of</strong> CO2 cost with electricity<br />
cost can not make any size <strong>of</strong> poultry farm f<strong>in</strong>ancially viable <strong>in</strong> Scenario I where electricity is<br />
produced for five hours a day. On the other hand <strong>in</strong> Scenario II where electricity is produced<br />
for twelve hours a day, <strong>in</strong> addition <strong>of</strong> CO2 cost with electricity cost makes the farms<br />
f<strong>in</strong>ancially viable with a capacity <strong>of</strong> 6000 birds and above. In addition <strong>of</strong> fertilizer cost <strong>in</strong><br />
stead <strong>of</strong> CO2 cost with electricity cost, makes the farms f<strong>in</strong>ancially viable with the capacity <strong>of</strong><br />
1000 birds and above. In this case NPV was found positive, IRR is higher than the discount<br />
rate and pay back period is much lower than the project life. F<strong>in</strong>ally, the addition <strong>of</strong> CO2 cost<br />
with fertilizer and electricity cost also makes viable the farms with the capacity rang<strong>in</strong>g <strong>from</strong><br />
1000 birds and above. However, for the farm with capacity <strong>of</strong> 500 birds, it was found that<br />
NPV is negative and IRR is lower than the discount rate for even consider<strong>in</strong>g CO2, fertilizer<br />
and electricity all together as product to earn revenue.<br />
Estimate <strong>of</strong> Total <strong>Potential</strong>: <strong>The</strong>re is no economic potential <strong>in</strong> the study area as well as <strong>in</strong><br />
the country to produce electricity <strong>from</strong> poultry waste <strong>in</strong> this case if only electricity is<br />
considered as a product to earn revenue. <strong>The</strong> estimated potential to produce electricity is<br />
about 13 GWh <strong>in</strong> Gazipur district and 135 GWh <strong>in</strong> the country per year when CO2 cost is<br />
added with electricity cost provided electricity is produced for twelve hours a day for the total<br />
daily consumption <strong>of</strong> the farm. However, there is no economic potential if the electricity is<br />
produced for five hours a day only dur<strong>in</strong>g the country peak. <strong>The</strong> maximum estimated<br />
potential to produce electricity for Gazipur district and the country is 34 GWh/year and 360<br />
xiv
GWh/year respectively provided fertilizer cost is added with electricity cost irrespective <strong>of</strong><br />
numbers <strong>of</strong> hours <strong>of</strong> electricity generation.<br />
Conclusion: <strong>The</strong>re is a potential to produce electricity <strong>from</strong> poultry waste and there is high<br />
<strong>in</strong>terest <strong>from</strong> farmers to produce the electricity. This <strong>in</strong>terest has come due to the fact that all<br />
the poultry farms experience load shedd<strong>in</strong>g through out the day mostly <strong>in</strong> the even<strong>in</strong>g which<br />
hampers the production <strong>of</strong> the farm. <strong>Electricity</strong> can be produced <strong>from</strong> poultry waste for the<br />
total daily consumption <strong>of</strong> most <strong>of</strong> the poultry farms and <strong>in</strong> addition electricity can also be<br />
produced for the peak hour only to save farms <strong>from</strong> be<strong>in</strong>g cut <strong>of</strong>f. <strong>Electricity</strong> generation for<br />
12 hours through out the day is more f<strong>in</strong>ancially feasible than produc<strong>in</strong>g electricity for 5<br />
hours dur<strong>in</strong>g peak hour. However, only electricity as a product to earn revenue <strong>in</strong> not enough<br />
to make the poultry farms f<strong>in</strong>ancially viable to produce electricity. Fertilizer is the most vital<br />
element as a product to earn revenue with electricity to make poultry farms f<strong>in</strong>ancially<br />
feasible to produce electricity. <strong>The</strong>refore, to harness the energy <strong>from</strong> poultry waste <strong>in</strong> the<br />
national energy mix the amendment <strong>of</strong> exist<strong>in</strong>g law is required to elim<strong>in</strong>ate the bureaucratic<br />
obstacles and awareness rais<strong>in</strong>g is required among the people regard<strong>in</strong>g the benefit <strong>of</strong> slurry<br />
as fertilizer to create the market for slurry.<br />
xv
ZUSAMMENFASSUNG (Summary <strong>in</strong> German)<br />
E<strong>in</strong>leitung. Der Pro-Kopf-Energieverbrauch <strong>in</strong> Bangladesch beträgt 197 kgoe, was<br />
wesentlich unter dem Durchschnitt der e<strong>in</strong>kommensschwachen Länder liegt. Rund 33% der<br />
Gesamtbevölkerung s<strong>in</strong>d an das Stromnetz angeschlossen, 4% werden durch Erdgas versorgt.<br />
Etwa 40% der gesamten Primärenergie des Landes wird durch erneuerbare Energien<br />
gewonnen, überwiegend Biomasse. E<strong>in</strong>e der erfolgsversprechenden Quellen im Bereich der<br />
erneuerbaren Energien <strong>in</strong> Bangladesch ist Biogas. Zu den verschiedenen Biogasquellen des<br />
Landes gehören Kuhdung, Geflügeldung, Getreideabfälle, Küchenabfälle etc. Das Land<br />
besitzt e<strong>in</strong>e vielversprechende Geflügel<strong>in</strong>dustrie, die den Prote<strong>in</strong>bedarf der Menschen decken<br />
soll. In den Jahren 2005 bis 2006 gab es rund 130.000 Geflügelfarmen im Land. Die Anzahl<br />
der Vögel auf den Geflügelfarmen betrug dabei rund 194,82 Millionen. Diese<br />
Geflügelfarmen besitzen e<strong>in</strong> sehr großes <strong>Potential</strong>, Biogas zu produzieren, welches später zur<br />
Sromerzeugung verwendet werden kann. Kürzlich haben die Regierung,<br />
regierungsunabhängige Organisationen und private Unternehmer Kle<strong>in</strong>gasgeneratoren <strong>in</strong><br />
e<strong>in</strong>igen Geflügelfarmen angebracht, um Strom zu erzeugen. Gleichzeitig s<strong>in</strong>d die<br />
Geflügelfarmen im Land täglich Energieengpässen ausgesetzt, was die Produktion hemmt.<br />
Die Verbreitung der Technologie könnte den Elektrizitätsbedarf im Bereich der<br />
Geflügelzucht sowie den Bedarf der angrenzenden Haushalte befriedigen. Dies kann dann die<br />
Belastung auf das nationale Stromnetz verr<strong>in</strong>gern und e<strong>in</strong>en Beitrag zur Volkswirtschaft<br />
leisten.<br />
Ziel der Studie. Das Hauptziel der Studie war, das wirtschaftliche <strong>Potential</strong> der<br />
Stromerzeugung mittels Geflügeldung im kommerziellen Geflügelbereich <strong>in</strong> Bangladesch zu<br />
bestimmen.<br />
Methodik. Die Studie wurde als Fallstudie im Gazipur Bezirk von Bangladesch von April bis<br />
Juni 2007 durchgeführt. Daten wurden gesammelt, <strong>in</strong>dem Geflügellandwirte mit<br />
strukturiertem Fragebögen befragt und Geflügelfarmen besichtigt wurden. Außerdem wurden<br />
Diskussionen und Interviews mit Schlüsselpersonal geführt und unterschiedliche beteiligte<br />
E<strong>in</strong>richtungen besichtigt. Alle quantitativen Daten wurden mit Hilfe von Micros<strong>of</strong>t Excel<br />
analysiert. Um die m<strong>in</strong>imale Größe e<strong>in</strong>er Geflügelfarm zu bestimmen, wurde e<strong>in</strong>e f<strong>in</strong>anzielle<br />
Analyse für Geflügelfarmen mit unterschiedlicher Größe durchgeführt. Für die f<strong>in</strong>anzielle<br />
Analyse wurde die Technologie, die im GTZ Flaggschiffprojekt auf Raj Geflügelfarm im<br />
Faridpur Bezirk verwendet wurde, <strong>in</strong> Betracht gezogen. Bei der Analyse wurden zwei<br />
xvi
unterschiedliche Szenarien berücksichtigt, die darauf basierten, <strong>in</strong> welcher Zeitspanne die<br />
Geflügelfarmen Strom produzieren können. Szenario I betrachtete die Stromerzeugung fünf<br />
Stunden lang <strong>in</strong> der Spitzenzeit des Landes, während Szenario II die Stromerzeugung zwölf<br />
Stunden lang betrachtete, was dem Gesamttagesverbrauch der Geflügelfarmen entspricht.<br />
Vier unterschiedliche Fälle wurden jeweils bei den Szenarien betrachtet. Beim ersten Fall<br />
wurde Strom nur als e<strong>in</strong> Produkt betrachtet, um E<strong>in</strong>nahmen zu erzielen, während beim<br />
zweiten Fall Kosten für CO2 und die Kosten für Strom als E<strong>in</strong>nahmequellen betrachtet<br />
wurden. Beim dritten Fall wurden die Kosten für Düngemittel und die Kosten für Elektrizität<br />
als E<strong>in</strong>nahmequellen betrachtet. Beim vierten Fall schließlich wurden CO2, Düngemittel und<br />
Strom zusammen als gew<strong>in</strong>nbr<strong>in</strong>gende Produkte angesehen. Alle Fälle wurden unter jedem<br />
Szenario betrachtet, um die m<strong>in</strong>imale Größe e<strong>in</strong>er Geflügelfarm zu ermitteln. Dann wurde<br />
das <strong>Potential</strong> der Stromgew<strong>in</strong>nung, auf der Grundlage von Beispieldaten im Studiengebiet,<br />
für unterschiedliche Fälle unter unterschiedlichen Szenarien geschätzt.<br />
Status des Stromverbrauchs auf Geflügelfarmen. Elektrizität ist für die Produktion der<br />
Eier und für das Wachstum der Vögel unabd<strong>in</strong>gbar. Elektrizität wird <strong>in</strong> der Industrie<br />
hauptsächlich für Lampen verwendet, um korrekte Beleuchtung <strong>in</strong> der Geflügelhalle zu<br />
erzeugen, für Ventilatoren, um die erforderliche Temperatur zu gewährleisten, im Brutkasten,<br />
um die Küken zu brüten und für die Wasserpumpen, die das Wasser liefern. Der tägliche<br />
Stromverbrauch der Geflügelfarmen beg<strong>in</strong>nt gewöhnlich 10 Uhr morgens und setzt sich bis<br />
10 Uhr abends fort. 100% der Geflügelfarmen haben e<strong>in</strong>en Lastabwurf von ca. 4 Stunden pro<br />
Tag, meistens am Abend. Nur 30% der Farmen haben e<strong>in</strong>e Ausweichanlage für den Fall e<strong>in</strong>es<br />
Stromausfalls, die restlichen 70% verfügen über ke<strong>in</strong>erlei Sicherungssystem. Biogas, das auf<br />
den unterschiedlichen Geflügelfarmen produziert wird, wird hauptsächlich für das Kochen im<br />
Haushalt verwendet. Nur e<strong>in</strong>e sehr ger<strong>in</strong>e Anzahl von Geflügelfarmen im Gazipur Bezirk<br />
sowie im gesamten Land benutzt Biogas sowohl für Wärmeerzeugung als auch zur<br />
Stromerzeugung. Ungefähr 38% der Farmen können ihr Biogas an m<strong>in</strong>destens e<strong>in</strong>en Kunden<br />
verkaufen, der Rest von 62% hat ke<strong>in</strong>en Markt, um es zu verkaufen. Daher könnte die<br />
Erzeugung von Strom e<strong>in</strong>e Methode se<strong>in</strong>, das Biogas <strong>in</strong> geeigneter Weise zu verwenden.<br />
Nur auf 8% der Farmen wird Flüssigmist als Düngemittel benutzt, während die restlichen<br />
92% der Landwirte Flüssigmist nicht als Düngemittel verwenden, da ihnen das Wissen über<br />
den Nutzen fehlt. Gleichzeitig verbietet das geltende Recht den Landwirten, den Flüssigmist<br />
ohne Patent zu verkaufen. Z.Z. gibt es daher ke<strong>in</strong>en Markt für Flüssigmist. Jedoch verkaufen<br />
wenige große Farmen Flüssigmist als Düngemittel mit Patent.<br />
xvii
Gegenwärtiger Status der Stromerzeugung durch Geflügeldung. Stromerzeugung ist<br />
relativ neu <strong>in</strong> Bangladesch. In den unterschiedlichen Geflügelfarmen des Landes werden<br />
verschiedene Technologien verwendet. Die gebräuchlichste ist die Verwendung e<strong>in</strong>es<br />
Erdgasgenerators, der Biogas als Treibst<strong>of</strong>f verwendet. Die meisten Farmen, die Strom durch<br />
Geflügeldung gew<strong>in</strong>nen, haben ke<strong>in</strong>e H2S-Abfuhr. H2S ist gegenüber allen Metallen streng<br />
ätzend, die mit dem Transport der Gas- und Metallteile e<strong>in</strong>er Masch<strong>in</strong>e verbunden s<strong>in</strong>d, die<br />
durch e<strong>in</strong> solches Gas, das H2S enthält, angetrieben wird. Um die mit H2S verbundenen<br />
Probleme zu überw<strong>in</strong>den, hat GTZ Bangladesch e<strong>in</strong> Flaggschiffprojekt auf der Raj Geflügel-<br />
Farm im Faridpur Bezirk <strong>in</strong>s Leben gerufen, das wissenschaftlicher ist als jede mögliche<br />
andere Technologie, die z.Z. verwendet wird.<br />
F<strong>in</strong>azielle Analyse. Auf der Grundlage von unterschiedliche Annahmen, wurden NPV, IRR<br />
und Amortisationsdauer für Geflügelfarmen mit den Größen von 500, 1000, 2000, 3000,<br />
4000, 5000, 6000, 7000, 8000, 9000, 10000, 15000, 20000 und 50000 Vögeln errechnet. Der<br />
Diskontsatz wurde bei 8% betrachtet und die Lebensdauer des Projektes wurde auf 20 Jahre<br />
festgesetzt. NPV, IRR und Amortisationsdauer wurden für jede Größe von Geflügelfarmen<br />
unter den Szenarien I und II für vier unterschiedliche Fälle errechnet. Die Berechnung wurde<br />
durchgeführt, um die m<strong>in</strong>imale Größe für Geflügelfarmen, die Elektrizität mit f<strong>in</strong>anzieller<br />
Rentabilität erzeugen können, herauszuf<strong>in</strong>den. Es wurde festgestellt, dass Geflügelfarmen,<br />
mit 500 Vögeln bis zu 50.000 Vögeln alle e<strong>in</strong>em negativen NPV und niedrigeren IRR<br />
gegenüberstehen, als der Diskontsatz sowie e<strong>in</strong>e sehr hohe Amortisationsdauer <strong>in</strong> dem Falle,<br />
dass Elektrizität als alle<strong>in</strong>ige E<strong>in</strong>kommensquellle angesehen wird. Auch wenn es CO2– und<br />
Elektrizitätse<strong>in</strong>nahmen gibt, ist nicht jede Größe von Geflügelfarmen f<strong>in</strong>anziell<br />
kostendeckend, wie im Szenario I, wo täglich 5 Stunden Elektrizität pro Tag erzeugt wird. Im<br />
Szenario II h<strong>in</strong>gegen, wo Elektrizität für zwölf Stunden pro Tag produziert wird, s<strong>in</strong>d die<br />
Farmen dann f<strong>in</strong>anziell kostendeckend, wenn Sie e<strong>in</strong>e Kapazität von 6000 Vögeln und mehr<br />
aufweisen. Werden anstelle des CO2 Gew<strong>in</strong>ne durch Düngemittel und Strom erzielt, muss mit<br />
m<strong>in</strong>destens 1000 Vögeln und mehr gewirtschaftet werden. In diesem Fall konnte das NPV als<br />
positiv erachtet werden; das IRR ist höher als der Diskontsatz und der Rückzahlungszeitraum<br />
ist wesentlich ger<strong>in</strong>ger als die Projektlebensdauer. Letztendlich arbeiten Farmen, die CO2 –,<br />
Düngemittel- und Elektrizitätse<strong>in</strong>nahmen haben dann kostendeckend, wenn Sie e<strong>in</strong>e<br />
Kapazität von 1000 Vögeln und mehr haben. Bei Farmen, die e<strong>in</strong>e Kapazität von 500 Vögeln<br />
haben, ist der NPV jedoch negativ und das IRR ger<strong>in</strong>ger als der Diskontsatz, selbst wenn man<br />
das CO2, Düngemittel und Elektrizität als E<strong>in</strong>nahmequellen betrachtet.<br />
xviii
Es besteht ke<strong>in</strong> wirtschaftliches <strong>Potential</strong>, sowohl im Studiengebiet als auch im Rest des<br />
Landes, um Elektrizität durch Geflügeldung zu erzeugen, wenn nur die daraus resultierende<br />
Stromerzeugung als E<strong>in</strong>kommensquelle dient. Das geschätzte <strong>Potential</strong> der<br />
Elektrizitätserzeugung entspricht etwa 13 GWh im Gazipur Bereich und 135 GWh im<br />
gesamten Land pro Jahr, wenn die CO2--E<strong>in</strong>nahmen zu den Elektrizitätse<strong>in</strong>nahmen<br />
dazugerechnet werden. Dabei wird vorausgesetzt, dass 12 Stunden/Tag für den<br />
Gesamtverbrauch der Farm produziert wird.<br />
Wenn jedoch nur 5 Stunden/Tag Energie während der Spitzendstunden des Landes erzeugt<br />
wird, besteht ke<strong>in</strong> wirtschaftliches <strong>Potential</strong>. Das geschätzte maximale <strong>Potential</strong> der<br />
Elektrizitätserzeugung im Gazipur Bereich entspricht 34 GWh/Jahr und 360 GWh im<br />
gesamten Land pro Jahr, wenn entsprechend die E<strong>in</strong>nahmen für Düngemittel zu den<br />
Elektrizitätse<strong>in</strong>nahmen dazugerechnet werden, unabhängig von der Stundenanzahl der<br />
Stromerzeugung.<br />
Fazit. Elektrizität aus Geflügeldung zu gew<strong>in</strong>nen, stellt e<strong>in</strong> <strong>Potential</strong> dar. Seitens der<br />
Landwirte besteht e<strong>in</strong> hohes Interesse an dieser Form der Stromerzeugung. Dieses Interesse<br />
besteht aufgrund der Tatsache, daß alle Geflügelfarmen während des Tages, meistens am<br />
Abend, e<strong>in</strong>en Lastabwurf haben, was die Produktion der Farm hemmt. Die gewonnene<br />
Elektrizität aus Geflügeldung kann den Gesamttagesverbrauch der meisten Geflügelfarmen<br />
decken. Zusätzlich kann Elektrizität auch nur für die Spitzenzeiten produziert werden, was<br />
die Farmen vor e<strong>in</strong>em Stromausfall bewahrt. Die Stromerzeugung für zwölf Stunden pro Tag<br />
ist f<strong>in</strong>anziell kostengünstiger, als die Stromerzeugung für 5 Stunden während der<br />
Spitzenzeiten. Allerd<strong>in</strong>gs wirtschaften die Farmen nicht kostendeckend, wenn der gewonnene<br />
Strom die e<strong>in</strong>zige E<strong>in</strong>nahmequelle darstellt. Düngemittel ist das wichtigste Element, damit<br />
mit der Stromerzeugung E<strong>in</strong>nahmen erzielt werden können, denn nur so können die Farmen<br />
die Kosten, die mit der Stromgew<strong>in</strong>nung e<strong>in</strong>hergehen, decken. Um die Stromgew<strong>in</strong>nung<br />
durch Geflügeldung <strong>in</strong> den nationalen Energiemix e<strong>in</strong>zubr<strong>in</strong>gen, ist e<strong>in</strong>e Änderung des<br />
vorhandenen Gesetzes notwendig, die daraus besteht, die bürokratischen H<strong>in</strong>dernisse zu<br />
beseitigen. Außerdem muss den Menschen bewusst gemacht werden, dass Flüssigmist als<br />
Düngemittel verwendet werden kann. So kann e<strong>in</strong> Markt für dieses Produkt geschafft werden.<br />
xix
1.1 Background<br />
CHAPTER 1 INTRODUCTION<br />
<strong>The</strong> Per capita energy consumption <strong>in</strong> Bangladesh is 197 kg <strong>of</strong> oil equivalent (kgoe), which is<br />
far less than the averages for low <strong>in</strong>come (563 kgoe) countries 3 . Around 33% (Hossa<strong>in</strong> and<br />
Tamim, 2005/2006, p. 16) <strong>of</strong> the total population is covered by electricity network and 4%<br />
(ibid, p. 13) are covered under natural gas network. About 82% <strong>of</strong> total electricity comes<br />
<strong>from</strong> natural gas 4 . Lack <strong>of</strong> energy is the ma<strong>in</strong> h<strong>in</strong>der<strong>in</strong>g force for poverty alleviation. On the<br />
other hand the reserves <strong>of</strong> natural gas are runn<strong>in</strong>g out. To make the energy system <strong>of</strong> the<br />
country susta<strong>in</strong>able, search<strong>in</strong>g for alternative sources <strong>of</strong> energy is mandatory.<br />
Biogas is one <strong>of</strong> the promis<strong>in</strong>g renewable energy sources <strong>in</strong> Bangladesh. Different sources <strong>of</strong><br />
biogas <strong>in</strong> the country are cattle dung, poultry dropp<strong>in</strong>g, crop residue, kitchen waste etc.<br />
Bangladesh has a promis<strong>in</strong>g poultry <strong>in</strong>dustry to meet up the prote<strong>in</strong> need <strong>of</strong> the people.<br />
Commercial poultry farms <strong>in</strong> Bangladesh are grow<strong>in</strong>g at a rate <strong>of</strong> 7% per year s<strong>in</strong>ce 2001-<br />
2002 5 and the number <strong>of</strong> birds <strong>in</strong> the poultry farms is grow<strong>in</strong>g at 5.59% per year s<strong>in</strong>ce 2000-<br />
2001 (ibid). <strong>The</strong>re were about 130 thousand poultry farms <strong>in</strong> the country <strong>in</strong> 2005-2006 6 . <strong>The</strong><br />
number <strong>of</strong> birds <strong>in</strong> poultry farms was about 194.82 million <strong>in</strong> 2005-2006 (ibid). <strong>The</strong>oretically<br />
<strong>from</strong> these poultry farms about 19482 tonnes <strong>of</strong> chicken’s dropp<strong>in</strong>gs can be produced every<br />
day. <strong>The</strong>re are two types <strong>of</strong> poultry farms <strong>in</strong> the country and these are; layer farms and broiler<br />
farms. <strong>The</strong> dropp<strong>in</strong>gs <strong>from</strong> broiler farms are not used for biogas generation <strong>in</strong> the country due<br />
to the nature <strong>of</strong> rear<strong>in</strong>g the broiler birds which produces dropp<strong>in</strong>gs <strong>in</strong> batch not cont<strong>in</strong>uous.<br />
However, the dropp<strong>in</strong>gs <strong>from</strong> broiler farms can be used to produce electricity by <strong>in</strong>c<strong>in</strong>eration<br />
technology. Biogas can be produced <strong>from</strong> the layer poultry dropp<strong>in</strong>gs through digester<br />
technology. <strong>The</strong> total amount <strong>of</strong> biogas that can be produced <strong>from</strong> poultry dropp<strong>in</strong>g <strong>in</strong> the<br />
country is about 753046 m 3 per day 7 . At present, biogas is used mostly for thermal purposes<br />
especially for household cook<strong>in</strong>g and very few for electricity production. <strong>The</strong> total amount <strong>of</strong><br />
3<br />
http://www.acdis.uiuc.edu/Research/OPs/Samr<strong>in</strong>a/contents/part1.html, pr<strong>in</strong>ted on 18.08.2007<br />
4<br />
http://www.bpdb.gov.bd/<strong>in</strong>stalled_fuel.htm, pr<strong>in</strong>ted on 20.08.2007<br />
5<br />
own calculation based on data provided by Mr. A. S. Md. Abdul Hannan, Scientific Officer, Department <strong>of</strong><br />
Livestock Services (DLS), Dhaka-1215, Bangladesh, 17.05.2007<br />
6<br />
Data provided by Mr. A. S. Md. Abdul Hannan, Scientific Officer, Department <strong>of</strong> Livestock Services (DLS),<br />
Dhaka-1215, Bangladesh, 17.05.2007<br />
7<br />
own calculation based on data provided by Mr. A. S. Md. Abdul Hannan, Scientific Officer, Department <strong>of</strong><br />
Livestock Services (DLS), Dhaka-1215, Bangladesh, 17.05.2007 and data provided by Mr. Md. Kafiludd<strong>in</strong><br />
Bhuyan, District Livestock Officer, Gazipur, 13.05.2007<br />
1
electricity that could be produced <strong>from</strong> the poultry farms through digester technology is about<br />
1000 MWh per day (ibid).<br />
Recently, the government, non government organizations and private entrepreneurs have<br />
<strong>in</strong>stalled small scale gas generators <strong>in</strong> some poultry farms to produce electricity. For<br />
example, Local Government Eng<strong>in</strong>eer<strong>in</strong>g Department (LGED) <strong>of</strong> Bangladesh has <strong>in</strong>stalled an<br />
electricity generation unit <strong>from</strong> poultry waste at Faridpur Muslim Mission which serves the<br />
farm’s own electricity demand dur<strong>in</strong>g power cut. On the other hand, Bogra <strong>Poultry</strong> Complex<br />
itself has <strong>in</strong>stalled a system to produce electricity <strong>from</strong> poultry waste to meet the farms own<br />
electricity demand through out the day. <strong>The</strong> biogas produced <strong>from</strong> the poultry waste is us<strong>in</strong>g<br />
to generate electricity mostly by natural gas generator.<br />
<strong>The</strong> poultry farms <strong>in</strong> the country are fac<strong>in</strong>g enormous power shortage every day which<br />
hampers the production <strong>of</strong> the <strong>in</strong>dustry. Dissem<strong>in</strong>ation <strong>of</strong> the technology could meet the<br />
poultry sector’s electricity demand as well as the need <strong>of</strong> adjacent households. This can<br />
reduce the burden on national electricity grid and contribute to the national economy as well.<br />
1.2 Objective <strong>of</strong> the Study<br />
<strong>The</strong> ma<strong>in</strong> objective <strong>of</strong> the study is to identify the economic potential <strong>of</strong> electricity generation<br />
<strong>from</strong> poultry waste <strong>in</strong> commercial poultry sector <strong>in</strong> Bangladesh.<br />
Specific objective:<br />
1. To estimate the amount <strong>of</strong> electricity which can be produced if only electricity is<br />
considered as a product to earn revenue under different scenarios.<br />
2. To estimate the amount <strong>of</strong> electricity which can be produced if CO2 and electricity are<br />
considered as a product to earn revenue under different scenarios.<br />
3. To estimate the amount <strong>of</strong> electricity which can be produced if fertilizer and<br />
electricity are considered as a product to earn revenue under different scenarios?<br />
4. To estimate the amount <strong>of</strong> electricity which can be produced if CO2, fertilizer and<br />
electricity are considered as a product to earn revenue under different scenarios.<br />
2
1.3 Research Question<br />
To satisfy the above specific objectives, the study <strong>in</strong>tends to <strong>in</strong>vestigate the follow<strong>in</strong>g<br />
research questions;<br />
1. What is the energy consumption pattern and energy needs <strong>in</strong> poultry farms?<br />
2. What k<strong>in</strong>d <strong>of</strong> technology is presently used to produce electricity <strong>from</strong> poultry waste <strong>in</strong><br />
the country?<br />
<strong>The</strong> above two questions correspond to all the specific objectives.<br />
3. What is the m<strong>in</strong>imum poultry farm size that is economically viable to produce<br />
electricity if only electricity is considered as a product to earn revenue under different<br />
scenarios?<br />
<strong>The</strong> above question corresponds to the first specific objective.<br />
4. What is the m<strong>in</strong>imum poultry farm size that is economically viable to produce<br />
electricity if CO2 and electricity is considered as a product to earn revenue under<br />
different scenarios?<br />
<strong>The</strong> above question corresponds to the second specific objective.<br />
5. What is the m<strong>in</strong>imum poultry farm size that is economically viable to produce<br />
electricity if fertilizer and electricity is considered as a product to earn revenue under<br />
different scenarios?<br />
<strong>The</strong> above question corresponds to the third specific objective.<br />
6. What is the m<strong>in</strong>imum poultry farm size that is economically viable to produce<br />
electricity if CO2, fertilizer and electricity are considered as a product to earn revenue<br />
under different scenarios?<br />
<strong>The</strong> above question corresponds to the fourth specific objective.<br />
1.4 Research Hypothesis:<br />
1. <strong>Poultry</strong> waste <strong>in</strong> commercial poultry sector as a source <strong>of</strong> biogas has substantial<br />
potential for electricity generation.<br />
2. Produc<strong>in</strong>g electricity <strong>from</strong> poultry waste <strong>of</strong> commercial poultry sector as a source <strong>of</strong><br />
biogas is economically feasible.<br />
3
1.5 Significance <strong>of</strong> the Study:<br />
Bangladesh is one <strong>of</strong> the least developed countries <strong>in</strong> the world and energy poverty is the<br />
ma<strong>in</strong> h<strong>in</strong>drance for poverty alleviation <strong>in</strong> the country. This study will give the policy makers<br />
a new direction to a more susta<strong>in</strong>able energy source which can reduce the energy crisis <strong>of</strong> the<br />
country significantly. This will help to reduce the dependency on fossil fuel to meet up the<br />
energy demand <strong>of</strong> the country. <strong>The</strong> study looks <strong>in</strong>to the present status <strong>of</strong> energy consumption<br />
<strong>in</strong> different poultry farms which will give the people concerned an idea to f<strong>in</strong>d a way to<br />
reduce the energy consumption <strong>in</strong> poultry sector. <strong>The</strong> study aims to identify the m<strong>in</strong>imum<br />
poultry farms size which is f<strong>in</strong>ancially feasible to produce electricity. To dissem<strong>in</strong>ate the<br />
technology it is necessary to know the m<strong>in</strong>imum size <strong>of</strong> poultry farm which are f<strong>in</strong>ancially<br />
viable. <strong>The</strong>refore, the study will help the different stakeholders to dissem<strong>in</strong>ate the technology<br />
<strong>in</strong> a susta<strong>in</strong>able manner. <strong>The</strong> study also estimates the total potential <strong>of</strong> electricity that could<br />
be generated <strong>from</strong> poultry waste. This will help the public and private sector <strong>in</strong>vestors to take<br />
decision <strong>in</strong> <strong>in</strong>vest<strong>in</strong>g for electricity generation <strong>from</strong> poultry waste.<br />
1.6 Overview <strong>of</strong> the Chapters<br />
This report is divided <strong>in</strong>to seven chapters. Each chapter is further divided <strong>in</strong>to sub chapters to<br />
look at the subject matter <strong>in</strong> depth. <strong>The</strong> first chapter describes an <strong>in</strong>troductory background <strong>of</strong><br />
the study, significance <strong>of</strong> the study, research questions and ma<strong>in</strong> objectives <strong>of</strong> the study.<br />
Second chapter provides the background <strong>in</strong>formation <strong>of</strong> the country as well as the study area<br />
relevant to the study such as energy sector <strong>in</strong> the country, energy policy issues, poultry sector<br />
etc. and some general features. Third chapter discusses the methodology <strong>of</strong> the study which<br />
<strong>in</strong>cludes the approach <strong>of</strong> the study, data collection, data analysis, different scenario methods<br />
and scope and limitation <strong>of</strong> the study. Fourth chapter gives a detail analysis <strong>of</strong> the energy<br />
consumption status <strong>in</strong> poultry farms. Fifth chapter describes the present status <strong>of</strong> electricity<br />
generation <strong>from</strong> poultry waste <strong>in</strong> the country. Sixth chapter describes an <strong>in</strong> depth analysis <strong>of</strong><br />
the potential <strong>of</strong> electricity generation <strong>from</strong> poultry waste <strong>in</strong> the country as well as <strong>in</strong> the study<br />
area. F<strong>in</strong>ally, chapter seven concludes the f<strong>in</strong>d<strong>in</strong>gs <strong>of</strong> the study and proposes some<br />
recommendations based upon the f<strong>in</strong>d<strong>in</strong>gs.<br />
4
CHAPTER 2 BACKGROUND INFORMATION<br />
2.1 Country Background<br />
2.1.1 General Overview<br />
Geographically, Bangladesh lies <strong>in</strong> the north eastern part <strong>of</strong> South Asia between 20º34´ and<br />
26º38´ north latitude and 88º01’ and 92º41’ east longitude (BBS, 2007, p. XIX). Bangladesh<br />
is surrounded by India on west, north and north-east and Myanmar on the south-east and the<br />
Bay <strong>of</strong> Bengal on the south (ibid). <strong>The</strong> total land area <strong>of</strong> the country is 56,977 square miles or<br />
1,47,570 square kilometer (sq km) (ibid). <strong>The</strong> map <strong>of</strong> the country is given <strong>in</strong> figure 2.1. <strong>The</strong><br />
climate <strong>of</strong> Bangladesh is sub-tropical monsoon climate. In w<strong>in</strong>ter the temperature ranges<br />
<strong>from</strong> a m<strong>in</strong>imum <strong>of</strong> 7.22º C -12.77º C to maximum <strong>of</strong> 23.88º C -31.11º C. <strong>The</strong> maximum<br />
temperature <strong>of</strong> the country recorded <strong>in</strong> summer <strong>from</strong> 36.66º C to 40.55º C (ibid, p. XX).<br />
<strong>The</strong> enumerated population <strong>of</strong> the country is currently 123.8 million (accord<strong>in</strong>g to the<br />
population census 2001). (BBS, 2007, p. XIX-XX). Out <strong>of</strong> which the percentage <strong>of</strong> rural<br />
population is 80.2% and the rest 19.8 % is urban population (ibid, p.32-33 and own<br />
calculation ). <strong>The</strong> <strong>in</strong>ter-censal growth rate <strong>of</strong> population <strong>in</strong> 2001 was 1.48% per annum. (ibid,<br />
p.33) <strong>The</strong> density <strong>of</strong> population is 839 per sq km (ibid, p. XIX-XX and own calculation). <strong>The</strong><br />
literacy rate <strong>in</strong> the country is 45.3% for population 7 years or above (ibid, p. XIX-XX).<br />
Bangladesh has six adm<strong>in</strong>istrative divisions (ibid, p. XXI). <strong>The</strong>se divisions are subdivided<br />
<strong>in</strong>to district or zilla (ibid). <strong>The</strong> total number <strong>of</strong> district or zilla <strong>in</strong> the country is 64 (ibid). Each<br />
district or zilla is further sub-divided <strong>in</strong>to upazila or thana. (ibid).<br />
In 2004-2005 the per capita GDP <strong>of</strong> the country at current market prices was 27061 BDT or<br />
US$ 440 (1 US$= 61.39 BDT, ibid, p.418) approximately.<br />
5
Figure 2.1 Show<strong>in</strong>g the Geography <strong>of</strong> Bangladesh<br />
Source: www.un.org/Depts/Cartographic/map/pr<strong>of</strong>ile/banglade.pdf pr<strong>in</strong>ted on 04.06.07<br />
6<br />
Gazipur<br />
District
2.1.2 Energy Sector <strong>in</strong> Bangladesh<br />
Primary Commercial Energy Resources<br />
About 60% <strong>of</strong> the total primary energy <strong>in</strong> the country comes <strong>from</strong> commercial energy sources<br />
(NEP, 2006, p. 1).<strong>The</strong> primary commercial energy resources <strong>in</strong> Bangladesh are natural gas<br />
and recently discovered coal. <strong>The</strong> recoverable proven and probable natural gas reserve <strong>in</strong> the<br />
country is 20.51 Trillion Cubic Feet (TCF) and the cumulative production up to June, 2004<br />
was 5.90 TCF (BBS, 2007, p. 244). <strong>The</strong> total gas consumption <strong>in</strong> 1999-00 and 2004-05 was<br />
8780 MMCF and 12922 MMCF respectively (BBS, 2007, p. 251). <strong>The</strong> average growth <strong>of</strong> gas<br />
consumption <strong>in</strong> the last six years is 7.86%. (ibid and own calculation) With this average<br />
growth <strong>of</strong> consumption the reserve <strong>of</strong> natural gas could susta<strong>in</strong> the country up to the year<br />
2020 without any discovery <strong>of</strong> new gas fields (BBS, 2007, p. 244, 246, 251 and own<br />
calculation). Natural gas is used both as primary and secondary fuel <strong>in</strong> the energy mix <strong>of</strong> the<br />
country. Figure 2.2 shows the consumption <strong>of</strong> natural gas <strong>in</strong> different sectors.<br />
<strong>in</strong> MMCM<br />
4500<br />
4000<br />
3500<br />
3000<br />
2500<br />
2000<br />
1500<br />
1000<br />
500<br />
0<br />
Figure 2.2 Consumption <strong>of</strong> natural gas by category <strong>of</strong> sectors<br />
3976<br />
2661<br />
1463<br />
7<br />
137<br />
1486<br />
1199<br />
Power Fertilizer Industrial Commercial Domestic Others<br />
Sector<br />
Source: BBS, 2007, p. 246 and own plott<strong>in</strong>g<br />
<strong>The</strong> proven coal reserve <strong>in</strong> Bangladesh is estimated at over 1 billion tons which is equivalent<br />
to 38 TCF <strong>of</strong> natural gas which is more than three times the rema<strong>in</strong><strong>in</strong>g proven and probable<br />
gas reserve <strong>in</strong> the country (NEP, 2006, p. 15).
Power Sector<br />
<strong>The</strong> total <strong>in</strong>stalled capacity <strong>of</strong> electricity generation <strong>in</strong> Bangladesh is 5245 MW 8 . Currently<br />
the country is fac<strong>in</strong>g enormous electricity deficit. <strong>The</strong> amount <strong>of</strong> load shedd<strong>in</strong>g is 572 MW<br />
aga<strong>in</strong>st a maximum load <strong>of</strong> 3548 MW as on 03.06.2007 9 . Natural gas is the prime source <strong>of</strong><br />
primary energy <strong>in</strong> electricity generation followed by furnace oil. Figure 2.3 shows the<br />
<strong>in</strong>stalled capacity <strong>of</strong> electricity generation by type <strong>of</strong> fuel.<br />
4.08%<br />
Figure 2.3 Total Installed Capacity by Type <strong>of</strong> Fuel<br />
5.34% 4.39% 4.77%<br />
Total 5245 MW<br />
8<br />
81.84%<br />
Gas<br />
Diesel<br />
Furnace oil<br />
Hydro<br />
Source: http://www.bpdb.gov.bd/<strong>in</strong>stalled_fuel.htm pr<strong>in</strong>ted on 20.08.2007<br />
F<strong>in</strong>al Consumption <strong>of</strong> Commercial Energy<br />
Commercial energy <strong>in</strong>cludes natural gas, electricity, petroleum products and coal (BBS,<br />
2007, p. 252). <strong>The</strong> commercial energy consumed by different sectors is shown <strong>in</strong> Figure 2.4.<br />
<strong>The</strong> total f<strong>in</strong>al energy consumption was 33416 thousand tons <strong>of</strong> coal equivalents (TCE) <strong>in</strong><br />
2003-04 (ibid). <strong>The</strong> share <strong>of</strong> consumption <strong>of</strong> f<strong>in</strong>al commercial energy <strong>in</strong> different sectors are<br />
as follows: domestic 17.43%, <strong>in</strong>dustrial 9.83%, commercial 0.95%, transport 23.70%,<br />
agriculture & others 12.45% and non energy use ( use as a raw material for fertilizer<br />
production) 35.63%. (ibid and own calculation)<br />
8 http://www.bpdb.gov.bd/key_statistics.htm pr<strong>in</strong>ted on 20.08.2007<br />
9 http://www.bpdb.gov.bd/download/Daily_Summery_Report.pdf pr<strong>in</strong>ted on 20.08.2007<br />
Coal
'000' tons <strong>of</strong> coal equivalent<br />
14000<br />
12000<br />
10000<br />
8000<br />
6000<br />
4000<br />
2000<br />
0<br />
Figure 2.4 Sector wise F<strong>in</strong>al Consumption <strong>of</strong> Commercial Energy<br />
5826<br />
Demestic/<br />
Residential<br />
Traditional Fuel Supply<br />
3286<br />
317<br />
Industrial Commercial/<br />
Services<br />
9<br />
Sector<br />
7921<br />
4160<br />
Transport Agriculture &<br />
Others<br />
11906<br />
Non-energy<br />
use<br />
Source: BBS, 2007, p. 252 and own plott<strong>in</strong>g<br />
About 40% <strong>of</strong> the total primary energy <strong>of</strong> the country comes <strong>from</strong> renewable energy, ma<strong>in</strong>ly<br />
biomass (NEP, 2006, p. 1). <strong>The</strong> total amount <strong>of</strong> energy supplied by traditional biomass fuel <strong>in</strong><br />
unorganized sector was 15353 thousand TCE <strong>in</strong> 2004-05 (BBS, 2007, p. 253). Figure 2.5<br />
shows the estimates <strong>of</strong> energy supplied by different types <strong>of</strong> traditional fuel <strong>in</strong> 2004-05. <strong>The</strong><br />
percentage distribution <strong>of</strong> different types <strong>of</strong> traditional fuels are as follows: cow dung<br />
16.49%, jute stick 5.72%, rice straw 9.18%, rice hulls 18.59%, bagasse 2.55%, firewood<br />
26.29%, twigs leaves 11.39% and other wastes 9.15% (ibid and own calculation).<br />
'000' tons <strong>of</strong> coal equivalent<br />
4500<br />
4000<br />
3500<br />
3000<br />
2500<br />
2000<br />
1500<br />
1000<br />
500<br />
0<br />
Figure 2.5 Estimates <strong>of</strong> Energy Supplied by Traditional Fuels<br />
2532<br />
878<br />
1410<br />
Cowdung Jute Stick Rice<br />
Straw<br />
2854<br />
392<br />
4133<br />
1749<br />
Rice Hulls Bagasse Firewood Twigs<br />
Leaves<br />
Type <strong>of</strong> fuel<br />
1405<br />
Other<br />
<strong>Waste</strong>s<br />
Source: BBS, 2007, p. 253 and own plott<strong>in</strong>g
Biogas plant <strong>in</strong> the country<br />
Different organizations both government and non government are <strong>in</strong>volved <strong>in</strong> dissem<strong>in</strong>at<strong>in</strong>g<br />
the biogas technology through out the country. Total number <strong>of</strong> biogas plants <strong>in</strong> the country<br />
is about 25000. So far Bangladesh Council for Scientific and Industrial Research (BCSIR)<br />
has <strong>in</strong>stalled about 22000 biogas plants <strong>in</strong> the country 10 . Besides, Local Government<br />
Eng<strong>in</strong>eer<strong>in</strong>g Department (LGED) has <strong>in</strong>stalled about 1167 11 , Bangladesh Rural Advancement<br />
Committee has <strong>in</strong>stalled about 1200 (Nes et al., 2005, p. 36), Grameen Shakti (GS) has<br />
<strong>in</strong>stalled 500 12 and Department <strong>of</strong> Environment has <strong>in</strong>stalled about 260 biogas plant (Ali<br />
2005, p. 26) <strong>in</strong> the country. However, the number <strong>of</strong> biogas plants <strong>in</strong> the poultry sector is not<br />
significant. Out <strong>of</strong> the total number <strong>of</strong> biogas plants, <strong>in</strong> the poultry sector BCSIR has <strong>in</strong>stalled<br />
about 3000 to 3500 biogas plants 13 , whereas the number <strong>of</strong> biogas plants <strong>in</strong>stalled <strong>in</strong> poultry<br />
sector by LGED and GS are 20 14 and 150 15 respectively.<br />
Energy Policy <strong>in</strong> Bangladesh<br />
Energy is one <strong>of</strong> the driv<strong>in</strong>g forces for the socio-economic development <strong>of</strong> the country.<br />
Government <strong>of</strong> Bangladesh has given cont<strong>in</strong>u<strong>in</strong>g attention for the overall development <strong>of</strong><br />
energy sector. As a consequence the government had declared the first National Energy<br />
Policy (NEP) <strong>of</strong> the country <strong>in</strong> 1996. Due to the rapid change <strong>in</strong> the global situation as well<br />
as <strong>in</strong> the country the government has updated the NEP <strong>in</strong> 2004 (NEP, 2004, p. 1-2). <strong>The</strong> ma<strong>in</strong><br />
objectives <strong>of</strong> the revised NEP are as follows:<br />
“(i) To provide energy for susta<strong>in</strong>able economic growth so that the economic<br />
development activities <strong>of</strong> different sectors are not constra<strong>in</strong>ed due to shortage <strong>of</strong><br />
energy.<br />
(ii) To meet the energy needs <strong>of</strong> different zones <strong>of</strong> the country and socio-economic<br />
groups.<br />
(iii) To ensure optimum development <strong>of</strong> all the <strong>in</strong>digenous energy sources.<br />
(iv) To ensure susta<strong>in</strong>able operation <strong>of</strong> the energy utilities<br />
(v) To ensure rational use <strong>of</strong> total energy sources.<br />
(vi) To ensure environmentally sound susta<strong>in</strong>able energy development programmes<br />
caus<strong>in</strong>g m<strong>in</strong>imum damage to environment.<br />
(vii) To encourage public and private sector participation <strong>in</strong> the development and<br />
management <strong>of</strong> the energy sector.<br />
(viii) To br<strong>in</strong>g entire country under electrification by the year 2020.<br />
10 Interview by the author with Mr. Kazi Akhtaruzzaman, Director, BCSIR Laboratories, Dhaka, 13.06.2007<br />
11 http://www.lged-re<strong>in</strong>.org/biomass/biopro_lged.htm, pr<strong>in</strong>ted on 15.08.2007<br />
12 http://www.grameen-<strong>in</strong>fo.org/grameen/gshakti/<strong>in</strong>dex.html, pr<strong>in</strong>ted on 15.08.2007<br />
13 Interview by the author with Mr. Kazi Akhtaruzzaman, Director, BCSIR Laboratories, Dhaka, 13.06.2007<br />
14 http://www.lged-re<strong>in</strong>.org/biomass/biopro_lged.htm, pr<strong>in</strong>ted on 15.08.2007<br />
15 Interview by the author with Mr. M.A.G<strong>of</strong>ran, Biogas Consultant, Grameen Shakti, Dhaka, 21.05.2007<br />
10
(ix) To ensure reliable supply <strong>of</strong> energy to the people at reasonable and affordable<br />
price.<br />
(x) To develop a regional energy market for rational exchange <strong>of</strong> commercial energy<br />
to ensure energy security” (NEP, 2004, p. 2).<br />
Renewable Energy Policy<br />
<strong>The</strong> National Energy Policy (NEP) 1996 also covers the Renewable Energy Policy. <strong>The</strong>re are<br />
different objectives set <strong>in</strong> the policy for the development <strong>of</strong> renewable energy sectors. <strong>The</strong><br />
objectives are given below:<br />
“• Promotion <strong>of</strong> renewable energy attract<strong>in</strong>g private capital <strong>in</strong>vestment<br />
• To accelerate electrification program us<strong>in</strong>g renewable energy resources<br />
• To reduce pressure on commercial fuels<br />
• <strong>Generation</strong> <strong>of</strong> power utiliz<strong>in</strong>g renewable energy to share at least 5% <strong>of</strong> total demand by<br />
2010 and 10% by 2020.<br />
• To ensure optimum development <strong>of</strong> all renewable energy sources<br />
• To ensure environmentally sound susta<strong>in</strong>able energy development programs caus<strong>in</strong>g<br />
m<strong>in</strong>imum damage to environment.<br />
• To encourage public and private sector participation <strong>in</strong> the development renewable<br />
energy<br />
• To promote competition among the entrepreneurs” (NEP, 2004, p. 42).<br />
Under the policy, the renewable energy entrepreneur is responsible to f<strong>in</strong>d its consumer for<br />
electricity. <strong>The</strong> tariff <strong>of</strong> electricity can be settled mutually by the entrepreneur and the<br />
consumer. <strong>The</strong> entrepreneur can build its own distribution system or it can use the exist<strong>in</strong>g<br />
distribution system <strong>of</strong> different utilities subject to payment <strong>of</strong> wheel<strong>in</strong>g charges. <strong>The</strong> utilities<br />
may buy the electricity <strong>from</strong> the grid connected renewable energy projects through mutually<br />
agreed Power Purchase Agreement (PPA). <strong>The</strong> policy <strong>of</strong>fers different f<strong>in</strong>ancial <strong>in</strong>centives to<br />
promote the sector. <strong>The</strong> renewable energy entrepreneurs shall be exempted <strong>from</strong> corporate<br />
<strong>in</strong>come tax for a period <strong>of</strong> 15 years. 100% depreciation <strong>in</strong> the first year was considered for<br />
solar projects and 100% depreciation for 5 years was considered for other renewable projects<br />
such as w<strong>in</strong>d, biogas etc. Import <strong>of</strong> renewable energy plant or equipments will be free <strong>of</strong><br />
custom duties and Value Added Tax (VAT). Foreign <strong>in</strong>vestors are encouraged to enter the<br />
bus<strong>in</strong>ess with jo<strong>in</strong> venture. <strong>The</strong> policy also <strong>of</strong>fers some other <strong>in</strong>centives for the foreign<br />
<strong>in</strong>vestors (NEP, 2004, p. 43-44).<br />
11
Small Power Plant (SPP) Policy 16<br />
Under Small Power Policy the private <strong>in</strong>vestors are allowed to generate electricity for their<br />
own use and sell the excess electricity to the other consumers. <strong>The</strong> SPPs can be located at any<br />
part <strong>of</strong> the country. <strong>The</strong> SPPs can use natural gas as primary energy if it is with<strong>in</strong> the natural<br />
gas network or the SPPs can arrange their own fuel. It is the responsibility <strong>of</strong> the SPP to f<strong>in</strong>d<br />
out their customers for electricity and they will have direct contract with the consumers for<br />
the sell <strong>of</strong> electricity. For power transmission the SPPs can build their own distribution<br />
network or they can use the exist<strong>in</strong>g transmission system subject to the payment <strong>of</strong> wheel<strong>in</strong>g<br />
charges and the adequacy <strong>of</strong> the capacity <strong>of</strong> the network. <strong>The</strong> tariff <strong>of</strong> electricity shall be as <strong>of</strong><br />
the tariff announced by the government if the area is covered by the national grid. On the<br />
other hand, where there is no electricity network, the tariff can be negotiated between the<br />
SPPs and the consumers. However, it is not clear whether government would charge any<br />
tax/VAT on such sell.<br />
Captive power policy 17 :<br />
For a long time the country had no captive power policy, however, the government approved<br />
the captive power policy <strong>in</strong> February 2007. Accord<strong>in</strong>g to the policy the Captive Power Plants<br />
(CPP) are now allowed to sell their excess electricity to the electric utility. However, the<br />
electric utility power purchaser has the right not to purchase electricity <strong>from</strong> CPP dur<strong>in</strong>g <strong>of</strong>fpeak<br />
hours. CPP is responsible to build the <strong>in</strong>terconnection network required for the supply<br />
<strong>of</strong> electricity on to the grid. <strong>The</strong> cost for <strong>in</strong>ter connection with network <strong>in</strong>clud<strong>in</strong>g switch gear;<br />
meter<strong>in</strong>g, protection etc. will be born by the owner <strong>of</strong> the CPP. To sell electricity to the<br />
electric utility other than the host electric utility, CPP may use the exist<strong>in</strong>g transmission<br />
system subject to payment <strong>of</strong> the wheel<strong>in</strong>g charge applicable and the adequacy <strong>of</strong> the<br />
capacity <strong>of</strong> the network. <strong>The</strong> tariff for purchas<strong>in</strong>g power <strong>from</strong> a CPP shall not exceed the<br />
tariff by which Bangladesh Power Development Board (BPDB) sells power at 132 KV<br />
exclud<strong>in</strong>g wheel<strong>in</strong>g charge. No bank<strong>in</strong>g <strong>of</strong> energy is allowed under this policy. Separate<br />
bill<strong>in</strong>g will be carried out for export and import <strong>of</strong> energy by the CPP.<br />
16 Summarized <strong>from</strong> Policy Guidel<strong>in</strong>es for Small Power Plant (SPP) <strong>in</strong> private sector, 2001.<br />
17 Summarized <strong>from</strong> Policy Guidel<strong>in</strong>es for Power Purchase <strong>from</strong> Captive Power Plant, 2007<br />
12
2.1.3 <strong>Poultry</strong> Sector <strong>in</strong> Bangladesh<br />
In 2005-06 the total number <strong>of</strong> poultry birds was 194.82 million and the number <strong>of</strong> poultry<br />
farms was 130 thousand 18 . It is shown <strong>from</strong> Figure 2.6 that the poultry <strong>in</strong>dustry <strong>in</strong><br />
Bangladesh has flourished <strong>in</strong> the late 90’s and the number <strong>of</strong> poultry farm is <strong>in</strong>creas<strong>in</strong>g day<br />
by day. S<strong>in</strong>ce 2001-02, the rate <strong>of</strong> growth <strong>of</strong> poultry farm is about 7% and s<strong>in</strong>ce 2000-01, the<br />
rate <strong>of</strong> growth <strong>of</strong> poultry bird is about 5.59% (ibid and own calculation). Figure 2.6 and<br />
Figure 2.7 shows the trend <strong>of</strong> growth <strong>of</strong> poultry bird <strong>from</strong> 2001-02 to 2005-06 and the<br />
cumulative number poultry farms <strong>in</strong> different periods respectively.<br />
<strong>in</strong> Million<br />
Figure 2.6 Trend <strong>of</strong> growth <strong>of</strong> poultry birds <strong>in</strong> Bangladesh dur<strong>in</strong>g 2001-02 to 2005-06<br />
250<br />
200<br />
150<br />
100<br />
50<br />
0<br />
152.24<br />
162.44<br />
13<br />
172.63<br />
183.45<br />
194.82<br />
2001-2002 2002-2003 2003-2004<br />
Year<br />
2004-2005 2005-2006<br />
Source: Own plott<strong>in</strong>g based on data provided by Mr. A. S. Md. Abdul Hannan, Scientific<br />
Officer, Department <strong>of</strong> Livestock Services (DLS), Dhaka-1215, Bangladesh, 17.05.2007<br />
<strong>in</strong> Thousand<br />
Figure 2.7 Trend <strong>of</strong> growth <strong>of</strong> poultry farms <strong>in</strong> Bangladesh <strong>in</strong> different periods<br />
140.00<br />
120.00<br />
100.00<br />
80.00<br />
60.00<br />
40.00<br />
20.00<br />
0.00<br />
0.79<br />
60.67<br />
91.43<br />
118.53<br />
1979-1980 1997-1998 2000-2001<br />
Year<br />
2004-2005 2005-2006<br />
Source: Own plott<strong>in</strong>g based on data provided by Mr. A. S. Md. Abdul Hannan, Scientific<br />
Officer, Department <strong>of</strong> Livestock Services, Dhaka-1215, Bangladesh, 17.05.2007<br />
18<br />
data provided by Mr. A. S. Md. Abdul Hannan, Scientific Officer, Department <strong>of</strong> Livestock Services (DLS),<br />
Dhaka-1215, Bangladesh, 17.05.2007<br />
130
It is really difficult to get reliable data or statistics on the size <strong>of</strong> poultry farms <strong>in</strong> Bangladesh<br />
as there is no poultry census <strong>in</strong> the country. However, Dr. Mahbubur Rahman <strong>in</strong> an <strong>in</strong>terview<br />
(quoted <strong>in</strong> BCAS, 2005, p. 38) gave a more detail estimate <strong>of</strong> the farm sizes which are shown<br />
<strong>in</strong> Table 2.1.<br />
Table 2.1 Estimated sizes <strong>of</strong> the poultry farms<br />
Size (No <strong>of</strong> birds) No. <strong>of</strong> farms (approximate) Percentage<br />
100-249 15000 12.90%<br />
250-499 35000 30.11%<br />
500-999 45000 38.71%<br />
1000-4999 12000 10.32%<br />
5000-9999 8000 6.88%<br />
10000-50000 1200 1.03%<br />
> 50000 50 0.04%<br />
Total 116520<br />
Source: BCAS, 2005, p. 38 and own calculation<br />
14
2.2 Study Area Background<br />
2.2.1 Geography<br />
Gazipur district lies between 23º53´ and 24º21´ north latitude and 90º09’ and 90º22’ east<br />
longitude (BBS, 2006, p. 1). It is bordered by Kishoreganj and Maymensh<strong>in</strong>g on the north,<br />
Dhaka, Narayanganj and Nars<strong>in</strong>gdi districts on the south, Nars<strong>in</strong>gdi district on the east and<br />
Dhaka and Tangail district on the west (ibid). <strong>The</strong> geography <strong>of</strong> the district is shown <strong>in</strong><br />
Figure 2.8.<br />
Figure 2.8 Geography <strong>of</strong> Gazipur District<br />
Source: http://www.banglapedia.search.com.bd/Maps/MG_0065.GIF pr<strong>in</strong>ted on 10.06.2007<br />
15
2.2.2 Key Statistics <strong>of</strong> the Study Area<br />
Gazipur zila was previously a sub-division <strong>of</strong> Dhaka district. It was upgraded to a district <strong>in</strong><br />
1984 (BBS, 2006, p. 1). Key statistic <strong>of</strong> the study area is given <strong>in</strong> the follow<strong>in</strong>g table Table<br />
2.2 .<br />
Table 2.2 Key Statistic <strong>of</strong> Gazipur District<br />
Established 1984<br />
Population 2 Million<br />
Area 1741 sq km<br />
Household 448258<br />
Number <strong>of</strong> Household electrified<br />
Adm<strong>in</strong>istrative Units<br />
235768<br />
Upazilla 5<br />
Union 45<br />
Village 1162<br />
Municipality 2<br />
Literacy 56.4%<br />
Per Capita GDP 693 US$<br />
Growth rate 5.17%<br />
Source: Author based on BBS 2007, p. 490 and BBS, 2006, p. Xi, 1, 9<br />
2.2.3 Available Energy <strong>in</strong>formation <strong>in</strong> the study area<br />
<strong>Electricity</strong>: In Gazipur district as a whole the total 56.39% (BBS, 2006, p. 146) <strong>of</strong> household<br />
is grid connected which is higher than the country average <strong>of</strong> 33%. In the rural areas the<br />
percentage <strong>of</strong> household which is grid connected is about 33.47% whereas <strong>in</strong> pauroshava<br />
(Municipility) and <strong>in</strong> urban areas the percentages are 91.49% and 67.72% respectively (ibid<br />
and own calculation).<br />
Natural Gas: <strong>The</strong> district is partially covered by natural gas network. <strong>The</strong>re are about 42 km<br />
natural gas pipe l<strong>in</strong>e network <strong>in</strong> the district. All the upazillas are partially covered by the<br />
natural gas distribution network 19 .<br />
19 Interview by the author with Mr. Tareq Mustafa, Assistant Eng<strong>in</strong>eer, TGTDCL, Dhaka, 21.06.2007<br />
16
Biogas Plant <strong>in</strong> poultry sector <strong>in</strong> the study area: <strong>The</strong>re are about 300 to 350 biogas plants<br />
<strong>in</strong>stalled by BCSIR <strong>in</strong> different poultry farms <strong>in</strong> the district 20 . <strong>The</strong> number <strong>of</strong> biogas plants <strong>in</strong><br />
poultry farms <strong>in</strong>stalled by GS is about 150 21 .<br />
2.2.4 <strong>Poultry</strong> Sector <strong>in</strong> the Study Area<br />
Gazipur district is one <strong>of</strong> the most densely poultry populated districts <strong>in</strong> Bangladesh. <strong>The</strong><br />
district has about 10% <strong>of</strong> the total poultry farms <strong>in</strong> the country 22 . <strong>The</strong> total number <strong>of</strong> poultry<br />
farm <strong>in</strong> the district is 12471 and the total number <strong>of</strong> bird is 18.14 million 23 . <strong>The</strong>re are two<br />
types <strong>of</strong> farm <strong>in</strong> the district: layer farm and broiler farm. <strong>The</strong> total number <strong>of</strong> layer farm <strong>in</strong><br />
the district is 7135 and the total number <strong>of</strong> layer bird is 11.13 million (ibid). <strong>The</strong> number <strong>of</strong><br />
broiler farm is 5336 and the number <strong>of</strong> broiler bird is 7 million (ibid). <strong>The</strong> average number <strong>of</strong><br />
bird <strong>in</strong> layer and broiler farm is 1560 and 1312 respectively, where as the total average is<br />
1454 (ibid and own calculation).<br />
<strong>The</strong>re are 5 upazillas <strong>in</strong> the district called Gazipur Sadar, Kaliakair, Sreepur, Kapasia and<br />
Kaliganj. Among the upazillas Gazipur Sadar has the highest number <strong>of</strong> poultry farm. <strong>The</strong><br />
percentages <strong>of</strong> poultry farm <strong>in</strong> different upazillas are as follows: Gazipur Sadar 63.85%,<br />
Kaliakair 3.95%, Sreepur 7.02%, Kapasia 17.40% and Kaliganj 7.78% (ibid and own<br />
calculation). <strong>The</strong> upazillawise number <strong>of</strong> poultry farm is given <strong>in</strong> Figure 2.9.<br />
20 Interview by the author with Mr. Kazi Akhtaruzzaman, Director, BCSIR Laboratories, Dhaka, 13.06.2007<br />
21 Interview by the author with Mr. M.A.G<strong>of</strong>ran, Biogas Consultant, Grameen Shakti, Dhaka, 21.05.2007<br />
22 own calculation based on data provided by Mr. A. S. Md. Abdul Hannan, Scientific Officer, Department <strong>of</strong><br />
Livestock Services (DLS), Dhaka-1215, Bangladesh, 17.05.2007 and data provided by Mr. Md. Kafiludd<strong>in</strong><br />
Bhuyan, District Livestock Officer, Gazipur, 13.05.2007<br />
23 data provided by Mr. Md. Kafiludd<strong>in</strong> Bhuyan, District Livestock Officer, Gazipur, 13.05.2007<br />
17
875<br />
2170<br />
493<br />
Figure 2.9 Upazillawise total number <strong>of</strong> poultry farm<br />
970<br />
18<br />
7963<br />
Gazipur sadar<br />
Kaliakair<br />
Sreepur<br />
Kapasia<br />
Kaliganj<br />
Source: Own plott<strong>in</strong>g based on data provided by Mr. Md. Kafiludd<strong>in</strong> Bhuyan, District<br />
Livestock Officer, Gazipur, 13.05.2007<br />
<strong>The</strong> percentages <strong>of</strong> poultry bird <strong>in</strong> different upazillas are as follows: Gazipur Sadar 55.96%,<br />
Kaliakair 4.32%, Sreepur 28.67%, Kapasia 7.89% and Kaliganj 3.15% 24 . <strong>The</strong> upazillawise<br />
number <strong>of</strong> poultry bird is given <strong>in</strong> Figure 2.10.<br />
5.1997<br />
Figure 2.10 Upazillawise total number <strong>of</strong> poultry bird<br />
1.4317<br />
0.78375<br />
0.572<br />
In Million<br />
10.148193<br />
Gazipur sadar<br />
Kaliakair<br />
Sreepur<br />
Kapasia<br />
Kaliganj<br />
Source: Own plott<strong>in</strong>g based on data provided by Mr. Md. Kafiludd<strong>in</strong> Bhuyan, District<br />
Livestock Officer, Gazipur, 13.05.2007<br />
24<br />
own calculation based on data provided by Mr. Md. Kafiludd<strong>in</strong> Bhuyan, District Livestock Officer, Gazipur,<br />
13.05.2007
In case <strong>of</strong> layer farm, Sreepur upazilla has the highest number <strong>of</strong> birds per poultry on average<br />
and Kaliakair upazilla stands at second position. <strong>The</strong> average number <strong>of</strong> layer birds per<br />
poultry farm is given <strong>in</strong> Figure 2.11.<br />
Number<br />
9000<br />
8000<br />
7000<br />
6000<br />
5000<br />
4000<br />
3000<br />
2000<br />
1000<br />
0<br />
Figure 2.11 Average number <strong>of</strong> bird <strong>in</strong> layer farm <strong>in</strong> different upazilla<br />
1089<br />
2851<br />
19<br />
8031<br />
415<br />
2000<br />
Gazipur sadar Kaliakair Sreepur Kapasia Kaliganj<br />
Upazilla<br />
Source: Author based on data provided by Mr. Md. Kafiludd<strong>in</strong> Bhuyan, District Livestock<br />
Officer, Gazipur, 13.05.2007
3.1 Approach<br />
CHAPTER 3 METHODOLOGY<br />
<strong>The</strong> study was carried out as a case study <strong>in</strong> Gazipur district <strong>of</strong> Bangladesh. Through<br />
literature review and discussion with the experts the author identified that the density <strong>of</strong><br />
poultry farm <strong>in</strong> Gazipur district is the highest <strong>in</strong> Bangladesh. Out <strong>of</strong> 64 districts <strong>of</strong><br />
Bangladesh, Gazipur district has about 10% <strong>of</strong> the total poultry farms <strong>in</strong> Bangladesh. <strong>The</strong><br />
total number <strong>of</strong> poultry farms and birds <strong>in</strong> the district is 12471 and 18.14 million respectively<br />
where as the country statistics is 130 thousand and 194.82 million respectively. In terms <strong>of</strong><br />
number <strong>of</strong> birds, the district has about 10% <strong>of</strong> the total birds <strong>in</strong> the country. <strong>The</strong>re are two<br />
types <strong>of</strong> poultry farms <strong>in</strong> Bangladesh as well as <strong>in</strong> the study area. <strong>The</strong>se are layer farm and<br />
broiler farm. Currently <strong>in</strong> the country as a whole, there is no practice <strong>of</strong> produc<strong>in</strong>g biogas<br />
<strong>from</strong> broiler farms. All the poultry farms produc<strong>in</strong>g biogas are layer farms. One <strong>of</strong> the<br />
reasons why broiler farms do not produce biogas, is the nature <strong>of</strong> rear<strong>in</strong>g the birds which<br />
produces the dropp<strong>in</strong>gs <strong>in</strong> batch not cont<strong>in</strong>uous. <strong>The</strong>refore, the study was conducted among<br />
the different layer poultry farm <strong>in</strong> the different areas <strong>of</strong> the study area.<br />
Through discussion with different experts <strong>in</strong> the sector the author came to know that there are<br />
two poultry farms outside the study area called Faridpur Muslim Mission <strong>in</strong> Faridpur district<br />
and Bogra <strong>Poultry</strong> Complex <strong>in</strong> Bogra district which are presently produc<strong>in</strong>g electricity <strong>from</strong><br />
their own poultry waste. To get a prelim<strong>in</strong>ary idea about poultry farms and the technology <strong>of</strong><br />
produc<strong>in</strong>g electricity <strong>from</strong> poultry waste, the author visited the afore mentioned poultry<br />
farms. Grameen Shakti (a sister concern <strong>of</strong> Grameen Bank) is currently dissem<strong>in</strong>at<strong>in</strong>g the<br />
biogas technology among poultry farms <strong>in</strong> the study area through micro credit, while GTZ,<br />
Bangladesh is a development partner <strong>of</strong> the project. <strong>The</strong> author communicated with GTZ<br />
personnel to get access to visit different poultry farms through Grameen Shakti <strong>in</strong> the study<br />
area. <strong>The</strong> Maona unit <strong>of</strong>fice <strong>of</strong> Grameen Shakti helped the author to visit different poultry<br />
farms. However, the Grameen Shakti project was limited with<strong>in</strong> a union (substrata <strong>of</strong><br />
upazilla). Hence, the author communicated with some poultry feed dealers or distributors <strong>in</strong><br />
the district through social relationship to contact with some other poultry farm owners.<br />
Through discussion with different stakeholder <strong>in</strong> promot<strong>in</strong>g biogas technology <strong>in</strong> the country<br />
such as Grameen Shakti, BCSIR and LGED the author was able to identify all the farms <strong>in</strong><br />
the study area which are produc<strong>in</strong>g electricity <strong>from</strong> poultry waste. <strong>The</strong> author also came to<br />
know <strong>from</strong> GTZ experts that GTZ Bangladesh has <strong>in</strong>stalled a flagship project to produce<br />
20
electricity <strong>from</strong> poultry waste at Raj poultry Farm <strong>in</strong> Faridpur district. <strong>The</strong> author also visited<br />
Raj <strong>Poultry</strong> Farm to get an idea about the technology used there and to compare it with other<br />
technologies currently be<strong>in</strong>g used <strong>in</strong> the country as well as <strong>in</strong> the study area. Besides, two<br />
other farms <strong>in</strong> Mymens<strong>in</strong>gh district were visited one <strong>of</strong> which has <strong>in</strong>stalled biogas plant to<br />
produce electricity and the other already produc<strong>in</strong>g electricity <strong>from</strong> poultry waste. Visit<strong>in</strong>g<br />
different farms outside the study area revealed that the nature <strong>of</strong> rear<strong>in</strong>g poultry bird and<br />
energy consumption pattern <strong>in</strong> poultry farms is similar to that <strong>of</strong> the study area. It was also<br />
observed that the way <strong>of</strong> produc<strong>in</strong>g biogas <strong>from</strong> poultry dropp<strong>in</strong>gs <strong>in</strong> different poultry farms<br />
is almost similar irrespective <strong>of</strong> its geographical location <strong>in</strong> the country. Thus justifies that a<br />
case study <strong>in</strong> Gazipur district is representative for the whole country.<br />
Moreover, it was the convenience <strong>of</strong> the author to get access to visit the poultry farms and to<br />
communicate with<strong>in</strong> the study area. Besides, the time constra<strong>in</strong>t limited the author to study<br />
<strong>in</strong> a particular area. <strong>The</strong>refore the author was <strong>in</strong>tent to <strong>in</strong>vestigate the potential <strong>of</strong> electricity<br />
generation <strong>from</strong> poultry waste <strong>in</strong> Gazipur district that can be exaggerated for the whole<br />
country as well.<br />
3.2 Sampl<strong>in</strong>g Method<br />
Out <strong>of</strong> five upazillas (sub-strata <strong>of</strong> district) <strong>in</strong> the district the survey was conducted <strong>in</strong> two<br />
upazillas. <strong>The</strong> upazillas are Sreepur upazilla and Gazipur Sadar upazilla. <strong>The</strong>se upazillas<br />
were selected because <strong>in</strong> Sreepur upazilla the average number <strong>of</strong> bird per poultry farm is the<br />
highest <strong>in</strong> the district and <strong>in</strong> Gazipur Sadar upazilla the number <strong>of</strong> poultry farm is the highest<br />
<strong>in</strong> the district. Moreover, Gazipur Sadar upazilla has the highest number <strong>of</strong> poultry birds<br />
among the upazillas <strong>in</strong> the district whereas Sreepur upazilla stands at second position.<br />
In total 50 farms were visited randomly dur<strong>in</strong>g survey. Out <strong>of</strong> the 50 farms 25 farms were<br />
visited <strong>in</strong> Sreepur upazilla and the rest 25 were visited <strong>in</strong> Gazipur Sadar upazilla. Among<br />
these 50 farms 26 farms already have biogas plant and the rest 24 farms do not have any<br />
biogas plant. As Grameen Shakti is currently dissem<strong>in</strong>at<strong>in</strong>g biogas technology <strong>in</strong> Maona<br />
un<strong>in</strong>on under Sreepur upazilla, the number <strong>of</strong> poultry farms with biogas plant is higher <strong>in</strong><br />
Sreepur upazilla than <strong>in</strong> Gazipur Sadar upazilla. Figure 3.1 shows the sample distribution<br />
accord<strong>in</strong>g to upazilla and the biogas plant.<br />
21
Number<br />
20<br />
18<br />
16<br />
14<br />
12<br />
10<br />
8<br />
6<br />
4<br />
2<br />
0<br />
Figure 3.1 Sample distribution accord<strong>in</strong>g to upazilla and biogas plant<br />
19<br />
7<br />
<strong>Poultry</strong> farms with biogas plant <strong>Poultry</strong> farms without biogas<br />
plant<br />
22<br />
6<br />
18<br />
Sreepur upazilla<br />
Gazipur Sadar upazilla<br />
Source: Author<br />
Different sizes <strong>of</strong> poultry farms were visited dur<strong>in</strong>g field visit. <strong>The</strong> size <strong>of</strong> the farms ranges<br />
<strong>from</strong> 600 birds to 11000 birds. <strong>The</strong> follow<strong>in</strong>g Table 3.1 shows the sample distribution <strong>of</strong><br />
different sizes <strong>of</strong> poultry farms.<br />
Table 3.1 Sample distribution <strong>of</strong> different size <strong>of</strong> poultry farm<br />
Number <strong>of</strong> Number <strong>of</strong> % No <strong>of</strong> birds %<br />
birds<br />
farm<br />
less than 1000 3 6 2300 2<br />
1000 to 1999 14 28 18675 14<br />
2000 to 2999 19 38 40600 30<br />
3000 to 3999 5 10 15700 12<br />
4000 to 4999 2 4 8000 6<br />
5000 to 5999 3 6 15000 11<br />
6000 to 6999 0 0 0 0<br />
7000 to 7999 1 2 7000 5<br />
8000 to 8999 2 4 16500 12<br />
9000 to 9999 0 0 0 0<br />
more than<br />
10000<br />
1 2 11000 8<br />
Total 50 100 134775 100<br />
Source: Author<br />
3.3 Data Collection<br />
Various types <strong>of</strong> data were collected related to the study <strong>from</strong> different types <strong>of</strong> sources.<br />
Secondary data was collected <strong>from</strong> different <strong>in</strong>stitutions, relevant literature and <strong>in</strong>ternet
search<strong>in</strong>g. Primary data was collected by means <strong>of</strong> a questionnaire survey <strong>in</strong> different poultry<br />
farms.<br />
3.3.1 Secondary Data Collection<br />
Different concern <strong>in</strong>stitutions/ organizations were visited to collect necessary <strong>in</strong>formation for<br />
the study. <strong>Poultry</strong> sector related data were collected <strong>from</strong> Department <strong>of</strong> Livestock Services<br />
(DLS) and Office <strong>of</strong> the District Livestock Officer, Gazipur. Biogas related data were<br />
collected <strong>from</strong> Grameen Shakti, GTZ Bangladesh, Local Government Eng<strong>in</strong>eer<strong>in</strong>g<br />
Department (LGED) and Bangladesh Council <strong>of</strong> Scientific and Industrial Research (BCSIR).<br />
Energy related data were collected <strong>from</strong> Bangladesh Power Development Board (BPDB),<br />
Rural Electrification Board (REB), Power Cell, Titas Gas Transmission and Distribution<br />
Company Limited (TGTDCL). <strong>The</strong> country <strong>in</strong>formation and the study area <strong>in</strong>formation were<br />
collected <strong>from</strong> Bangladesh Bureau <strong>of</strong> Statistics (BBS). <strong>The</strong> different organizations mentioned<br />
above were visited, discussions with relevant <strong>of</strong>ficials were held, and the relevant literatures,<br />
documents and publications were collected. Besides, <strong>in</strong>ternet search<strong>in</strong>g was done and various<br />
relevant files <strong>from</strong> different web sites were downloaded.<br />
3.3.2 Primary Data Collection<br />
Primary data was collected by means <strong>of</strong> a questionnaire survey (a copy <strong>of</strong> this is attached as<br />
annex A) and <strong>in</strong>terview with the poultry farmers. Questions were asked to know about the<br />
present energy consumption, deficit <strong>of</strong> energy supply, backup system, the problems fac<strong>in</strong>g<br />
with the technology, size <strong>of</strong> biogas plant, use <strong>of</strong> slurry, the <strong>in</strong>terest <strong>of</strong> the farmers to produce<br />
electricity, and the barriers to dissem<strong>in</strong>ate the technology.<br />
3.4 Data Analysis<br />
All the quantitative data collected <strong>from</strong> the field were encoded <strong>in</strong> Micros<strong>of</strong>t Excel program<br />
and then analyzed. F<strong>in</strong>ancial analysis was done to f<strong>in</strong>d out the different sizes <strong>of</strong> poultry farm<br />
which are economically viable to produce electricity. <strong>The</strong> follow<strong>in</strong>g <strong>in</strong>dexes were determ<strong>in</strong>ed<br />
<strong>in</strong> the analysis such as Net present value (NPV), Internal Rate <strong>of</strong> Return (IRR) and Payback<br />
Period. Different sizes <strong>of</strong> poultry farms ranges <strong>from</strong> 500 birds to 50000 birds were considered<br />
for f<strong>in</strong>ancial analysis. Each <strong>of</strong> the farms was analyzed for different cases under different<br />
scenarios to f<strong>in</strong>d the m<strong>in</strong>imum size <strong>of</strong> farm which is f<strong>in</strong>ancially viable to produce electricity.<br />
<strong>The</strong> m<strong>in</strong>imum size <strong>of</strong> f<strong>in</strong>ancially viable poultry farm was then used to estimate the total<br />
potential <strong>of</strong> electricity production for different cases under different scenarios. In the<br />
f<strong>in</strong>ancial analysis the follow<strong>in</strong>g issues were considered such as exist<strong>in</strong>g electricity tariff,<br />
23
commercial bank <strong>in</strong>terest rate, market price <strong>of</strong> locally available gas generator, <strong>in</strong>come <strong>from</strong><br />
residue as fertilizer, cost <strong>of</strong> CO2 for Clean Development Mechanism (CDM) projects <strong>in</strong><br />
develop<strong>in</strong>g countries and the cost <strong>of</strong> biogas plant as local standard etc.<br />
Different wattage <strong>of</strong> electric lamps are be<strong>in</strong>g used <strong>in</strong> different poultry farms. <strong>The</strong> lamps are <strong>of</strong><br />
100 watts, 60 watts, 40 watts and 26 watts. Energy consumption <strong>of</strong> different farms <strong>of</strong> same<br />
capacity varies with the wattage <strong>of</strong> lamp used <strong>in</strong> the farm. <strong>The</strong>refore, the percentages <strong>of</strong><br />
energy consumption <strong>of</strong> poultry farms <strong>from</strong> own generation was considered as the average <strong>of</strong><br />
the percentage consumption <strong>of</strong> energy for us<strong>in</strong>g different wattage <strong>of</strong> lamps both for scenario<br />
I& II.<br />
In calculation <strong>of</strong> the total potential <strong>of</strong> electricity that could be generated <strong>from</strong> poultry waste,<br />
the sample data was considered as the basis. To f<strong>in</strong>d out the total potential <strong>in</strong> Gazipur district,<br />
the total number <strong>of</strong> layer birds <strong>in</strong> the district was taken and the sample data was magnified at<br />
district level data.<br />
<strong>The</strong> data regard<strong>in</strong>g the number <strong>of</strong> layer birds <strong>in</strong> the country was not available. However the<br />
total number <strong>of</strong> birds <strong>in</strong>clud<strong>in</strong>g layer and broiler birds was available. To f<strong>in</strong>d out the number<br />
<strong>of</strong> layer birds <strong>in</strong> the country, the ratio <strong>of</strong> the number <strong>of</strong> layer birds and the total number <strong>of</strong><br />
birds <strong>in</strong> Gazipur district was considered. <strong>The</strong>n the sample data was magnified at country level<br />
data to f<strong>in</strong>d out the total potential <strong>of</strong> electricity generation <strong>from</strong> poultry waste <strong>in</strong> Bangladesh.<br />
3.5 Scenario Method<br />
Two different scenarios were considered to f<strong>in</strong>d out the potential <strong>of</strong> electricity generation<br />
<strong>from</strong> poultry waste for the study area and for the country as well. Scenarios are based on time<br />
duration for which the poultry farms can produce electricity for its own consumption as well<br />
as to sell it to adjacent household. Different cases were also considered under each scenario.<br />
<strong>The</strong> follow<strong>in</strong>g will discuss the different scenarios and different cases.<br />
Scenario I (Production <strong>of</strong> electricity for five hours dur<strong>in</strong>g the country peak): In this<br />
scenario it was considered that the poultry farms would produce electricity for five hours a<br />
day. <strong>The</strong> five hours was considered on the basis <strong>of</strong> the country’s peak hour and the duration<br />
<strong>in</strong> which the farms mostly experience power cut. <strong>The</strong> country’s peak is 6 hours <strong>from</strong> 17:00<br />
hours to 23:00 hours. However, it was found that most <strong>of</strong> the poultry farms stop their<br />
electricity consumption by 22:00 hours. On the other hand, the poultry farms face huge load<br />
shedd<strong>in</strong>g through out the day mostly <strong>in</strong> the even<strong>in</strong>g. <strong>The</strong> duration <strong>of</strong> load shedd<strong>in</strong>g for most<br />
<strong>of</strong> the farms is about 4 hours a day. Moreover it was found <strong>from</strong> the experience <strong>of</strong> poultry<br />
24
farms which are currently produc<strong>in</strong>g electricity <strong>from</strong> poultry waste that the available gas<br />
generators us<strong>in</strong>g <strong>in</strong> the <strong>in</strong>dustry cannot run more than five hours at a time. Comb<strong>in</strong><strong>in</strong>g all<br />
these factors Scenario I was made to produce electricity for five hours a day ma<strong>in</strong>ly dur<strong>in</strong>g<br />
peak hours <strong>of</strong> the country.<br />
Scenario II (Production <strong>of</strong> electricity for twelve hours a day): In this scenario it was<br />
considered that the poultry farms would generate electricity for twelve hours a day. Such a<br />
scenario was made on the basis <strong>of</strong> daily energy consumption pattern <strong>of</strong> poultry farms. It was<br />
found that most <strong>of</strong> the farms use electricity for about twelve hours a day <strong>from</strong> 10:00 to 22:00<br />
hours. In this scenario the farms can run <strong>in</strong>dependently on their own electricity production<br />
hence may not need to pay for electricity to the electricity distributors. However, dur<strong>in</strong>g<br />
brood<strong>in</strong>g and ma<strong>in</strong>tenance <strong>of</strong> eng<strong>in</strong>e still, they will need grid electricity. <strong>The</strong>refore they may<br />
not necessary need to be totally disconnected <strong>from</strong> grid and this will mean they will still have<br />
to pay the m<strong>in</strong>imum charge to the electricity distributors every month.<br />
Different Cases:<br />
Four different cases were considered under each scenario. <strong>The</strong> cases were based on the<br />
different product through which revenue can be earned. Different products are electricity,<br />
CO2, and fertilizer. Different cases are as follows:<br />
Case 1: Only electricity was considered as a product to earn revenue. S<strong>in</strong>ce under the<br />
exist<strong>in</strong>g frame work condition only electricity can be sold or consumed commercially.<br />
Case 2: <strong>Electricity</strong> and CO2 were considered as product for revenue. In this case CO2 was<br />
added to see the impact CDM projects on the total potential.<br />
Case 3: <strong>Electricity</strong> and fertilizer were considered as product for revenue. In this case<br />
fertilizer was added as there are very few farms sell<strong>in</strong>g slurry as fertilizer commercially.<br />
However the market is not open for all. Only the farms who have patent can sell the fertilizer.<br />
So <strong>in</strong> future with the change <strong>of</strong> exist<strong>in</strong>g laws and through awareness development among the<br />
people a market could be created for slurry as fertilizer.<br />
Case 4: <strong>Electricity</strong>, CO2 and fertilizer were considered as revenue earn<strong>in</strong>g product.<br />
3.6 <strong>The</strong> Scope and Limitation <strong>of</strong> the Study<br />
<strong>The</strong> study was focused on electricity production <strong>from</strong> poultry waste for decentralized <strong>of</strong>f grid<br />
system at <strong>in</strong>dividual poultry farm. <strong>The</strong> centralized system for electricity generation by<br />
collect<strong>in</strong>g poultry waste <strong>from</strong> different farms was not considered <strong>in</strong> the study. <strong>The</strong> study did<br />
not consider feed electricity on to the grid. <strong>The</strong> study was based on a micro survey due to<br />
25
time constra<strong>in</strong>t. Very large scale farms could not be visited due to unwill<strong>in</strong>gness <strong>of</strong> the<br />
concern farms. <strong>The</strong>re is no poultry census <strong>in</strong> the country so data regard<strong>in</strong>g poultry statistics<br />
was not adequate. <strong>The</strong> total potential <strong>of</strong> electricity generation for the country was magnified<br />
<strong>from</strong> the data available <strong>of</strong> the study area.<br />
26
CHAPTER 4 ENERGY CONSUMPTION STATUS IN<br />
POULTRY FARMS<br />
<strong>The</strong> poultry farms <strong>in</strong> Gazipur district are covered by the national electricity grid. Gazipur<br />
Palli Bidyuit Samity (PBS) a rural electric cooperative under Bangladesh Rural<br />
Electrification Board (REB) is responsible for the commercial operation <strong>of</strong> electricity <strong>in</strong> the<br />
district. All most all the poultry farms are grid connected. <strong>The</strong>re is a huge power shortage <strong>in</strong><br />
the study area as well as <strong>in</strong> the country. For un<strong>in</strong>terrupted power supply some poultry farms<br />
use back up system such as diesel generator. On the other hand, to avoid the power<br />
<strong>in</strong>terruption there are a very few large scale farms which are not grid connected and have<br />
<strong>in</strong>dependent power plants based on natural gas. <strong>The</strong> daily energy consumption pattern <strong>in</strong><br />
poultry farms is almost similar. Usually, the farms consume less energy <strong>in</strong> the day time and<br />
consume more <strong>in</strong> the even<strong>in</strong>g. However, the farms us<strong>in</strong>g energy efficient lamps use less<br />
electricity <strong>in</strong> the even<strong>in</strong>g than day time. Few poultry farms <strong>in</strong> the district have biogas plants.<br />
<strong>The</strong> majority <strong>of</strong> the bio gas plants are undersized as compared to its total potential. Three<br />
poultry farms <strong>in</strong> the district currently produce electricity <strong>from</strong> biogas dur<strong>in</strong>g the power<br />
outage. <strong>The</strong> other poultry farms use biogas for thermal purposes ma<strong>in</strong>ly for household<br />
cook<strong>in</strong>g. <strong>The</strong> details <strong>of</strong> utilization <strong>of</strong> different types <strong>of</strong> energy <strong>in</strong> the poultry farms are<br />
discussed <strong>in</strong> this chapter.<br />
4.1 EXISTING UTILIZATION OF ELECTRICITY<br />
4.1.1 <strong>Electricity</strong> consumption <strong>of</strong> major electrical appliances used<br />
<strong>Electricity</strong> is <strong>in</strong>evitable for the production <strong>of</strong> eggs and for the growth <strong>of</strong> the birds as well.<br />
<strong>Electricity</strong> is used <strong>in</strong> the <strong>in</strong>dustry ma<strong>in</strong>ly by lamps to provide proper light<strong>in</strong>g <strong>in</strong> the poultry<br />
shed, fans to ma<strong>in</strong>ta<strong>in</strong> the required temperature, brooder to brood up the chicks and the water<br />
pumps to supply water. Follow<strong>in</strong>g are the details <strong>of</strong> the status <strong>of</strong> electricity use for the ma<strong>in</strong><br />
appliances <strong>in</strong> the poultry farms.<br />
Use <strong>of</strong> Lamp<br />
For the optimum production <strong>of</strong> eggs and the normal growth <strong>of</strong> birds it requires 16 - 17 hours<br />
light<strong>in</strong>g a day (Ghoshal, 2005, p, 119). Normally, <strong>from</strong> 6 am to 6 pm is considered as day<br />
light and no artificial light<strong>in</strong>g is required dur<strong>in</strong>g this period. However <strong>in</strong> some dark days it<br />
may require some additional light<strong>in</strong>g dur<strong>in</strong>g the period. Usually, artificial light<strong>in</strong>g is required<br />
27
for four hours a day <strong>from</strong> 6 pm to 10 pm <strong>in</strong> the even<strong>in</strong>g. All the farms use electric lamps for<br />
light<strong>in</strong>g. Different farms use different types <strong>of</strong> lamps. From the survey it was found that<br />
farms use <strong>in</strong>candescent lamp, compact fluorescent lamp (CFL) and fluorescent tube lamp<br />
(Figure 4.1). Interview with the farmers dur<strong>in</strong>g survey reveals that normally 10 lamps with<br />
the wattage ranges <strong>from</strong> 26 to 100 watts are used for 1000 birds and for the larger farms the<br />
number <strong>of</strong> lamp <strong>in</strong>creases proportionally. However, it was also found that some farms are<br />
us<strong>in</strong>g less than 10 lamps per 1000 birds.<br />
Figure 4.1 Show<strong>in</strong>g different types <strong>of</strong> lamp<br />
Incandescent lamp Fluorescent tube lamp CFL Lamp<br />
Out <strong>of</strong> 50 farms surveyed it was found that 7 farms use CFL lamp, 21 farms use <strong>in</strong>candescent<br />
lamp and 22 farms use fluorescent tube lamp. <strong>The</strong> figure 4.2 shows the percentage <strong>of</strong> poultry<br />
farms us<strong>in</strong>g different types <strong>of</strong> lamp.<br />
Figure 4.2 <strong>The</strong> percentage <strong>of</strong> poultry farms us<strong>in</strong>g different types <strong>of</strong> bulb<br />
44%<br />
28<br />
14%<br />
42%<br />
Source: Author<br />
CFL<br />
Incandescent<br />
Fluorescent tube<br />
Source: Author
<strong>The</strong> figure above shows that 14% farm uses energy efficient CFL lamp and 44% farm uses<br />
fluorescent tube lamp. <strong>The</strong> rest does not use it because <strong>of</strong> the high cost <strong>of</strong> CFL lamps or<br />
fluorescent tube lamp and lack <strong>of</strong> awareness about the use <strong>of</strong> energy efficient lamps. <strong>The</strong><br />
figure shows that the majority <strong>of</strong> the farm uses energy efficient lamps. However the<br />
percentage <strong>of</strong> farm us<strong>in</strong>g non energy efficient <strong>in</strong>candescent lamp is still significant. An<br />
awareness development program could help the farmers to reduce their energy consumption<br />
by us<strong>in</strong>g CFL lamp. For example, one 5000 birds’ farm us<strong>in</strong>g 100 watts <strong>in</strong>candescent lamp<br />
could reduce its annual energy consumption by about 40% only by replac<strong>in</strong>g the <strong>in</strong>candescent<br />
lamp with CFL lamp where the other th<strong>in</strong>gs rema<strong>in</strong> the same.<br />
Use <strong>of</strong> Fan<br />
29<br />
Figure 4.3 Show<strong>in</strong>g Fan<br />
<strong>The</strong> temperature <strong>in</strong> the poultry shed is usually<br />
ma<strong>in</strong>ta<strong>in</strong>ed between 12.8ºC to 27ºC for the optimum<br />
production <strong>of</strong> eggs (Ghoshal, 2005, p, 126). Fan (Figure<br />
4.3) is used <strong>in</strong> the poultry farm to ma<strong>in</strong>ta<strong>in</strong> the required<br />
temperature through out the year except <strong>in</strong> w<strong>in</strong>ter. In Fan<br />
w<strong>in</strong>ter for about three months no fan is <strong>in</strong> use due to the<br />
lower ambient temperature. Fan is used <strong>in</strong> the poultry<br />
farm <strong>from</strong> 6 hours to 12 hours a day depend<strong>in</strong>g upon the<br />
number <strong>of</strong> birds <strong>in</strong> the farm and ambient temperature.<br />
Source: Author<br />
<strong>The</strong> larger farms use fans for more hours and the smaller farms use for less hours. Similarly,<br />
<strong>in</strong> hot summer when ambient temperature goes high, it requires more use <strong>of</strong> fan than the other<br />
period <strong>of</strong> the year. Figure 4.4 shows the percentage <strong>of</strong> poultry farms us<strong>in</strong>g fan for different<br />
hours.
% <strong>of</strong> poultry farms<br />
21%<br />
Figure 4.4 Duration <strong>of</strong> us<strong>in</strong>g fan <strong>in</strong> poultry farms<br />
7%<br />
43%<br />
30<br />
2%<br />
12%<br />
14%<br />
6 hrs 7 hrs 8 hrs 9 hrs 10 hrs 12 hrs<br />
Number <strong>of</strong> hours<br />
Source: Author<br />
Out <strong>of</strong> 50 farms surveyed it was found that 42 farms use fan. Out <strong>of</strong> 42 farms us<strong>in</strong>g fan it was<br />
found that 9 farms use fan for 6 hours, 3 farms for 7 hours, 18 farms for 8 hours, 1 farm for 9<br />
hours, 5 farms for 10 hours and 6 farms for 12 hours. <strong>The</strong> wattage <strong>of</strong> fan used <strong>in</strong> the poultry<br />
farm is 55 watts. Interview with the farmers dur<strong>in</strong>g survey reveals that six fans are used for<br />
1000 birds and for the larger farms the number <strong>in</strong>creases proportionally. However, it was also<br />
found that some farms us<strong>in</strong>g less than six fans per 1000 birds. On the other hand, the survey<br />
also reveals that not all the farms are us<strong>in</strong>g fans to ma<strong>in</strong>ta<strong>in</strong> the required temperature <strong>in</strong> the<br />
shed. It was found that 84% farm us<strong>in</strong>g fans and the rest 16% farms are not us<strong>in</strong>g fans at all.<br />
<strong>The</strong>se farms which are not us<strong>in</strong>g fans are comparatively smaller farms and could not afford to<br />
buy it. As a result it reduces the egg production <strong>of</strong> the farm.<br />
Use <strong>of</strong> Brooder<br />
A brooder is a heated conta<strong>in</strong>er used to brood up the chicks (Figure 4.5).
Brooder<br />
Figure 4.5 Show<strong>in</strong>g the brooder<br />
Usually, Electric lamp is used to heat up the brooder. In the study area, it takes two weeks per<br />
brood<strong>in</strong>g. For the first week the temperature required is 95ºF or 35ºC and for second week it<br />
requires 90ºF or 32ºC (Latif, 1981, p, 58). Usually, one brooder conta<strong>in</strong>s four lamps. In<br />
summer due to higher ambient temperature it requires less temperature and 100 watts<br />
<strong>in</strong>candescent lamps are used <strong>in</strong> the brooder. In w<strong>in</strong>ter due to lower ambient temperature 200<br />
watts lamps are used <strong>in</strong> the brooder. However, there is no specific time period for brood<strong>in</strong>g <strong>in</strong><br />
the year. It depends on the situation <strong>of</strong> the farm. Whenever farms need new chicks it broods.<br />
Dur<strong>in</strong>g brood<strong>in</strong>g it needs cont<strong>in</strong>uous 24 hours heat<strong>in</strong>g. Number <strong>of</strong> brooders and times <strong>of</strong><br />
brood<strong>in</strong>g per year <strong>in</strong> a poultry farm depends on the size <strong>of</strong> the farm. While the number <strong>of</strong><br />
brooders is higher, the times <strong>of</strong> brood<strong>in</strong>g per year is lower. For example: one 5000 birds’<br />
farm has eight brooders and it broods two times a year. On the other hand another 5000 birds’<br />
farm has four brooders and it broods three times a year. Besides us<strong>in</strong>g electricity <strong>in</strong> the<br />
brooder it was also found <strong>in</strong> Mymens<strong>in</strong>gh district that one farm is us<strong>in</strong>g biogas directly to<br />
heat up the brooder. So it is possible to use other forms <strong>of</strong> energy for brood<strong>in</strong>g.<br />
Use <strong>of</strong> Electric Pump<br />
Water supply is required <strong>in</strong> the poultry farm to feed the birds and for clean<strong>in</strong>g purpose. For<br />
water supply the poultry farms use electric pump or hand tube well (Figure 4.6).<br />
31<br />
Brooder<br />
house<br />
Source: Author
Figure 4.6 Show<strong>in</strong>g Electric Pump and Hand Tube Well<br />
<strong>The</strong> survey reveals that about 60%<br />
farms use electric pump for water<br />
supply and the 40% farms depends<br />
on hand tube well. <strong>The</strong>se farms<br />
us<strong>in</strong>g hand tube well are<br />
comparatively smaller farms and<br />
could not afford to buy an electric<br />
pump.<br />
Hand Tube Well Electric Pump<br />
<strong>The</strong> capacity <strong>of</strong> electric pumps<br />
Source: Author<br />
used <strong>in</strong> the poultry farms ranges<br />
<strong>from</strong> 0.5 HP to 3 HP depend<strong>in</strong>g on the size <strong>of</strong> the farm and the daily operation <strong>of</strong> pump<br />
ranges <strong>from</strong> one hour to three hours. However it was also found that some smaller farms have<br />
higher capacity <strong>of</strong> pump than the larger farms. <strong>The</strong>refore pumps used <strong>in</strong> the poultry farm<br />
should be designed properly to reduce the <strong>in</strong>vestment cost and the energy consumption as<br />
well.<br />
4.1.2 Daily <strong>Electricity</strong> Consumption Pattern<br />
Usually, electricity consumption <strong>in</strong> summer starts <strong>in</strong> the morn<strong>in</strong>g at 10 am with the operation<br />
<strong>of</strong> fans and water pumps and sometimes cont<strong>in</strong>ues until 10 pm <strong>in</strong> the even<strong>in</strong>g. <strong>The</strong> operation<br />
<strong>of</strong> fan varies as shown <strong>in</strong> Figure 4.4. For the daily consumption pattern the use <strong>of</strong> fan is<br />
considered eight hours as the maximum farms use the fan for this period. <strong>The</strong> use <strong>of</strong> brooder<br />
is not considered <strong>in</strong> the daily energy consumption pattern as it is not a daily phenomenon.<br />
Brood<strong>in</strong>g period varies <strong>from</strong> 15 days to 90 days a year depend<strong>in</strong>g on the farm. In w<strong>in</strong>ter fans<br />
are not used due to lower ambient temperature. <strong>The</strong>refore <strong>in</strong> w<strong>in</strong>ter electricity consumption is<br />
less than <strong>in</strong> summer. Figure 4.7 and Figure 4.8 shows the daily energy consumption pattern<br />
<strong>of</strong> a 5000 birds poultry farm <strong>in</strong> summer and w<strong>in</strong>ter respectively. This farm uses 50 <strong>of</strong> 100<br />
watts <strong>in</strong>candescent lamp, 30 fans <strong>of</strong> 55 watts and a water pump <strong>of</strong> 1.5 HP. <strong>The</strong> electricity<br />
consumption for the brooder was not considered here. <strong>The</strong> energy consumption status <strong>of</strong><br />
different farms accord<strong>in</strong>g to their size is shown <strong>in</strong> Appendix 4.<br />
32
KW<br />
KW<br />
6<br />
5<br />
4<br />
3<br />
2<br />
1<br />
0<br />
6<br />
5<br />
4<br />
3<br />
2<br />
1<br />
0<br />
Figure 4.7 <strong>The</strong> daily electricity consumption pattern <strong>in</strong> summer<br />
0 1 2 3 4 5 6 7 8 9 10 11 12 13 14 15 16 17 18 19 20 21 22 23 24<br />
33<br />
Hours<br />
Figure 4.8 <strong>The</strong> daily energy consumption pattern <strong>in</strong> w<strong>in</strong>ter<br />
Source: Author<br />
0 1 2 3 4 5 6 7 8 9 10 11 12 13 14 15 16 17 18 19 20 21 22 23 24<br />
Hours<br />
4.1.3 <strong>Electricity</strong> Deficit and the Use <strong>of</strong> Back Up System<br />
Source: Author<br />
Power outage or load shedd<strong>in</strong>g is a regular phenomenon <strong>in</strong> Gazipur district. <strong>The</strong> poultry<br />
farms face enormous load shedd<strong>in</strong>g or power outage every day. 100% <strong>of</strong> the poultry farms<br />
experience load shedd<strong>in</strong>g everyday. However, the duration <strong>of</strong> load shedd<strong>in</strong>g varies <strong>from</strong> three<br />
hours to seven hours <strong>in</strong> a day. It can happen any time through out the day but mostly it<br />
happens <strong>in</strong> the even<strong>in</strong>g dur<strong>in</strong>g the country peak hour (17:00 pm to 23:00 pm). Figure 4.9<br />
shows the percentage <strong>of</strong> load shedd<strong>in</strong>g duration <strong>in</strong> the poultry farms.
% <strong>of</strong> poultry farm<br />
12%<br />
Figure 4.9 Duration <strong>of</strong> load shedd<strong>in</strong>g frequency<br />
58%<br />
Percentage<br />
34<br />
4%<br />
26%<br />
3 hr 4 hr 5 hr 7 hr<br />
Hours<br />
Source: Author<br />
To ma<strong>in</strong>ta<strong>in</strong> the optimum production <strong>of</strong> the poultry farm it needs a back up system to provide<br />
electricity dur<strong>in</strong>g load shedd<strong>in</strong>g. However, only 30% farm has back up system to provide<br />
electricity dur<strong>in</strong>g power cuts. <strong>The</strong> rest 70% farm does not have any back up system because<br />
they could not afford it. It was found that only three farms uses biogas generator as back up<br />
system whereas the rest uses diesel generator for the same. Usually the farm has a capacity <strong>of</strong><br />
more than 4000 birds uses the back up system. In contrast, some smaller farms also have back<br />
up systems but they don’t use them as back up dur<strong>in</strong>g power cut because <strong>of</strong> the high price <strong>of</strong><br />
diesel. <strong>The</strong>y use them only dur<strong>in</strong>g brood<strong>in</strong>g when it needs 24 hours energy supply for the<br />
chicks. Figure 4.10 shows the percentage <strong>of</strong> back up system accord<strong>in</strong>g to different size <strong>of</strong><br />
poultry farm.<br />
% <strong>of</strong> back up system<br />
0%<br />
Figure 4.10 Percentage <strong>of</strong> back up system<br />
7%<br />
21%<br />
40%<br />
100%<br />
4.2 EXISTING UTILIZATION OF OTHER ENERGY<br />
4.2.1 Use <strong>of</strong> Biogas + Size <strong>of</strong> Exist<strong>in</strong>g Biogas Plant<br />
Use <strong>of</strong> Biogas<br />
<strong>The</strong> biogas produced <strong>in</strong> different poultry farms is ma<strong>in</strong>ly used for household cook<strong>in</strong>g as the<br />
farms are located near to the house. Only three farms use biogas both for produc<strong>in</strong>g<br />
electricity and thermal purpose. In these farms the biogas plant and generator to produce<br />
electricity was provided by Grameen Shakti on micro credit. <strong>The</strong>se three farms are located<br />
near a growth center and sell biogas to adjacent households and to commercial tea stalls as<br />
well. <strong>The</strong> <strong>in</strong>come <strong>from</strong> sell<strong>in</strong>g biogas ranges <strong>from</strong> 2900 BDT to 4000 BDT per month.<br />
Interest<strong>in</strong>gly, this <strong>in</strong>come is a bit higher than the monthly <strong>in</strong>stallment cost for the <strong>in</strong>stallation<br />
<strong>of</strong> biogas plant and generator. <strong>The</strong>re is no practice <strong>of</strong> sell<strong>in</strong>g <strong>of</strong> electricity <strong>from</strong> biogas plant<br />
through the so called m<strong>in</strong>i grid. Some other farms also sell biogas to the adjacent households<br />
and the <strong>in</strong>come varies fro 400 BDT to 1200 BDT. <strong>The</strong> quantity <strong>of</strong> sold biogas is not<br />
measured any way. Farms sell<strong>in</strong>g biogas at 400 BDT per household connection which is<br />
almost same as for the natural gas connection with<strong>in</strong> the natural gas network <strong>in</strong> the country.<br />
However most <strong>of</strong> the farms do not have market to sell biogas. Only About 38% farm can sell<br />
their biogas to at least one customer and the rest 62% does not have any market to sell it. <strong>The</strong><br />
farms which can not sell biogas use it for their own cook<strong>in</strong>g purpose. At the same time these<br />
farms consume electricity <strong>from</strong> grid or some times <strong>from</strong> diesel generator to run the <strong>in</strong>dustry<br />
and for household as well. So there is a possibility to use this source <strong>of</strong> biogas <strong>from</strong> poultry<br />
waste or dropp<strong>in</strong>g to produce electricity locally.<br />
Regard<strong>in</strong>g sav<strong>in</strong>g money <strong>from</strong> us<strong>in</strong>g biogas for cook<strong>in</strong>g, only 12% respondents save money<br />
<strong>from</strong> buy<strong>in</strong>g wood fuel or Liquid Petroleum Gas (LPG). <strong>The</strong> rest does not save any money<br />
because before us<strong>in</strong>g biogas they used dry leaves, branches <strong>of</strong> trees, twigs etc which were<br />
free <strong>of</strong> cost.<br />
Size <strong>of</strong> <strong>The</strong> Exist<strong>in</strong>g Biogas Plant<br />
<strong>The</strong>oretically, the size <strong>of</strong> the biogas plant depends on the size <strong>of</strong> poultry farm. <strong>The</strong> larger<br />
farms should have a larger biogas plant and the smaller farm should have a smaller one.<br />
However, it was found <strong>from</strong> the survey that some smaller farms have larger biogas plants as<br />
compared to the larger farms. For <strong>in</strong>stance, one 5000 bird’s farm has a 6 m 3 biogas plant<br />
whereas one 2000 bird’s farm has a 9 m 3 biogas plant. <strong>The</strong> reason could be to make biogas<br />
plant f<strong>in</strong>ancially viable as the aim <strong>of</strong> <strong>in</strong>stall<strong>in</strong>g biogas plant was for cook<strong>in</strong>g only. <strong>The</strong><br />
35
geographical location <strong>of</strong> 2000 birds’ farm made it f<strong>in</strong>ancially feasible as it is located near the<br />
growth center where it has a potential market to sell biogas. On the other hand the 5000 birds’<br />
farm does not have any market to sell biogas and hence the size is limited for its own<br />
consumption to reduce the construction cost. Most <strong>of</strong> the biogas plants are not constructed at<br />
its total potential. That means most <strong>of</strong> the farms are not us<strong>in</strong>g its total raw material or poultry<br />
dropp<strong>in</strong>g for the biogas production. Figure 4.11 shows the exist<strong>in</strong>g size <strong>of</strong> biogas plant as a<br />
percentage <strong>of</strong> total potential <strong>in</strong> different poultry farms.<br />
Figure 4.11 Exist<strong>in</strong>g size <strong>of</strong> biogas plant as a percentage <strong>of</strong> total potential<br />
19%<br />
19%<br />
36<br />
31%<br />
23%<br />
8%<br />
the slurry as fertilizer because the farmers are not aware <strong>of</strong> the benefit <strong>of</strong> us<strong>in</strong>g biogas slurry.<br />
<strong>The</strong> study reveals that currently there is no market <strong>of</strong> biogas slurry as organic fertilizer.<br />
However, there is no standard specification <strong>of</strong> organic fertilizer <strong>in</strong> the country to market it<br />
and it is not allowed to market the biogas slurry as organic fertilizer without patent. So the<br />
exist<strong>in</strong>g law and lack <strong>of</strong> awareness are the two h<strong>in</strong>der<strong>in</strong>g forces for the market<strong>in</strong>g <strong>of</strong> biogas<br />
slurry as organic fertilizer.<br />
On the contrary, few big poultry farms are do<strong>in</strong>g commercial market<strong>in</strong>g <strong>of</strong> dried slurry as<br />
organic fertilizer. For example, Faridpur Muslim Mission situated <strong>in</strong> Faridpur district sells<br />
dried slurry at 6.66 BDT per kg which is dried by bio gas and Bogra <strong>Poultry</strong> Complex<br />
situated <strong>in</strong> Bogra district sells sun dried slurry at 0.80 BDT per kg which is dried naturally<br />
under sun.<br />
Disposal <strong>of</strong> <strong>Poultry</strong> <strong>Waste</strong><br />
It was found that there is no slaughter house <strong>in</strong> the poultry farms. So the only type <strong>of</strong> poultry<br />
waste is <strong>from</strong> poultry dropp<strong>in</strong>gs. <strong>The</strong> farm hav<strong>in</strong>g biogas plant is supposed to dispose its<br />
waste <strong>in</strong>to the biogas plant. However, most <strong>of</strong> the farms put the waste partly <strong>in</strong>to the biogas<br />
digester as the biogas plants are not designed for the total potential <strong>of</strong> dropp<strong>in</strong>gs. <strong>The</strong> rest is<br />
disposed <strong>in</strong>to the environment or taken away by local fish farm as fish feed. On the other<br />
hand, the farm which does not have any biogas plant usually dispose the dropp<strong>in</strong>gs to the<br />
environment or it is taken away by the local fish farm. It was found that the poultry waste <strong>of</strong><br />
about 60% farm is taken away by fish farm and the rest 40% is disposed <strong>in</strong> to the<br />
environment. In dispos<strong>in</strong>g the waste <strong>in</strong>to the environment either a ditch is dug or it is dumped<br />
on the ground (Figure 4.12). <strong>The</strong> waste disposed <strong>in</strong>to the environment creates a bad smell <strong>of</strong><br />
ammonia gas. To reduce the bad smell the farmers use bleach<strong>in</strong>g powder, lime etc. <strong>The</strong> cost<br />
to reduce the bad smell is not significant. However, the amount <strong>of</strong> reduction <strong>of</strong> bad smell is<br />
also not significant.<br />
Figure 4.12 Disposal <strong>of</strong> poultry dropp<strong>in</strong>gs<br />
Fish Farm Ditch Dumped on Ground<br />
37<br />
Source: Author
4.3 Attitudes and Barriers<br />
Attitudes<br />
<strong>The</strong> poultry owners are very much positive to produce electricity <strong>from</strong> poultry waste. It was<br />
found that 86% respondents are <strong>in</strong>terested to produce electricity <strong>from</strong> poultry waste. People<br />
are <strong>in</strong>terested because they th<strong>in</strong>k it will be cheaper to produce electricity as the biogas is free<br />
<strong>of</strong> cost. On the other hand us<strong>in</strong>g diesel generator is costly as the price <strong>of</strong> diesel is <strong>in</strong>creas<strong>in</strong>g<br />
every year. People need alternatives to provide un<strong>in</strong>terrupted power supply as there is<br />
enormous power outage which reduces their production. Moreover, it will reduce the load on<br />
national grid and benefits the country as a whole. However, they will not produce electricity<br />
<strong>from</strong> poultry waste if it costs more than that <strong>of</strong> grid electricity. In contrast, about 14%<br />
respondents are not <strong>in</strong>terested to produce electricity <strong>from</strong> poultry waste. Some people are not<br />
<strong>in</strong>terested because <strong>of</strong> the <strong>in</strong>itial <strong>in</strong>vestment cost. Where as some other th<strong>in</strong>ks power shortage<br />
does not hamper their production and some people are not <strong>in</strong>terested due to the geographical<br />
location <strong>of</strong> the farm which is located <strong>in</strong> an isolated place and difficult to sell electricity or<br />
biogas. It was also found that about 23% respondents are not aware <strong>of</strong> the possibility <strong>of</strong><br />
produc<strong>in</strong>g electricity <strong>from</strong> poultry waste.<br />
Barriers<br />
One <strong>of</strong> the ma<strong>in</strong> h<strong>in</strong>drance forces <strong>of</strong> dissem<strong>in</strong>at<strong>in</strong>g the technology is the technology itself.<br />
<strong>The</strong>re is no proven technology yet <strong>in</strong> the country. <strong>The</strong> farms which are produc<strong>in</strong>g electricity<br />
<strong>from</strong> poultry waste <strong>in</strong> the country are fac<strong>in</strong>g problems to operate the system. To dissem<strong>in</strong>ate<br />
the technology it needs a proven and susta<strong>in</strong>able technology. <strong>The</strong> <strong>in</strong>vestment cost for<br />
<strong>in</strong>stall<strong>in</strong>g the system is another barrier. All the farm owners are not f<strong>in</strong>ancially sound to buy<br />
the system. <strong>The</strong>re is no government subsidy or <strong>in</strong>centive to dissem<strong>in</strong>ate the technology.<br />
Moreover, lack <strong>of</strong> awareness <strong>of</strong> the poultry owner regard<strong>in</strong>g the technology is another ma<strong>in</strong><br />
h<strong>in</strong>drance.<br />
38
CHAPTER 5 PRESENT STATUS OF ELECTRICITY<br />
GENERATION FROM POULTRY WASTE<br />
<strong>Electricity</strong> production <strong>from</strong> poultry waste is relatively new <strong>in</strong> Bangladeshi. Most <strong>of</strong> the farms<br />
produc<strong>in</strong>g electricity <strong>from</strong> poultry waste have <strong>in</strong>stalled their electricity generation systems<br />
s<strong>in</strong>ce 2005. However, Bogra <strong>Poultry</strong> Complex situated <strong>in</strong> Bogra district <strong>in</strong>stalled its system <strong>in</strong><br />
the late 90’s. This is the only poultry farm <strong>in</strong> the country which meets its electricity demand<br />
<strong>from</strong> own generation. This farm is <strong>in</strong>dependent <strong>of</strong> grid electricity although the farm is located<br />
under REB grid network. Dur<strong>in</strong>g the field visit, it was found that Bogra <strong>Poultry</strong> Complex is<br />
us<strong>in</strong>g different technology than what other farms are us<strong>in</strong>g at present <strong>in</strong> the country. This<br />
farm is us<strong>in</strong>g two Toyota eng<strong>in</strong>es <strong>of</strong> 1500 cc capacity with a dynamo. <strong>The</strong> maximum output<br />
<strong>of</strong> the plant is 7.5 kW. <strong>The</strong> eng<strong>in</strong>es used <strong>in</strong> the plant are old car eng<strong>in</strong>es and these eng<strong>in</strong>es are<br />
runn<strong>in</strong>g alternatively. It was found that biogas <strong>from</strong> the digester is fed <strong>in</strong>to the eng<strong>in</strong>e only<br />
through a moisture filter unit to remove the moisture content <strong>in</strong> the gas. <strong>The</strong>re is no device to<br />
remove hydrogen sulfide (H2S). <strong>The</strong> Figure 5.1 and 5.2 show the different components used<br />
<strong>in</strong> the power plant <strong>in</strong> Bogra <strong>Poultry</strong> complex.<br />
Figure 5.1 Show<strong>in</strong>g different components <strong>of</strong> power plant at Bogra <strong>Poultry</strong> Complex<br />
Gear<br />
box<br />
Belt-pulley<br />
Toyota eng<strong>in</strong>e<br />
Dynamo<br />
39<br />
Control panel<br />
Source: Author
Figure 5.2 Show<strong>in</strong>g different components <strong>of</strong> power plant at Bogra <strong>Poultry</strong> Complex<br />
Battery<br />
Fly wheel<br />
Toyota eng<strong>in</strong>e<br />
Faridpur Muslim Mission uses 3 <strong>of</strong> 4.5 kW natural gas generators. <strong>The</strong> plant was <strong>in</strong>stalled <strong>in</strong><br />
the year 2005. <strong>The</strong> generators used <strong>in</strong> the plant are Honda Model: EM6000GN, s<strong>in</strong>gle phase<br />
and generate 220 V at 50 HZ. It runs 2 generators at a time and the duration is maximum 4<br />
hours a day only when there is power outage. <strong>The</strong> generator can not run more than 4 hours a<br />
day. In this farm the biogas comes <strong>from</strong> the digester through a Polyv<strong>in</strong>yl chloride (PVC)<br />
flexible pipe to the generators. From the biogas plant the PVC pipe is elevated up to a certa<strong>in</strong><br />
level so that the moisture condensed <strong>in</strong> the pipe can go back to the digester aga<strong>in</strong>. This allows<br />
it to remove a part <strong>of</strong> the moisture content <strong>in</strong> the biogas. To remove the rest <strong>of</strong> the moisture<br />
content <strong>in</strong> the biogas it passes through a moisture filter before enter<strong>in</strong>g the generator which is<br />
placed near to the generator set. <strong>The</strong> moisture filter conta<strong>in</strong>s two sponges on the two sides<br />
and some silica gel <strong>in</strong> between. Like Bogra <strong>Poultry</strong> Complex this plant also does not have<br />
any H2S removal system. Figure 5.3 shows the moisture filter and the generator set used <strong>in</strong><br />
the plant.<br />
40<br />
Moisture filter<br />
Gear box<br />
Exhaust<br />
Source: Author
Figure 5.3 Moisture filter and Generator set <strong>in</strong> Faridpur Muslim Mission<br />
Miosture<br />
filter<br />
5.1 Some Properties <strong>of</strong> Biogas:<br />
5.1.1 Characteristics <strong>of</strong> Biogas<br />
Biogas is rich <strong>in</strong> methane and can be used to generate heat or electricity. <strong>The</strong> methane content<br />
<strong>in</strong> biogas varies <strong>from</strong> 40% to 60%. <strong>The</strong> calorific value <strong>of</strong> biogas depends on temperature,<br />
pressure and water-vapor content. Water-vapor content <strong>in</strong> biogas depends on temperature and<br />
pressure. <strong>The</strong> heat<strong>in</strong>g value <strong>of</strong> biogas conta<strong>in</strong><strong>in</strong>g 60% methane is about 20-22 MJ/m 3 or 6<br />
kWh/m 3 . <strong>The</strong> octane rat<strong>in</strong>g is 130. <strong>The</strong> auto ignition temperature <strong>of</strong> methane is 650-750º<br />
Celsius. <strong>The</strong> density <strong>of</strong> biogas is 1.2 g/l. (Rehl<strong>in</strong>g, 2006, p. 9). <strong>The</strong> follow<strong>in</strong>g Table 5.1 gives<br />
the different heat<strong>in</strong>g values <strong>of</strong> different commercial fuels and its’ corresponds to biogas<br />
conta<strong>in</strong><strong>in</strong>g 60% methane.<br />
Table 5.1 Heat<strong>in</strong>g values <strong>of</strong> commercial fuels and its correspond to Biogas<br />
Fuel Heat<strong>in</strong>g Value Biogas Natural Gas/ Propen gas/ m3<br />
/ m3 m3<br />
1 m3 biogas<br />
1 m3 Natural<br />
22.1 MJ/m3 Correspond to 1 0.7 0.48<br />
gas 33.5 MJ/m3 Correspond to 1.5 1 0.73<br />
1 m3 Propane 46 MJ/ m3 Correspond to 2.1 1.3 1<br />
1 l Diesel 36 MJ/l Correspond to 1.6 1 0.78<br />
1 l Kerosene 30.5 MJ/l Correspond to 1.4 0.9 0.66<br />
1 kg Charcoal<br />
1 kWh<br />
29 MJ/kg Correspond to 1.3 0.8 0.6<br />
electricity 3.6 MJ/kWh Correspond to 0.2 0.1 0.07<br />
Source: Rehl<strong>in</strong>g, 2006, p. 9<br />
41<br />
Generator<br />
Source: Author
<strong>The</strong> biogas <strong>from</strong> the poultry waste conta<strong>in</strong>s methane, carbon dioxide, hydrogen sulfide,<br />
nitrogen and moisture. Table 5.2 shows the chromatographic test results <strong>of</strong> dry biogas<br />
produced <strong>from</strong> poultry litter <strong>in</strong> a biogas plant at Maona <strong>in</strong> Gazipur district. <strong>The</strong> biogas sample<br />
was tested by Institute <strong>of</strong> Fuel Research and Development , BCSIR.<br />
Table 5.2 Test results <strong>of</strong> dry biogas produced <strong>from</strong> poultry litter<br />
Sl. No. Specification Result<br />
1 Methane 58.72%<br />
2 Carbon Dioxide 38.25%<br />
3 Hydrogen Sulfide 0.35% or 3500 ppm<br />
4 Nitrogen 2.68%<br />
Source: BCAS, 2005, p. 32<br />
Unlike natural gas it has high percentage <strong>of</strong> carbon dioxide and hydrogen sulfide. H2S is toxic<br />
and corrosive and when comb<strong>in</strong>es with moisture it forms sulphuric acids or sulphurous that<br />
can corrode all metal parts that come <strong>in</strong> its contact. CO2 has a volumetric disadvantage when<br />
used <strong>in</strong> an eng<strong>in</strong>e for combustion. <strong>The</strong> follow<strong>in</strong>g paragraph will discuss about the impact <strong>of</strong><br />
H2S and CO2 <strong>in</strong> produc<strong>in</strong>g electricity.<br />
5.1.2 Impact <strong>of</strong> H2S<br />
In Bangladesh, H2S presence <strong>in</strong> biogas <strong>from</strong> poultry waste was found <strong>from</strong> 0.30% (3,000<br />
ppm) to 0.8% (8,000 ppm) 25 . However, the tolerable level <strong>of</strong> H2S <strong>in</strong> pipe l<strong>in</strong>e quality natural<br />
gas is 4 ppm. H2S is severely corrosive to all metals associated with the transportation <strong>of</strong> gas<br />
and metal parts <strong>of</strong> eng<strong>in</strong>e which is driven by such gas conta<strong>in</strong><strong>in</strong>g H2S. Moreover it is even<br />
corrosive to sta<strong>in</strong>less steel. This problem may lead to the failure <strong>of</strong> the system. On<br />
combustion, H2S forms SO2 which is also toxic and corrosive (Kumar, 1987, pp. 255-256).<br />
<strong>The</strong>refore to make the system susta<strong>in</strong>able and user friendly a H2S removal system is required<br />
<strong>in</strong> produc<strong>in</strong>g electricity <strong>from</strong> biogas.<br />
5.1.3 Impact <strong>of</strong> CO2<br />
In biogas <strong>from</strong> poultry waste CO2 presence is about 40%. CO2 has no heat<strong>in</strong>g value and its<br />
removal is required to <strong>in</strong>crease the energy <strong>in</strong>tensity <strong>of</strong> the gas per unit volume. Sometimes<br />
CO2 removal is also required because it forms a complex called CO2..CO2 which is quite<br />
corrosive <strong>in</strong> presence <strong>of</strong> water. In addition CO2 removal is necessary for gas used <strong>in</strong><br />
25 Interview by author with Mr. M. A. G<strong>of</strong>ran, Grameen Shakti Dhaka, 21.05.2007<br />
42
cryogenic plant to prevent the solidification <strong>of</strong> CO2 (Kumar, 1987, p. 256). For power<br />
generation, CO2 presence <strong>in</strong> biogas reduces the air fuel ratio <strong>of</strong> the eng<strong>in</strong>e because to supply<br />
the same thermal <strong>in</strong>put the system requires more biogas. Thus reduces air flow <strong>in</strong>to the<br />
eng<strong>in</strong>e under a constant volume. Limited air flow <strong>in</strong>to the eng<strong>in</strong>e reduces the maximum<br />
output <strong>of</strong> the eng<strong>in</strong>e. However the overall efficiency <strong>of</strong> the eng<strong>in</strong>e does not change too much.<br />
(Nazn<strong>in</strong>, 2006, pp. 25-27)<br />
Hence, for small scale power generation plant CO2 removal is not mandatory.<br />
5.2 Status <strong>of</strong> Technology Used <strong>in</strong> GTZ Flagship Project at Raj <strong>Poultry</strong> Farm<br />
To overcome the technical drawbacks <strong>of</strong> the system for produc<strong>in</strong>g electricity <strong>from</strong> poultry<br />
waste GTZ Bangladesh has <strong>in</strong>stalled a flagship project at Raj <strong>Poultry</strong> Farm which is situated<br />
<strong>in</strong> Faridpur district. <strong>The</strong> farm has 15000 birds <strong>from</strong> which it can produce 105 m 3 biogas per<br />
day. <strong>The</strong> farm has 3 X 35 m 3 or total 105 m 3 biogas plant. GTZ <strong>in</strong>stalled 2 X 5 kW i.e. total<br />
10 kW generators to produce electricity. GTZ considered it as a test case and they will go for<br />
replication after 6 months observation. <strong>The</strong> details <strong>of</strong> GTZ system is given <strong>in</strong> the follow<strong>in</strong>gs.<br />
In this system the biogas <strong>from</strong> the digester passes through a H2S removal unit where the H2S<br />
content <strong>in</strong> the biogas is reduced to an acceptable limit (250 ppm) 26 . After the H2S removal<br />
unit, the gas passes through a moisture removal unit where the gas is freed <strong>from</strong> moisture.<br />
<strong>The</strong>n the gas enters <strong>in</strong>to the generator. GTZ also considered a regeneration system to<br />
regenerate the material used <strong>in</strong> the H2S removal unit and moisture removal unit. For<br />
regeneration the system uses the exhaust gas <strong>of</strong> the generator. <strong>The</strong> flow diagram <strong>of</strong> GTZ<br />
Flagship project to produce electricity <strong>from</strong> poultry waste is given Figure 5.4.<br />
26 Interview by author with Dr. Khursheed-Ul-Islam, GTZ Dhaka, 17.06.2007<br />
43
Dropp<strong>in</strong>gs<br />
Figure 5.4 Flow diagram <strong>of</strong> GTZ Flagship Project at Raj <strong>Poultry</strong> Farm<br />
removal<br />
unit<br />
Biogas H2S<br />
<strong>Poultry</strong><br />
Shed<br />
H2S free<br />
Biogas<br />
Biogas Plant<br />
(Fixed Dome)<br />
Source: Author based on <strong>in</strong>terview by author with Dr. Khursheed-Ul-Islam, GTZ Dhaka,<br />
17.06.2007 and filed visit.<br />
5.2.1 Biogas plant<br />
Hot Air<br />
Moisture<br />
removal<br />
unit<br />
Hot Air<br />
<strong>Electricity</strong><br />
<strong>The</strong>re are 3 biogas plants <strong>in</strong> the poultry farm with a capacity <strong>of</strong> 35 m 3 gas production per day<br />
each. <strong>The</strong> plants are fixed dome type. A Fixed dome plant is an enclosed dome consists <strong>of</strong> a<br />
digester and a gas chamber which is fixed and non- movable. <strong>The</strong> gas is stored <strong>in</strong> the upper<br />
part <strong>of</strong> the digester. <strong>The</strong> normal practice <strong>in</strong> Bangladesh is that the volume <strong>of</strong> the gas chamber<br />
is one-third <strong>of</strong> the total volume <strong>of</strong> the dome. <strong>The</strong> capacity <strong>of</strong> the plant is def<strong>in</strong>ed by the<br />
volume <strong>of</strong> gas production per day. When gas production beg<strong>in</strong>s the slurry is displaced <strong>in</strong>to<br />
the compensat<strong>in</strong>g tank. Gas pressure <strong>in</strong>creases with the volume <strong>of</strong> gas stored. A pressure<br />
regulator is required to ma<strong>in</strong>ta<strong>in</strong> a constant pressure <strong>of</strong> gas flow to the eng<strong>in</strong>e. <strong>The</strong><br />
advantages <strong>of</strong> fixed dome plant is its low construction cost, no mov<strong>in</strong>g parts, longer life (20<br />
44<br />
Moisture and<br />
H2S free<br />
Biogas<br />
Generator<br />
Fresh air<br />
Exhaust gas<br />
Heat<br />
exchanger<br />
Compressor<br />
Exhaust gas
years or more) and afford<strong>in</strong>g protection <strong>from</strong> w<strong>in</strong>ter cold and sav<strong>in</strong>g space. On the other<br />
hand the disadvantages are porosity or cracks <strong>of</strong> the plant, low gas temperature, and<br />
fluctuation <strong>of</strong> gas pressure (Rehl<strong>in</strong>g, 2006, p. 34). However, the construction <strong>of</strong> the biogas<br />
plant <strong>in</strong> the poultry farm was beyond the battery limit <strong>of</strong> GTZ flagship project. <strong>The</strong> Figure 5.5<br />
shows the biogas plants at Raj <strong>Poultry</strong> Farm.<br />
Inlet<br />
Figure 5.5 Biogas plants <strong>in</strong> Raj <strong>Poultry</strong> Farm<br />
All three plants are <strong>in</strong>terconnected by Galvanized Iron pipe and at the top <strong>of</strong> each digester<br />
there is a pressure gauge to measure the pressure <strong>of</strong> the gas chamber.<br />
5.2.2 H2S Removal Unit<br />
Dome covered with earth<br />
<strong>The</strong> biogas conta<strong>in</strong><strong>in</strong>g H2S, moisture, CO2 and other constituents comes to the H2S removal<br />
unit <strong>from</strong> biogas plant through a PVC flexible pipe. <strong>The</strong> Iron Sponge process is used to<br />
remove H2S. <strong>The</strong> unit consists <strong>of</strong> two gas tight transparent cyl<strong>in</strong>drical plastic tanks. <strong>The</strong> gas<br />
conta<strong>in</strong><strong>in</strong>g H2S or the sour gas is passed through a bed <strong>of</strong> red oxide <strong>in</strong> the form <strong>of</strong> steel wool.<br />
<strong>The</strong> steel wool basically is the rusted iron chips found <strong>in</strong> the lathe workshop. <strong>The</strong> steel wool<br />
bed is placed at the bottom <strong>of</strong> the towers. <strong>The</strong> gas enters at the bottom <strong>of</strong> the tower, then<br />
passes through the bed and f<strong>in</strong>ally comes out on the top <strong>of</strong> the tower. <strong>The</strong> dimension <strong>of</strong> each<br />
transparent tank used <strong>in</strong> the plant is 1.3 ft dia X 3.2 ft height i.e. 4.25 ft 3 or equivalent to 0.12<br />
m 3 . <strong>The</strong> amount <strong>of</strong> steel wool <strong>in</strong> a batch is 8 kg and the life <strong>of</strong> the bed is 7 days. Almost onethird<br />
<strong>of</strong> the tower is full <strong>of</strong> red oxide. <strong>The</strong> cost <strong>of</strong> steel wool is 20 BDT per kg <strong>in</strong> the local<br />
45<br />
Hydraulic chamber<br />
Source: Author
market 27 . At present the steel wool is regenerated by expos<strong>in</strong>g it air under sun. Two towers<br />
are used to keep the operation un<strong>in</strong>terrupted so that one tower is on stream when the other is<br />
be<strong>in</strong>g charged. Figure 5.6 shows the H2S removal unit <strong>in</strong>stalled <strong>in</strong> Raj <strong>Poultry</strong> Farm.<br />
Transparent<br />
tower<br />
Steel wool<br />
Figure 5.6 Shows the H2S removal unit.<br />
<strong>The</strong> red oxide has a high aff<strong>in</strong>ity to react with H2S. <strong>The</strong> chemical reaction <strong>of</strong> red oxide with<br />
H2S is given <strong>in</strong> the follow<strong>in</strong>g equation.<br />
Fe2O3 + H2S = Fe2S3 + 3H2O (Mann<strong>in</strong>g and Thompson, 1991, p. 101)<br />
After reaction with H2S the steel wool becomes black iron sulfide. When the black corroded<br />
iron sulfide reaches 75% height <strong>of</strong> the bed, its time to change it and feed a fresh charge. <strong>The</strong><br />
corroded steel wool can be reused after be<strong>in</strong>g oxidized to rust by exposure to air. <strong>The</strong> towers<br />
are transparent so that the change <strong>of</strong> color <strong>of</strong> red oxide is visible. (BCAS, 2005, p. 33)<br />
For cont<strong>in</strong>uous regeneration or revivification <strong>of</strong> steel wool or ferric oxide a small amount <strong>of</strong><br />
air or oxygen is added to the <strong>in</strong>let sour gas stream to oxidize the Fe2S3 back to Fe2O3<br />
immediately the H2S is absorbed. <strong>The</strong> cont<strong>in</strong>uous regeneration reaction is given below.<br />
Fe2S3 + 3 O = Fe2O3 + 3S (Mann<strong>in</strong>g and Thompson, 1991, p. 101)<br />
27 Interview by author with Dr. Khursheed-Ul-Islam, GTZ Dhaka, 17.06.2007<br />
46<br />
Gas outlet<br />
Source: Author<br />
Gas <strong>in</strong>let
<strong>The</strong> temperature <strong>of</strong> the bed should not be more than 120ºF or 48.9ºC. <strong>The</strong> temperature above<br />
120ºF or 48.9ºC leads to the loss <strong>of</strong> the water <strong>of</strong> crystallization <strong>of</strong> the ferric oxide and the bed<br />
becomes very difficult to regenerate. (Kumar, 1987, p. 258)<br />
However, the <strong>in</strong>terview with the operator <strong>of</strong> the plant revealed that the generators cannot run<br />
with full load after few m<strong>in</strong>utes it started. <strong>The</strong> cause may be due to the siltation <strong>of</strong> steel wool<br />
or iron chips <strong>in</strong> the H2S removal unit. As a result gas cannot flow properly to the eng<strong>in</strong>e<br />
though there is enough gas <strong>in</strong> the digester.<br />
5.2.3 Moisture Removal Unit<br />
<strong>The</strong> biogas enters <strong>in</strong>to the moisture removal unit after pass<strong>in</strong>g the H2S removal unit. <strong>The</strong><br />
adsorption dehydration method is used <strong>in</strong> this process. Adsorption dehydration is a process<br />
where a solid desiccant is used for the removal <strong>of</strong> water vapor <strong>from</strong> a gas stream. Adsorption<br />
is a surface phenomenon and all solid surfaces have some ability to adsorb or capture and<br />
hold vapors and liquids on their surface. <strong>The</strong>re are two types <strong>of</strong> adsorption dehydration. One<br />
is chemisorption and the other is physisorption. Chemisorption or chemical adsorption<br />
<strong>in</strong>volves specific chemical (or electrovalent) bond<strong>in</strong>g <strong>of</strong> the gas molecules (or adsorbate) <strong>in</strong> a<br />
monolayer onto the solid surface atoms. On the other hand, physisorption or physical<br />
adsorption is caused by van der waals forces between the gas molecules and the surface thus<br />
form<strong>in</strong>g multi layers <strong>of</strong> adsorbate on the surface. Chemisorption looks like a chemical<br />
reaction between a particular gas and the solid surface. In contrast, physisorption is the<br />
general condensation <strong>of</strong> gas on any surface. (Shikdar, 2005, p. 27)<br />
<strong>The</strong> physisorption or physical adsorption method is used <strong>in</strong> the moisture removal unit. <strong>The</strong>re<br />
are different materials used for this, such as alum<strong>in</strong>a, silica gels, silica-alum<strong>in</strong>a gels and<br />
molecular sieves (ibid, p. 28). In the moisture removal unit silica gel is used as an absorber.<br />
Silica gel is a hard, rugged material with good abrasion resistance characteristics. It is<br />
manufactured by chemical reaction. Silica gel is the product <strong>of</strong> chemical reaction between<br />
sulfuric acid and sodium silicate and consists almost solely <strong>of</strong> silicon dioxide (SiO2). Gels<br />
can reduce the moisture content to 10 ppm and can be regenerated. <strong>The</strong>y adsorb heavy<br />
hydrocarbons and release them easily dur<strong>in</strong>g regeneration. <strong>The</strong> regeneration temperature for<br />
silica gel is 212ºF or equivalent to 100ºC. Silica gel does not react with H2S however; sulfur<br />
can deposit and block their surfaces. So silica gels are useful if the H2S content is less than 5-<br />
6% (ibid, p. 28)<br />
47
In GTZ flagship project, the unit consists <strong>of</strong> 2 small transparent plastic cyl<strong>in</strong>drical tanks. <strong>The</strong><br />
tanks are gas tight as well. Two tanks are used for two different H2S removal unit. One<br />
moisture removal unit is connected with one H2S removal unit. <strong>The</strong> dimension <strong>of</strong> each <strong>of</strong> the<br />
moisture removal tank is 0.5 ft dia X 2 ft height i.e. 0.4 ft 3 or equivalent to 0.01 m 3 . Figure<br />
5.7 shows the moisture removal unit at Raj <strong>Poultry</strong> Farm. 5 kg <strong>of</strong> silica gel is used per batch<br />
and the life <strong>of</strong> one batch <strong>of</strong> silica gel is about 5 months. <strong>The</strong> cost <strong>of</strong> 25 kg silica gel bag is<br />
4000 BDT 28 .<br />
Figure 5.7 Moisture removal unit<br />
However, when the gas is so dry sometimes the moisture removal unit is by passed.<br />
5.2.4 Generator<br />
Two natural gas generators <strong>of</strong> 5 kW each are used <strong>in</strong> the plant to produce electricity <strong>from</strong><br />
poultry waste. <strong>The</strong> biogas <strong>from</strong> the moisture removal unit comes to the generator. <strong>The</strong>re are<br />
two sta<strong>in</strong>less steel ball valves one for each generator are used to control the gas flow to the<br />
generators. <strong>The</strong> generators are Green Power Model: CC 5000 –G-B, s<strong>in</strong>gle phase and could<br />
28 Interview by author with Dr. Khursheed-Ul-Islam, GTZ Dhaka, 17.06.2007<br />
48<br />
Source: Author<br />
Gas outlet<br />
Moisture<br />
removal<br />
tank<br />
Silica gel
generate 230 volt at 50 HZ. <strong>The</strong> generators can run on both LPG and natural gas. LPG is only<br />
used to start up the generator which is later fuelled by biogas. A venturi has been <strong>in</strong>troduced<br />
<strong>in</strong> to the system to enhance the mix<strong>in</strong>g <strong>of</strong> air and fuel for improved combustion. Figure 5.8<br />
shows the generator and venturi at Raj <strong>Poultry</strong> Farm.<br />
Venturi<br />
Generator<br />
Figure 5.8 Shows the generator and venturi<br />
Venturi<br />
5.2.5 Regeneration <strong>of</strong> Steel Wool and Silica Gel<br />
49<br />
Source: Author<br />
For the regeneration <strong>of</strong> steel wool and silica gel needs certa<strong>in</strong> temperature. For steel wool the<br />
required temperature is 48.9ºC and for silica gel it is 100ºC. <strong>The</strong> exhaust gas <strong>of</strong> the eng<strong>in</strong>e at<br />
high temperature is used through a heat exchanger to heat up steel wool and silica gel. A<br />
small compressor is used to supply fresh air <strong>in</strong>to the biogas stream; this air passes through the<br />
heat exchange mechanism to carry the heat <strong>in</strong>to the H2S and moisture removal unit.<br />
5.3 Status <strong>of</strong> Technology used <strong>in</strong> the Study Area:<br />
LPG tank<br />
Like <strong>in</strong> other parts <strong>of</strong> Bangladesh digester technology is used <strong>in</strong> the study area to produce<br />
electricity <strong>from</strong> poultry waste. <strong>The</strong> process used to produce electricity <strong>from</strong> biogas generated<br />
<strong>from</strong> poultry waste is similar to other farms produc<strong>in</strong>g electricity except Bogra <strong>Poultry</strong><br />
Complex <strong>in</strong> Bogra district and GTZ flagship project at Raj <strong>Poultry</strong> Farm <strong>in</strong> Faridpur district.<br />
A fixed dome digester is used to produce biogas <strong>from</strong> poultry waste. <strong>The</strong> poultry dropp<strong>in</strong>g is<br />
directly feed <strong>in</strong>to the <strong>in</strong>let chamber <strong>of</strong> the biogas plant. <strong>The</strong> biogas is then taken away<br />
through a flexible PVC pipe to the generator through a water trap and a small moisture filter<br />
unit to remove the water content <strong>of</strong> the biogas. Figure 5.9 shows the flow diagram <strong>of</strong> the<br />
process used <strong>in</strong> the study area to produce electricity <strong>from</strong> poultry waste.
Figure 5.9 Flow diagram <strong>of</strong> produc<strong>in</strong>g electricity <strong>in</strong> the study area<br />
Biogas<br />
Biogas plant<br />
(Fixed<br />
Dome)<br />
Dropp<strong>in</strong>gs<br />
<strong>Poultry</strong><br />
Shed<br />
Water Trap<br />
50<br />
Biogas<br />
<strong>Electricity</strong><br />
Moisture<br />
Filter Unit<br />
Gas<br />
Generator<br />
Household<br />
Moisture free<br />
Biogas<br />
Source: Author based on field visit<br />
<strong>The</strong>re is no H2S removal unit <strong>in</strong> the process. Only three poultry farms <strong>in</strong> the study area are<br />
currently produc<strong>in</strong>g electricity <strong>from</strong> poultry waste. <strong>The</strong>se all are very small scale generation.<br />
<strong>The</strong> capacity is between 2 kW and 3 kW. All the generators are s<strong>in</strong>gle phase and could<br />
generate 230 Volts at 50 HZ. Different models <strong>of</strong> generators are used <strong>in</strong> the study area.<br />
However the moisture filter is almost similar but different types <strong>of</strong> water trap are used. <strong>The</strong><br />
different components <strong>of</strong> electricity production unit <strong>in</strong> the study area are shown <strong>in</strong> Figure 5.10.<br />
<strong>Electricity</strong>
Water trap<br />
Moisture filter<br />
Figure 5.10 Different components <strong>of</strong> the plant<br />
51<br />
Source: Author<br />
<strong>The</strong> above discussions (Section 5.2 to Section 5.3) satisfy the second research question <strong>of</strong><br />
the study.<br />
5.4 Status <strong>of</strong> Energy <strong>Generation</strong><br />
Generator<br />
Bogra poultry Complex is runn<strong>in</strong>g <strong>in</strong>dependently <strong>of</strong> grid electricity. So the total annual<br />
energy consumption <strong>of</strong> the farm comes <strong>from</strong> own electricity generation plant. <strong>The</strong> farm’s<br />
annual energy consumption is about 19 MWh which produced <strong>from</strong> poultry waste. On the<br />
other hand, all <strong>of</strong> the farms are produc<strong>in</strong>g electricity <strong>from</strong> poultry waste dur<strong>in</strong>g power cut.<br />
Faridpur Muslim Mission runs the generators for about 4 hours a day. Its annual energy<br />
production <strong>from</strong> own generator is about 9.5 MWh. At Raj <strong>Poultry</strong> Farm <strong>in</strong> Faridpur district<br />
the generators are <strong>in</strong> operation for about 4 hours a day. <strong>The</strong> annual energy production is about<br />
11.6 MWh. In the study area all the three farms produc<strong>in</strong>g electricity dur<strong>in</strong>g power outage<br />
and the total annual energy production for these three farms is about 2 MWh.
5.5 Problems Encountered with the Technology (Owners’ View):<br />
Accord<strong>in</strong>g to the owner <strong>of</strong> Bogra <strong>Poultry</strong> Complex, the farm does not face any problem to<br />
operate the system. It needs only regular ma<strong>in</strong>tenance once <strong>in</strong> a year and needs a technician<br />
to operate it. However, the other poultry farms currently produc<strong>in</strong>g electricity <strong>from</strong> poultry<br />
waste are not runn<strong>in</strong>g the system very smoothly. In the country and as well as <strong>in</strong> the study<br />
area the <strong>in</strong>stallation <strong>of</strong> the system is very recent phenomenon. In the study area the system<br />
has been <strong>in</strong>stalled at the end <strong>of</strong> the year 2006 and <strong>in</strong> the beg<strong>in</strong>n<strong>in</strong>g <strong>of</strong> the year 2007. <strong>The</strong><br />
farms are fac<strong>in</strong>g some problems both <strong>in</strong> technical and management po<strong>in</strong>t <strong>of</strong> view.<br />
<strong>The</strong> ma<strong>in</strong> technical problem is to start up the eng<strong>in</strong>e and this is due to the carbon deposition<br />
<strong>in</strong> the spark plug. It needs very frequent servic<strong>in</strong>g <strong>of</strong> the spark plug and the life <strong>of</strong> spark plug<br />
is very short and it needs very frequent replacement. Besides, carbon deposition on the eng<strong>in</strong>e<br />
head is another problem. It also needs frequent servic<strong>in</strong>g. Moreover, tear<strong>in</strong>g and wear<strong>in</strong>g <strong>of</strong><br />
belt and pulley is a problem as well. As it is not a long experience, the impact <strong>of</strong> H2S such as<br />
rust<strong>in</strong>g, corrosion, fatality <strong>of</strong> eng<strong>in</strong>e etc. could not be identified yet.<br />
On the other hand <strong>from</strong> management po<strong>in</strong>t <strong>of</strong> view the poultry farms encounter some<br />
problems. <strong>The</strong>re is no supply <strong>of</strong> spare parts. <strong>The</strong> generator suppliers do not provide the spare<br />
parts required. If there is any problem with the eng<strong>in</strong>e part it can not be replaced with<strong>in</strong> a<br />
short time. So the eng<strong>in</strong>e faces some idle time. <strong>The</strong>re are no people with technical know how<br />
<strong>in</strong> the farm. So they need to hire a mechanic or technician <strong>from</strong> outside to service the eng<strong>in</strong>e<br />
and by this they <strong>in</strong>cur further expenses.<br />
<strong>The</strong>re is one poultry farm <strong>in</strong> Mymens<strong>in</strong>gh district which has a 1.5 kW natural gas generator<br />
to produce electricity <strong>from</strong> biogas. Due to frequent disturbances the owner dismantled the<br />
eng<strong>in</strong>e for servic<strong>in</strong>g. However, he does not have proper technical know how <strong>of</strong> it and he<br />
could not reassemble it. As well there is no technician around to make the eng<strong>in</strong>e fit. As a<br />
result due to lack <strong>of</strong> technical support this farm can not produce electricity.<br />
<strong>The</strong>re is no pressure gauge to measure the pressure <strong>of</strong> the gas chamber. So the owners or<br />
operators don’t know exactly whether there is enough gas to run the eng<strong>in</strong>e. <strong>The</strong>y also don’t<br />
know the amount <strong>of</strong> gas produced <strong>in</strong> the biogas plant. As there is no gas meter they can not<br />
measure the gas flow so it’s a problem to identify for how long the eng<strong>in</strong>e can run.<br />
52
CHAPTER 6 POTENTIAL OF ELECTRICITY GENERATION<br />
FROM POULTRY WASTE<br />
At present there are different types <strong>of</strong> technologies used <strong>in</strong> the country to produce electricity<br />
<strong>from</strong> poultry waste. <strong>The</strong> technology used <strong>in</strong> the GTZ flagship project (discussed <strong>in</strong> chapter<br />
5.2) was considered for the f<strong>in</strong>ancial calculation to f<strong>in</strong>d out the economic potential because it<br />
is more scientific technology than any other technologies be<strong>in</strong>g used <strong>in</strong> the country. To f<strong>in</strong>d<br />
out the economic potential <strong>of</strong> electricity generation <strong>from</strong> poultry waste, two different<br />
scenarios were considered. <strong>The</strong>se scenarios are based on the time duration for which the<br />
poultry farms can produce the electricity for its own consumption as well as to sell the excess<br />
electricity to adjacent neighbors through the m<strong>in</strong>i grid. <strong>The</strong> current practice <strong>in</strong> the country is<br />
to produce electricity dur<strong>in</strong>g load shedd<strong>in</strong>g and for the whole consumption <strong>of</strong> the poultry<br />
farm as well.<br />
In Scenario I the production <strong>of</strong> electricity was considered for five hours dur<strong>in</strong>g the country<br />
peak which will reduce the burden on national grid dur<strong>in</strong>g the peak and ensure un<strong>in</strong>terrupted<br />
power supply to the poultry farms. On the other hand, <strong>in</strong> Scenario II the production <strong>of</strong><br />
electricity was considered for twelve hours for the whole consumption <strong>of</strong> the farm which will<br />
reduce the load on national grid as well as ensure un<strong>in</strong>terrupted power supply to the farm and<br />
the electricity produced <strong>from</strong> the poultry sector can be used <strong>in</strong> other sectors. In scenario II<br />
poultry farms will consume more energy <strong>from</strong> own generation than <strong>in</strong> Scenario I. Moreover,<br />
<strong>in</strong> Scenario I the system will require one set <strong>of</strong> generators and <strong>in</strong> Scenario II the system will<br />
require two sets <strong>of</strong> generators that will result <strong>in</strong> a variation <strong>of</strong> <strong>in</strong>vestment cost. However, the<br />
size <strong>of</strong> generator will vary s<strong>in</strong>ce <strong>in</strong> Scenario II the size <strong>of</strong> generator is lower than that <strong>of</strong><br />
Scenario I.<br />
Four different cases were considered under each scenario. <strong>The</strong> cases were based on the<br />
product through which revenue can be generated. <strong>The</strong>se different products are electricity,<br />
CO2, and fertilizer. In the first case only electricity was considered as a product to earn<br />
revenue. In the second case, electricity and CO2 were considered as products for revenue. In<br />
the third case, electricity and fertilizer were considered as product for revenue and f<strong>in</strong>ally the<br />
fourth case, considers electricity, CO2 and fertilizer as revenue earn<strong>in</strong>g products.<br />
So an analysis <strong>of</strong> these scenarios for different cases will help the people concerned to take<br />
decision for their further plann<strong>in</strong>g <strong>in</strong> this field.<br />
53
6.1 F<strong>in</strong>ancial Analysis<br />
For f<strong>in</strong>ancial analysis three different f<strong>in</strong>ancial <strong>in</strong>dexes were calculated to f<strong>in</strong>d out the<br />
economic feasibility <strong>of</strong> produc<strong>in</strong>g electricity <strong>from</strong> poultry waste. <strong>The</strong>se <strong>in</strong>dexes are as<br />
follows:<br />
Net Present Value (NPV) 29<br />
This is the difference between sum <strong>of</strong> discounted cash flow which is expected <strong>from</strong> the<br />
project dur<strong>in</strong>g the project’s life time and the <strong>in</strong>itial <strong>in</strong>vestment. A project is f<strong>in</strong>ancially<br />
feasible if the NPV is positive. <strong>The</strong> bigger the NPV, the more pr<strong>of</strong>itable is the project. If the<br />
NPV is zero it means the project is at break even po<strong>in</strong>t. <strong>The</strong> formula for NPV is as follows:<br />
Each cash <strong>in</strong>flow/outflow is discounted to its present value. <strong>The</strong>n they are summed.<br />
<strong>The</strong>refore,<br />
NPV<br />
n<br />
= ∑<br />
t=<br />
1<br />
Ct<br />
t<br />
( 1+<br />
r)<br />
− C<br />
Where<br />
t = the time <strong>of</strong> the cash flow<br />
n = the total time <strong>of</strong> the project<br />
r = the discount factor<br />
Ct = the net cash flow at time t<br />
0<br />
C0 = the capital outflow at the beg<strong>in</strong>n<strong>in</strong>g <strong>of</strong> the <strong>in</strong>vestment time (t=0)<br />
Internal Rate <strong>of</strong> Return (IRR)<br />
Internal rate <strong>of</strong> return is the discount factor at which the NPV is zero. If the IRR is higher<br />
than the discount rate then the project is feasible. <strong>The</strong> formula used to calculate the IRR is as<br />
follows:<br />
IRR = i1-NPV1*[(i2-i1)/(NPV2-NPV1)]<br />
i1= is the <strong>in</strong>terest at which NPV is positive<br />
i2= is the <strong>in</strong>terest rate at which NPV is negative<br />
NPV1 = Net present Value at <strong>in</strong>terest rate i1<br />
NPV2 = Net Present Value at <strong>in</strong>terest rate i2 (Boyd, 2006, p. 36)<br />
29 http://en.wikipedia.org/wiki/Net_present_value, pr<strong>in</strong>ted on 15.08.2008<br />
54
Pay Back Period 30<br />
Pay back period is def<strong>in</strong>ed as the length <strong>of</strong> time period required to recover the <strong>in</strong>itial<br />
<strong>in</strong>vestment through discounted the annual cash flow generated by the <strong>in</strong>vestment. <strong>The</strong> shorter<br />
the pay back period is better the project.<br />
<strong>The</strong> equation <strong>of</strong> Payback Period when the cash flows are same every year dur<strong>in</strong>g the project<br />
life:<br />
Payback Period = Investment/ annual cash <strong>in</strong>flow<br />
<strong>The</strong> equation <strong>of</strong> Payback Period for variable cash flow is given below:<br />
Payback Period = last year with a negative cash flow + (|value <strong>of</strong> net benefits|)/total cash flow<br />
(next year).<br />
6.1.1 Assumptions:<br />
<strong>Electricity</strong> consumption: It was assumed that all the biogas will be consumed for electricity<br />
generation. It was also assumed that all the electricity will be produced <strong>in</strong> the poultry farm<br />
will be consumed either by the poultry farm itself or by the adjacent household or enterprises.<br />
Feed<strong>in</strong>g the excess electricity on to the grid was not considered. To feed electricity onto the<br />
grid needs the <strong>in</strong>terconnection and accord<strong>in</strong>g to the exist<strong>in</strong>g policy the cost for<br />
<strong>in</strong>terconnection shall be born by the electricity producers. Hence, the <strong>in</strong>terconnection cost<br />
would result <strong>in</strong> a higher <strong>in</strong>vestment cost. <strong>The</strong> rate at which BPDB purchases electricity <strong>from</strong><br />
Independent Power Producers (IPP) is about 2.05 BDT/kWh 31 which could be the limit for<br />
the utilities to purchase electricity <strong>from</strong> the poultry farms. On the other hand, the domestic<br />
tariff <strong>of</strong> electricity ranges <strong>from</strong> 2.53 BDT/kWh to 3.89 BDT/kWh 32 which is higher than the<br />
BPDB rate for the IPPs. <strong>The</strong>refore, it is more feasible to sell the excess electricity to<br />
neighbor<strong>in</strong>g households or enterprises then feed on to the grid. It was estimated that <strong>in</strong><br />
Scenario I on an average 33% energy will be consumed by the poultry farm and the rest 67%<br />
energy will be sold to the adjacent households. In Scenario II it was calculated that on an<br />
average 57% energy will be consumed by the poultry farm and the rest 43% will be sold to<br />
adjacent households. <strong>The</strong> detail calculation is given <strong>in</strong> Appendix 6.1.<br />
30 http://www.odellion.com/pages/onl<strong>in</strong>e%20community/Payback/f<strong>in</strong>ancialmodels_payback_equations.htm<br />
pr<strong>in</strong>ted on 10.08.2007<br />
31 own calculation based on BPDB, 2004-2005, p. 78<br />
32 <strong>in</strong>terview by author with Mr. Susanta Chandra Sarkar, Assistant General Maganger (F<strong>in</strong>ance), Gazipur PBS,<br />
dated 28.06.07<br />
55
Cost <strong>of</strong> biogas plant: <strong>The</strong> construction costs <strong>of</strong> different available sizes <strong>of</strong> biogas plant <strong>in</strong> the<br />
country are shown <strong>in</strong> Figure 6.1.<br />
Cost (BDT)<br />
400000<br />
350000<br />
300000<br />
250000<br />
200000<br />
150000<br />
100000<br />
50000<br />
0<br />
Figure 6.1 Cost <strong>of</strong> bio gas plant<br />
17197 18526 28161 32678<br />
56<br />
44491<br />
63990<br />
75050<br />
118500<br />
357500<br />
2 3 4 6 9 11.4 14.3 28.6 70<br />
Size (m3)<br />
Source: Compiled and translated by author based on BCSIR, 1998 as quoted <strong>in</strong> BCAS, 2005,<br />
p. 20 and <strong>in</strong>terview by the author with Mr. M. A. G<strong>of</strong>ran, Grameen Shakti, Dhaka,21.05.2007<br />
<strong>The</strong> average cost <strong>of</strong> the available sizes was considered as the construction cost <strong>of</strong> biogas plant<br />
per m 3 .<br />
Operation and Ma<strong>in</strong>tenance (O & M) cost <strong>of</strong> bio gas plant: Operation cost consists <strong>of</strong><br />
labor cost and cost <strong>of</strong> poultry litter and ma<strong>in</strong>tenance cost is considered as the cost <strong>of</strong> chang<strong>in</strong>g<br />
valves, gas pipe etc.<br />
Labor cost for biogas plant: Labor cost for charg<strong>in</strong>g the dropp<strong>in</strong>gs <strong>in</strong>to the biogas plant is<br />
considered zero <strong>in</strong> the analysis as the poultry farm needs to clean the dropp<strong>in</strong>gs to avoid the<br />
bad smell and to clean the poultry shed for hygienic reason. It was observed that there is a<br />
dra<strong>in</strong>age system around the poultry shed which is connected to the <strong>in</strong>let chamber <strong>of</strong> biogas<br />
plant and the charge can flow <strong>in</strong>to the <strong>in</strong>let chamber due to gravity. So there is no additional<br />
cost <strong>in</strong>curred to charge the dropp<strong>in</strong>g <strong>in</strong>to the biogas plant for produc<strong>in</strong>g electricity. So what<br />
ever work else is associated with charg<strong>in</strong>g the dropp<strong>in</strong>g <strong>in</strong>to the <strong>in</strong>let chamber can be done by<br />
the exist<strong>in</strong>g manpower used <strong>in</strong> the poultry. <strong>The</strong> cost <strong>of</strong> poultry dropp<strong>in</strong>gs is considered zero<br />
as the electricity will be generated <strong>in</strong> <strong>in</strong>dividual poultry farms <strong>from</strong> their own poultry<br />
dropp<strong>in</strong>gs.
Ma<strong>in</strong>tenance cost <strong>of</strong> biogas plant: Ma<strong>in</strong>tenance cost <strong>of</strong> biogas plant is considered as the<br />
replacement cost for valves, socket, gas pipe etc. It was considered that valves, gas pipe etc,<br />
has to be replaced every three years due to leakage. For a 6 m 3 biogas plant the cost is<br />
considered as 1035 BDT (Grameen Shakti, 2006, p. 27). For a larger size <strong>of</strong> biogas plant the<br />
replacement cost <strong>of</strong> valves, gas pipe etc would not very too much. <strong>The</strong>refore it was<br />
considered as the unit cost for one biogas plant<br />
Cost <strong>of</strong> slurry pit: For stor<strong>in</strong>g the slurry com<strong>in</strong>g out <strong>of</strong> the biogas plant a pit is required. <strong>The</strong><br />
cost for 1000 birds’ poultry farm is considered as 4000 BDT (BCAS, 2005, p. 43) and for<br />
larger farms it <strong>in</strong>creases proportionally.<br />
Ma<strong>in</strong>tenance cost for slurry: It was found that slurry is not used as fertilizer commercially.<br />
Usually, the neighbor<strong>in</strong>g farmers or fish farmer take it away free <strong>of</strong> cost and the poultry<br />
farmers do not handle it. So <strong>in</strong> the case where there is no revenue <strong>in</strong>come <strong>from</strong> slurry, the<br />
cost for its ma<strong>in</strong>tenance was considered zero. However <strong>in</strong> the case where it is considered that<br />
slurry could be sold commercially the cost <strong>of</strong> ma<strong>in</strong>tenance is considered as 25% <strong>of</strong> sell<strong>in</strong>g<br />
price.<br />
Cost <strong>of</strong> generator: Currently only three to four different sizes <strong>of</strong> generators are be<strong>in</strong>g used <strong>in</strong><br />
different poultry farms which are produc<strong>in</strong>g electricity <strong>from</strong> poultry waste. <strong>The</strong> sizes are 2<br />
kW, 3 kW, 4.5 kW and 5 kW. However, the costs <strong>of</strong> only three different sizes <strong>of</strong> generators<br />
are available which is given <strong>in</strong> the follow<strong>in</strong>g Table 6.1.<br />
Table 6.1 Cost <strong>of</strong> Generators<br />
Size (kW) Cost (BDT)<br />
2 21700<br />
3 36000<br />
5 50000<br />
Source: Compiled by author based on <strong>in</strong>terview by author with Mr. M. A. G<strong>of</strong>ran, Grameen<br />
Shakti, Dhaka, 21.05.2007 and Dr. Khursheed-Ul-Islam, GTZ Bangladesh, Dhaka,17.06.2007<br />
So for larger sizes <strong>of</strong> generators the cost is synthesized <strong>from</strong> the cost <strong>of</strong> available sizes. For<br />
example, the cost <strong>of</strong> a 10 kW generator was considered as the total cost <strong>of</strong> two 5 kW<br />
generators. Similarly, the cost <strong>of</strong> a 50 kW generator was considered as the summation <strong>of</strong> ten<br />
5 kW generators. Cost <strong>of</strong> digression was not considered due to lack <strong>of</strong> adequate data.<br />
57
However, one analysis is made on the effect <strong>of</strong> cost digression <strong>of</strong> generator later <strong>in</strong> section<br />
6.2.<br />
Ma<strong>in</strong>tenance cost <strong>of</strong> generator: <strong>The</strong> annual ma<strong>in</strong>tenance cost generator was considered as<br />
10% <strong>of</strong> its <strong>in</strong>vestment cost.<br />
Operation cost <strong>of</strong> generator: <strong>The</strong> operation cost <strong>of</strong> generator was considered zero as biogas<br />
is free <strong>of</strong> cost for the generator.<br />
Cost H2S and moisture removal unit: In the GTZ flagship project at Raj <strong>Poultry</strong> Farm <strong>in</strong><br />
Faridpur district, the cost <strong>of</strong> H2S and Moisture removal unit for 10 kW plant was considered<br />
as 10000 BDT 33 . For other size <strong>of</strong> plant the cost would be different. For the simplicity, the<br />
cost for H2S and Moisture removal unit was considered as per kW which is drawn <strong>from</strong> the<br />
flagship project. For example, for a 1 kW plant the cost was considered 1000 BDT.<br />
Ma<strong>in</strong>tenance/ operation cost <strong>of</strong> H2S removal unit: Ma<strong>in</strong>tenance cost for H2S removal unit<br />
was derived <strong>from</strong> GTZ flagship project. <strong>The</strong> cost is considered as per kW. For 10 kW plant<br />
the ma<strong>in</strong>tenance cost is 8350 BDT per year (ibid). So the cost for 1 kW plant was considered<br />
as 835 BDT per year.<br />
Ma<strong>in</strong>tenance/ operation cost <strong>of</strong> moisture removal unit: Ma<strong>in</strong>tenance cost for moisture<br />
removal unit was also derived <strong>from</strong> GTZ flagship project. <strong>The</strong> cost is considered as per kW.<br />
For 10 kW plant the ma<strong>in</strong>tenance cost is 2000 BDT per year (ibid). So the cost for 1 kW plant<br />
was considered 200 BDT per year.<br />
Cost <strong>of</strong> compressor for regeneration process: In GTZ flagship project for 10 kW plant the<br />
cost <strong>of</strong> compressor was 4000 BDT (ibid). For other sizes <strong>of</strong> power plant it was considered<br />
proportionally. However, the m<strong>in</strong>imum cost <strong>of</strong> compressor was considered 1000 BDT.<br />
Amount <strong>of</strong> CO2 saved: <strong>The</strong> amount <strong>of</strong> CO2 could be saved <strong>from</strong> this project was compared<br />
with the system that produc<strong>in</strong>g electricity <strong>from</strong> natural gas. Because more than 85%<br />
electricity <strong>of</strong> the national grid comes <strong>from</strong> natural gas and poultry farms are grid connected.<br />
As an alternative source <strong>of</strong> energy CO2 emission is considered zero for produc<strong>in</strong>g electricity<br />
<strong>from</strong> poultry waste. <strong>The</strong> calculation <strong>of</strong> CO2 emission <strong>in</strong> Bangladesh <strong>from</strong> natural gas power<br />
plant is shown <strong>in</strong> Annex 6.3.<br />
33 Interview by the author with Dr. Khurshieed-Ul-Islam, GTZ, Dhaka, 17.06.2007<br />
58
Cost <strong>of</strong> CO2: <strong>The</strong> cost <strong>of</strong> CO2 was considered as equivalent to US$ 10 per ton <strong>of</strong> CO2 which<br />
is the average cost <strong>of</strong> Certified Emission Reduction (CER) <strong>in</strong> develop<strong>in</strong>g countries <strong>in</strong> the year<br />
2006 (Kapoor and Ambrosi, 2007, p. 4)<br />
Cost <strong>of</strong> electricity: <strong>The</strong> cost <strong>of</strong> electricity for the amount <strong>of</strong> energy consumed by the farm<br />
itself was considered as commercial tariff and the excess energy to be sold to adjacent<br />
household was considered as domestic tariff. Different electricity tariffs <strong>of</strong> Gazipur PBS are<br />
given <strong>in</strong> Appendix 6.2. <strong>The</strong> electricity tariff was <strong>in</strong>flated every year with the considered<br />
<strong>in</strong>flation rate.<br />
Cost <strong>of</strong> Fertilizer: Cost <strong>of</strong> fertilizer was considered as the m<strong>in</strong>imum rate or price <strong>of</strong> sun<br />
dried slurry found dur<strong>in</strong>g field visit.<br />
Inflation: <strong>The</strong> <strong>in</strong>flation rate was considered 5.28% as the average <strong>of</strong> the <strong>in</strong>flation rate <strong>in</strong> the<br />
country s<strong>in</strong>ce 1998 to 2006 (BB, 2005-2006, pp. 16-17 and own calculation).<br />
Litter/dropp<strong>in</strong>gs production: It was considered that a layer bird produces 0.1 kg dropp<strong>in</strong>gs<br />
per day (BCAS, 2005, p.43).<br />
Biogas production: It was considered that with a 40 days retention time at 30ºC, 0.063 m 3<br />
gas is produced <strong>from</strong> 1 kg <strong>of</strong> dropp<strong>in</strong>gs (ibid).<br />
Fertilizer production: It was considered that 40% <strong>of</strong> the dropp<strong>in</strong>gs are converted <strong>in</strong>to<br />
fertilizer (ibid, p. 44).<br />
<strong>Electricity</strong> production: It was considered that 0.75 m 3 biogas is required to generate 1 kWh<br />
<strong>of</strong> electricity (G<strong>of</strong>ran, 2004, p. 113).<br />
59
<strong>The</strong> other parameters considered <strong>in</strong> the f<strong>in</strong>ancial calculation are given <strong>in</strong> Table 6.2.<br />
Table 6.2 F<strong>in</strong>ancial parameters<br />
Litter/ dropp<strong>in</strong>gs production 0.1 kg/ day per bird<br />
Biogas production per kg <strong>of</strong> dropp<strong>in</strong>gs 0.063 m 3 /day at 30º C<br />
Fertilizer production 40% <strong>of</strong> dropp<strong>in</strong>gs<br />
Amount <strong>of</strong> bio gas required to produce electricity 0.75 m 3 / kWh<br />
Cost <strong>of</strong> fertilizer 0.8 BDT/ kg<br />
CO2 emission for natural gas power plant 0.57 ton/ MWh<br />
Cost <strong>of</strong> CO2<br />
60<br />
$ 10/ t CO2 or 685 BDT/ t CO2<br />
Cost <strong>of</strong> electricity (Domestic) + 5% VAT 2.70 BDT/ kWh<br />
Cost <strong>of</strong> electricity (Commercial) +5% VAT –<br />
20% Rebate<br />
4.29 BDT/ kWh<br />
Life <strong>of</strong> biogas plant 20 years<br />
Life <strong>of</strong> generator 5 years<br />
Discount rate 8%<br />
Tax 0%<br />
Inflation 5.28%<br />
Depreciation 20 years<br />
6.1.2 Overview <strong>of</strong> Scenario result:<br />
On the basis <strong>of</strong> different assumption as described <strong>in</strong> chapter 6.1.1, the different parameters<br />
showed <strong>in</strong> Table 6.2 NPV, IRR and Payback Period were calculated for different sizes <strong>of</strong><br />
poultry farms such e.g. 500, 1000, 2000, 3000, 4000, 5000, 6000, 7000, 8000, 9000, 10000,<br />
15000, 20000 and 50000 birds. NPV, IRR and Payback Period were calculated for each size<br />
<strong>of</strong> poultry farms under both Scenarios I & II for four different cases. <strong>The</strong> calculation was<br />
done to f<strong>in</strong>d out the m<strong>in</strong>imum size <strong>of</strong> poultry farms for different scenarios and for different<br />
cases as well which could produce electricity with f<strong>in</strong>ancial viability. <strong>The</strong>se m<strong>in</strong>imum sizes<br />
later help to estimate the total potential to produce electricity <strong>from</strong> poultry waste. <strong>The</strong><br />
summary results <strong>of</strong> Scenario I and Scenario II are shown <strong>in</strong> the follow<strong>in</strong>g figures graphically.<br />
<strong>The</strong> detail result <strong>of</strong> NPV, IRR and Payback Period for Scenario I and Scenario II are given <strong>in</strong><br />
Appendix 6.4 and Appendix 6.5 respectively. <strong>The</strong> follow<strong>in</strong>g Figure 6.2 and Figure 6.3 show<br />
the NPV for different sizes poultry farms for Scenario I and Scenario II respectively.
Figure 6.2 NPV <strong>of</strong> different size <strong>of</strong> farms with different product for revenue under Scenario I<br />
NPV (BDT)<br />
4000000<br />
3000000<br />
2000000<br />
1000000<br />
0<br />
-1000000<br />
-2000000<br />
500<br />
1000<br />
2000<br />
3000<br />
4000<br />
5000<br />
6000<br />
7000<br />
8000<br />
9000<br />
10000<br />
15000<br />
20000<br />
50000<br />
Size <strong>of</strong> poultry farm<br />
61<br />
E<br />
E+C<br />
E+F<br />
E+F+C<br />
Source: Author<br />
Figure 6.3 NPV <strong>of</strong> different size <strong>of</strong> farms with different product for revenue under Scenario II<br />
NPV (BDT)<br />
4000000<br />
3000000<br />
2000000<br />
1000000<br />
0<br />
-1000000<br />
-2000000<br />
500<br />
1000<br />
2000<br />
3000<br />
4000<br />
5000<br />
6000<br />
Size <strong>of</strong> poultry farm<br />
7000<br />
8000<br />
9000<br />
10000<br />
15000<br />
20000<br />
50000<br />
E<br />
E+C<br />
E+F<br />
E+F+C<br />
Source: Author<br />
<strong>The</strong> follow<strong>in</strong>g Figure 6.4 and Figure 6.5 show the IRR for different sizes poultry farms for<br />
Scenario I and Scenario II respectively.
Figure 6.4 IRR <strong>of</strong> different size <strong>of</strong> farms with different product for revenue under Scenario I<br />
IRR (%)<br />
24<br />
20<br />
16<br />
12<br />
8<br />
4<br />
0<br />
Size <strong>of</strong> poultry farm<br />
62<br />
E<br />
E+C<br />
E+F<br />
E+F+C<br />
Source: Author<br />
Figure 6.5 IRR <strong>of</strong> different size <strong>of</strong> farms with different product for revenue under Scenario II<br />
IRR (%)<br />
28<br />
24<br />
20<br />
16<br />
12<br />
8<br />
4<br />
0<br />
500<br />
1000<br />
2000<br />
3000<br />
4000<br />
5000<br />
6000<br />
7000<br />
8000<br />
9000<br />
10000<br />
500<br />
15000<br />
1000<br />
20000<br />
2000<br />
50000<br />
3000<br />
4000<br />
5000<br />
6000<br />
7000<br />
8000<br />
9000<br />
10000<br />
15000<br />
20000<br />
50000<br />
Size <strong>of</strong> poultry farm<br />
6.2 Analysis <strong>of</strong> Scenario I & II results:<br />
Case 1: Only electricity as a product to earn revenue<br />
E<br />
E+C<br />
E+F<br />
E+F+C<br />
Source: Author<br />
It is evident <strong>from</strong> Figure 6.2, 6.3 and <strong>from</strong> Figure 6.4, 6.5 that the size <strong>of</strong> poultry farms<br />
rang<strong>in</strong>g <strong>from</strong> 500 birds to 50000 birds all faces negative NPV and the IRR is much lower<br />
than the discount rate. So <strong>in</strong> this case no farm is f<strong>in</strong>ancially viable to produce electricity.<br />
<strong>The</strong>refore, there is no economic potential <strong>in</strong> the study area as well as <strong>in</strong> the country to<br />
produce electricity <strong>from</strong> poultry waste <strong>in</strong> this case.<br />
<strong>The</strong> above discussions satisfy the third research question <strong>of</strong> the study.
Case 2: <strong>Electricity</strong> and CO2 as product to earn revenue<br />
It is clear <strong>from</strong> Figure 6.2 and 6.4 that, for Scenario I where farms produce electricity only for<br />
five hours <strong>in</strong> the country peak, even the cost <strong>of</strong> CO2 can not make it f<strong>in</strong>ancially viable. <strong>The</strong><br />
NPV calculated for different sizes <strong>of</strong> poultry farms is negative and IRR is also much lower<br />
than the discount rate. So there is no potential to produce electricity <strong>from</strong> poultry waste <strong>in</strong><br />
this case for Scenario I. However, due to addition <strong>of</strong> CO2 cost both NPV and IRR is little<br />
higher than case 1.<br />
On the other hand, for Scenario II where electricity production was considered twelve hours<br />
through out the day, it is seen <strong>from</strong> Figure 6.3 and Figure 6.5 that the addition <strong>of</strong> CO2 cost<br />
makes electricity production f<strong>in</strong>ancially viable for the farms with 6000 birds and above. For<br />
the farms with the capacity <strong>of</strong> 6000 birds and above, NPV was found positive and IRR is<br />
above discount rate. <strong>The</strong> farms with the capacity <strong>of</strong> less than 6000 birds are not f<strong>in</strong>ancially<br />
feasible to produce electricity <strong>from</strong> poultry waste.<br />
In scenario II the farms produce electricity for twelve hours and consume it through out the<br />
time. So as compared to scenario I, <strong>in</strong> scenario II poultry farms consume more energy than it<br />
sells to neighbor<strong>in</strong>g household. Hence, the revenue earn<strong>in</strong>g <strong>from</strong> electricity is higher <strong>in</strong><br />
scenario II than <strong>in</strong> scenario I as the tariff for poultry farms is higher than it sells to household.<br />
At the same time larger farms produce more energy, hence save more CO2 which makes the<br />
larger farms f<strong>in</strong>ancially viable to produce electricity <strong>from</strong> poultry waste.<br />
<strong>The</strong> above discussions satisfy the fourth research question <strong>of</strong> the study.<br />
Case 3: <strong>Electricity</strong> and Fertilizer as product to earn revenue<br />
It is obvious <strong>from</strong> Figure 6.2, 6.4 and <strong>from</strong> Figure 6.3, 6.5 that for both Scenario I and<br />
Scenario II, the addition <strong>of</strong> fertilizer cost with electricity makes most <strong>of</strong> the farms f<strong>in</strong>ancially<br />
viable to produce electricity <strong>from</strong> poultry waste. It was found that for the farms rang<strong>in</strong>g <strong>from</strong><br />
1000 birds to 50000 birds, the NPV is positive and the IRR is much above the discount rate.<br />
It is manifested that the most important factor to make the project viable is the addition <strong>of</strong> the<br />
cost <strong>of</strong> fertilizer to the cost <strong>of</strong> electricity. S<strong>in</strong>ce the revenue earn<strong>in</strong>g <strong>from</strong> fertilizer is always<br />
higher than the revenue earn<strong>in</strong>g <strong>from</strong> electricity. However, the NPV for farms with the<br />
capacity 500 birds was found negative and the IRR is much lower than the discount rate for<br />
both scenario I and II. So farms with 500 birds are not f<strong>in</strong>ancially feasible to produce<br />
electricity s<strong>in</strong>ce the <strong>in</strong>stallation cost is much higher as compared to energy generation.<br />
<strong>The</strong> above discussions satisfy the fifth research question <strong>of</strong> the study.<br />
63
Case 4: <strong>Electricity</strong>, Fertilizer and CO2 as product to earn revenue<br />
In this case besides electricity and fertilizer, CO2 is added as a product to earn revenue. Like<br />
case 3, it was found that for the farms rang<strong>in</strong>g <strong>from</strong> 1000 birds to 50000 birds, the NPV is<br />
positive and the IRR is much above the discount rate for both Scenarios I and II. Due to the<br />
addition <strong>of</strong> cost <strong>of</strong> CO2 the NPV and IRR is little bit higher and the pay back period is lower<br />
than <strong>in</strong> case3. However, even the addition <strong>of</strong> CO2 cost can not make 500 birds’ farm<br />
f<strong>in</strong>ancially viable to produce electricity due to the high <strong>in</strong>stallation cost as compared to<br />
energy generation.<br />
<strong>The</strong> above discussions satisfy the sixth research question <strong>of</strong> the study.<br />
From Figure 6.4 and Figure 6.5, it is shown that for case 3 & 4, the IRR for the poultry farms<br />
with capacity 2000 birds and above is much higher than the discount rate. However, the IRR<br />
for the poultry farms with capacity 1000 birds and below is much lower. S<strong>in</strong>ce the tariff <strong>from</strong><br />
electricity <strong>in</strong> case <strong>of</strong> 1000 birds and below was considered as domestic rate which is much<br />
lower than the commercial rate. On the other hand, there is no IRR for the farms with the<br />
capacity <strong>of</strong> 1000 birds and below <strong>in</strong> case 1 & 2.<br />
Effect <strong>of</strong> Cost Digression <strong>of</strong> Generators<br />
Cost digression <strong>of</strong> generators was considered on the basis <strong>of</strong> data provided by one generator<br />
distributor/supplier <strong>in</strong> Bangladesh called Fair Trade International. <strong>The</strong> costs <strong>of</strong> available sizes<br />
are shown <strong>in</strong> Table 6.3. As all the sizes required for the f<strong>in</strong>ancial analysis are not available <strong>in</strong><br />
table 6.3, the cost <strong>of</strong> other sizes required were synthesized <strong>from</strong> these available prices by<br />
<strong>in</strong>terpolat<strong>in</strong>g or extrapolat<strong>in</strong>g.<br />
Table 6.3 Cost <strong>of</strong> different sizes generators <strong>from</strong> Fair Trade International<br />
Size (kW) Cost (BDT)<br />
2 35000<br />
3 48000<br />
5 72000<br />
10 225000<br />
15 250000<br />
20 260000<br />
24 270000<br />
Source: Data provided by Mr. Harun Ur Rashid Talukder, Manager, Fair Trade International,<br />
Dhaka, Bangladesh, 20.08.2007.<br />
<strong>The</strong> follow<strong>in</strong>g Figure 6.6 shows the IRR <strong>of</strong> different size <strong>of</strong> poultry farms with cost<br />
digression <strong>of</strong> generators under Scenario I.<br />
64
Figure 6.6 IRR <strong>of</strong> different size <strong>of</strong> farms with cost digression <strong>of</strong> generators for Scenario I<br />
IRR (%)<br />
32<br />
28<br />
24<br />
20<br />
16<br />
12<br />
8<br />
4<br />
0<br />
500<br />
1000<br />
2000<br />
3000<br />
4000<br />
5000<br />
6000<br />
7000<br />
8000<br />
9000<br />
10000<br />
15000<br />
20000<br />
45000<br />
50000<br />
Size <strong>of</strong> poultry farm<br />
65<br />
E<br />
E+C<br />
E+F<br />
E+F+C<br />
Source: Author<br />
For Scenario I it was found that the farms with the capacity <strong>of</strong> 20000 birds and above are<br />
f<strong>in</strong>ancially viable to produce electricity for case 2 where cost <strong>of</strong> electricity and cost <strong>of</strong> CO2<br />
are considered as product to earn revenue. It was also found that farms with the capacity <strong>of</strong><br />
45000 birds and above are f<strong>in</strong>ancially viable to produce electricity even <strong>in</strong> case 1 where only<br />
electricity is considered as revenue earn<strong>in</strong>g product. However, for such big farms some<br />
unseen cost such as cost for control equipment etc. can make it f<strong>in</strong>ancially unviable as the<br />
IRR is not too high as compared to discount rate and the cost considered for generator is<br />
extrapolated <strong>from</strong> some smaller sizes <strong>of</strong> generators which may vary <strong>in</strong> reality. In terms <strong>of</strong><br />
f<strong>in</strong>ancially viability for case 3 and case 4 it does not make any differences as compared to the<br />
analysis where cost digression for generators was not considered as shown <strong>in</strong> Figure 6.4.<br />
However, it is seen <strong>in</strong> Figure 6.6 that IRR is decreas<strong>in</strong>g <strong>from</strong> the farms with 3000 birds to<br />
6000 birds for all cases due to the high cost escalation between 5 kW and 10 kW generators<br />
as shown <strong>in</strong> Table 6.3. In this case multiple generators can be used as considered before <strong>in</strong><br />
the f<strong>in</strong>ancial calculation without consider<strong>in</strong>g cost digression.<br />
<strong>The</strong> follow<strong>in</strong>g Figure 6.7 shows the IRR <strong>of</strong> different size <strong>of</strong> poultry farms with the cost<br />
digression <strong>of</strong> generators under Scenario II.
Figure 6.7 IRR <strong>of</strong> different size <strong>of</strong> farms with cost digression <strong>of</strong> generators for Scenario II<br />
IRR (%)<br />
32<br />
28<br />
24<br />
20<br />
16<br />
12<br />
8<br />
4<br />
0<br />
500<br />
1000<br />
2000<br />
3000<br />
4000<br />
5000<br />
6000<br />
7000<br />
8000<br />
9000<br />
10000<br />
15000<br />
20000<br />
50000<br />
Size <strong>of</strong> poultry farm<br />
66<br />
E<br />
E+C<br />
E+F<br />
E+F+C<br />
Source: Author<br />
In Scenario II it was found that for case 1 and case 2 the farms with 50000 birds are<br />
f<strong>in</strong>ancially viable to produce electricity. This differs <strong>from</strong> the result shown <strong>in</strong> Figure 6.5<br />
where no cost digression was considered. For case 2 the farms with capacity 6000 birds and<br />
above were found f<strong>in</strong>ancially viable where the cost digression was not considered and no<br />
farms were found f<strong>in</strong>ancially viable for case 1. It is also seen <strong>from</strong> Figure 6.7 that 2000 birds’<br />
farm and above are f<strong>in</strong>ancially feasible to produce electricity for case 3 and case 4. Whereas<br />
it was found that 1000 birds’ farm are also f<strong>in</strong>ancially feasible to produce electricity without<br />
consider<strong>in</strong>g cost digression. So it can be said that for smaller farms use <strong>of</strong> multiple units <strong>of</strong><br />
generator is more feasible. It is also seen <strong>from</strong> Figure 6.7 that IRR is decreas<strong>in</strong>g for the farms<br />
with the capacity <strong>from</strong> 9000 birds to 15000 birds due to the high price escalation between 5<br />
kW and 10 kW generators as shown <strong>in</strong> Table 6.3. In this case us<strong>in</strong>g multiple units <strong>of</strong><br />
generator is more feasible.<br />
<strong>The</strong> prices shown <strong>in</strong> table 6.3 are much higher than the price considered <strong>in</strong> table 6.1. <strong>The</strong> data<br />
provided <strong>in</strong> Table 6.3 could not be verified whether it is competitive or not as it was taken<br />
<strong>from</strong> one supplier.<br />
Through the analysis it can be concluded that consider<strong>in</strong>g cost digression <strong>of</strong> generators does<br />
not make too much differences <strong>in</strong> most <strong>of</strong> the cases to make the project f<strong>in</strong>ancially viable or<br />
unviable. Us<strong>in</strong>g multiple units <strong>of</strong> generators has more f<strong>in</strong>ancial advantage for the smaller and<br />
middle sizes poultry farms whereas us<strong>in</strong>g s<strong>in</strong>gle unit generator set has the advantage for large<br />
scale farms. However, it is also true that the extrapolation or <strong>in</strong>terpolation also does not
epresent the real cost <strong>of</strong> technology. <strong>The</strong>refore, the estimation <strong>of</strong> total potential <strong>of</strong> electricity<br />
production on the basis <strong>of</strong> calculation without consider<strong>in</strong>g cost digression <strong>of</strong> generators is<br />
also justified.<br />
6.3 Estimate <strong>of</strong> Total <strong>Potential</strong><br />
Case 1: Only electricity as a product to earn revenue<br />
<strong>The</strong>re is no economic potential <strong>in</strong> the study area as well as <strong>in</strong> the country to produce<br />
electricity <strong>from</strong> poultry waste <strong>in</strong> this case.<br />
Case 2: <strong>Electricity</strong> and CO2 as product to earn revenue<br />
In this case for Scenario II it was estimated <strong>from</strong> the survey data that the total production <strong>of</strong><br />
electricity would be about 13 GWh per year and the correspond<strong>in</strong>g annual fertilizer<br />
production and CO2 sav<strong>in</strong>gs was estimated at 59 thousand ton and 7 thousand ton<br />
respectively <strong>in</strong> the study area.<br />
Similarly, for the whole country, the total production <strong>of</strong> electricity was estimated at 135 GWh<br />
per annum and the correspond<strong>in</strong>g annual fertilizer production and CO2 sav<strong>in</strong>gs was estimated<br />
640 thousand ton and 77 thousand ton respectively.<br />
However, there is no economic potential to produce electricity <strong>in</strong> Scenario I.<br />
Case 3: <strong>Electricity</strong> and Fertilizer as product to earn revenue<br />
In this case, for both Scenario I & II, based on the survey data the total annual electricity<br />
generation <strong>in</strong> the study area was estimated at 34 GWh and the correspond<strong>in</strong>g annual fertilizer<br />
production and CO2 sav<strong>in</strong>gs was estimated at 159 thousand ton and 19 thousand ton<br />
respectively.<br />
Likewise, for the whole country the total annual electricity generation was estimated at 360<br />
GWh and the fertilizer production and CO2 sav<strong>in</strong>gs per year was estimated at 1715 thousand<br />
ton and 205 thousand ton respectively.<br />
Case 4: <strong>Electricity</strong>, Fertilizer and CO2 as product to earn revenue<br />
Like case 3, on the basis <strong>of</strong> survey data, <strong>in</strong> this case the total annual electricity generation was<br />
estimated at about 34 GWh <strong>in</strong> the study area and the correspond<strong>in</strong>g fertilizer production and<br />
CO2 sav<strong>in</strong>gs was estimated at about 159 thousand ton and 19 thousand ton per year<br />
respectively.<br />
67
<strong>The</strong> correspond<strong>in</strong>g country electricity generation was estimated at about 360 GWh per annum<br />
and the fertilizer production and CO2 sav<strong>in</strong>gs was estimated at about 1715 thousand ton and<br />
205 thousand ton per year respectively.<br />
<strong>The</strong> summary <strong>of</strong> estimated potential <strong>of</strong> electricity generation and correspond<strong>in</strong>g fertilizer<br />
production and CO2 sav<strong>in</strong>gs <strong>in</strong> each case under different scenarios is given <strong>in</strong> the follow<strong>in</strong>g<br />
Table 6.4 and Table 6.5.<br />
Table 6.4 Summary <strong>of</strong> estimated potential <strong>of</strong> electricity generation, fertilizer production and<br />
CO2 sav<strong>in</strong>gs <strong>in</strong> Scenario I<br />
<strong>Potential</strong> <strong>of</strong> Scenario I<br />
<strong>Electricity</strong> Fertilizer (000’ CO2 (000'<br />
(GWh/year) ton/year)<br />
ton)/year<br />
Case 1 Gazipur district 0 0 0<br />
Bangladesh 0 0 0<br />
Case 2 Gazipur district 0 0 0<br />
Bangladesh 0 0 0<br />
Case 3 Gazipur district 34 159 19<br />
Bangladesh 360 1715 205<br />
Case 4 Gazipur district 34 159 19<br />
Bangladesh 360 1715 205<br />
Source: Author<br />
Table 6.5 Summary <strong>of</strong> estimated potential <strong>of</strong> electricity generation, fertilizer production and<br />
CO2 sav<strong>in</strong>gs <strong>in</strong> Scenario II<br />
<strong>Potential</strong> <strong>of</strong> Scenario II<br />
<strong>Electricity</strong> Fertilizer (000’ CO2 (000'<br />
(GWh/year) ton/year)<br />
ton)/year<br />
Case 1 Gazipur district 0 0 0<br />
Bangladesh 0 0 0<br />
Case 2 Gazipur district 13 59 7<br />
Bangladesh 135 640 77<br />
Case 3 Gazipur district 34 159 19<br />
Bangladesh 360 1715 205<br />
Case 4 Gazipur district 34 159 19<br />
Bangladesh 360 1715 205<br />
68<br />
Source: Author
6.4 Sensitivity Analysis<br />
<strong>The</strong> sensitivity analysis was carried out for both the Scenarios I & II to determ<strong>in</strong>e how the<br />
f<strong>in</strong>ancial <strong>in</strong>dexes react with the variation <strong>of</strong> the different parameters e.g. market price for<br />
different <strong>in</strong>stallation. Two parameters were considered <strong>in</strong> the sensitivity analysis and these<br />
are the variation <strong>of</strong> <strong>in</strong>vestment cost and the variation <strong>of</strong> discount factor.<br />
6.4.1 Effect <strong>of</strong> variation <strong>of</strong> <strong>in</strong>vestment cost<br />
S<strong>in</strong>ce the f<strong>in</strong>ancial viability may be concluded <strong>from</strong> IRR, only the variation <strong>of</strong> IRR is shown<br />
<strong>in</strong> the analysis. <strong>The</strong> sensitivity analysis was carried out for the variation <strong>of</strong> <strong>in</strong>vestment cost by<br />
±20%. It is obvious that the higher <strong>in</strong>vestment cost would results to lower IRR and the lower<br />
<strong>in</strong>vestment cost would results to higher IRR. However, it was found that with the variation <strong>of</strong><br />
<strong>in</strong>vestment cost by ±20% some farms for different cases become f<strong>in</strong>ancially viable or<br />
unviable. So only the farms which are sensitive <strong>in</strong> a sense to make it f<strong>in</strong>ancially viable or<br />
unviable with the variation <strong>of</strong> <strong>in</strong>vestment cost are shown <strong>in</strong> the analysis.<br />
Scenario I:<br />
In Scenario I larger farms are not sensitive to the <strong>in</strong>crease or decrease <strong>of</strong> 20% <strong>in</strong>vestment cost<br />
which means that the variation <strong>of</strong> the <strong>in</strong>vestment cost can not make any farms f<strong>in</strong>ancially<br />
viable or unviable for either <strong>of</strong> the cases. For example, the change <strong>of</strong> IRR for a 10000 birds’<br />
capacity farm is given <strong>in</strong> Appendix 6.6.<br />
However, figure 6.8 shows that the <strong>in</strong>crease <strong>of</strong> <strong>in</strong>vestment cost by 20% makes the 1000 birds’<br />
farm f<strong>in</strong>ancially unviable for case 3 where the fertilizer cost is added with the electricity cost.<br />
So the <strong>in</strong>crease <strong>of</strong> <strong>in</strong>vestment cost by 20% would reduce the total potential to produce<br />
electricity.<br />
69
IRR (%)<br />
18<br />
16<br />
14<br />
12<br />
10<br />
8<br />
6<br />
4<br />
2<br />
0<br />
Scenario II:<br />
Figure 6.8 IRR at different <strong>in</strong>vestment cost (1000 birds farm)<br />
-20% 0%<br />
% variation on <strong>in</strong>vestment cost (1000 birds)<br />
20%<br />
70<br />
E<br />
E+C<br />
E+F<br />
E+F+C<br />
Source: Author<br />
In Scenario II the <strong>in</strong>crease or decrease <strong>of</strong> <strong>in</strong>vestment cost by 20% has effect on different sizes<br />
<strong>of</strong> poultry farms. It is seen <strong>from</strong> figure 6.9 that with 20% <strong>in</strong>crease <strong>of</strong> <strong>in</strong>vestment cost makes<br />
1000 birds’ poultry farm f<strong>in</strong>ancially unviable <strong>in</strong> case 3 where both electricity and fertilizer<br />
cost is considered as revenue earn<strong>in</strong>g. Hence the total potential would be decreased <strong>in</strong> this<br />
case. However, case 4 is still f<strong>in</strong>ancially viable with the variation <strong>of</strong> <strong>in</strong>vestment cost.<br />
IRR (%)<br />
18<br />
16<br />
14<br />
12<br />
10<br />
8<br />
6<br />
4<br />
2<br />
0<br />
Figure 6.9 IRR at different <strong>in</strong>vestment cost (1000 birds farm)<br />
-20% 0%<br />
% variation on <strong>in</strong>vestment cost (1000 birds)<br />
20%<br />
E<br />
E+C<br />
E+F<br />
E+F+C<br />
Source: Author<br />
It was found that 4000 birds’ farms, 6000 birds’ farms and 10000 birds’ farms are also<br />
sensitive to the variation <strong>of</strong> <strong>in</strong>vestment cost by ±20%. <strong>The</strong> sensitivity analyses <strong>of</strong> these farms<br />
are given <strong>in</strong> Appendix 6.6 graphically.
<strong>The</strong> summary <strong>of</strong> estimated potential <strong>of</strong> electricity generation <strong>in</strong> each case under different<br />
scenarios with the variation <strong>of</strong> <strong>in</strong>vestment cost is given <strong>in</strong> the follow<strong>in</strong>g Table 6.6 and Table<br />
6.7.<br />
Table 6.6 Summary <strong>of</strong> estimated potential <strong>of</strong> electricity generation <strong>in</strong> GWh/ Year <strong>in</strong> Gazipur<br />
district<br />
Scenario I<br />
Scenario II<br />
Variation <strong>in</strong><br />
Investment<br />
Cost<br />
Case 1<br />
(E)<br />
71<br />
Case 2<br />
(E+C)<br />
Case 3<br />
(E+F)<br />
Case 4<br />
(E+C)<br />
0% 0 0 34 34<br />
-20% 0 0 34 34<br />
20% 0 0 29 34<br />
0% 0 13 34 34<br />
-20% 13 15 34 34<br />
20% 0 0 29 34<br />
Source: Author<br />
Table 6.7 Summary <strong>of</strong> estimated potential <strong>of</strong> electricity generation <strong>in</strong> GWh/ Year <strong>in</strong><br />
Bangladesh<br />
Scenario I<br />
Scenario II<br />
Variation <strong>in</strong><br />
Investment<br />
Cost<br />
Case1<br />
(E)<br />
Case 2<br />
(E+C)<br />
Case 3<br />
(E+F)<br />
Case 4<br />
(E+F+C)<br />
0% 0 0 360 360<br />
-20% 0 0 360 360<br />
20% 0 0 309 360<br />
0% 0 135 360 360<br />
-20% 135 156 360 360<br />
20% 0 0 309 360<br />
Source: Author<br />
6.4.2 Effect <strong>of</strong> variation <strong>of</strong> Discount Rate<br />
<strong>The</strong> sensitivity analysis was carried out for different cases under both Scenarios I & II at<br />
different discount rate and these are 8%, 6% and 4%. It is obvious that the higher discount<br />
rate would result lower NPV and the lower discount rate would result higher NPV. However,<br />
it was found that with the variation <strong>of</strong> discount rate some farms for different cases become<br />
f<strong>in</strong>ancially viable or unviable. So only the farms which are sensitive to the variation <strong>of</strong><br />
discount factor are shown <strong>in</strong> the analysis.
Scenario I<br />
It was found that for case 2 where the cost <strong>of</strong> CO2 and electricity is considered for revenue, at<br />
4% discount rate the farms with the capacity <strong>of</strong> 3000 birds and above are f<strong>in</strong>ancially feasible<br />
to produce electricity. However, at 6% discount rate the farms are not sensitive <strong>in</strong> any cases.<br />
Figure 6.10 shows the variation <strong>of</strong> NPV with the variation <strong>of</strong> discount factor for a 3000 birds<br />
capacity farm.<br />
NPV (BDT)<br />
500000<br />
400000<br />
300000<br />
200000<br />
100000<br />
0<br />
-100000<br />
-200000<br />
Scenario II<br />
Figure 6.10 NPV at different discount factor (3000 birds farm)<br />
8% 6%<br />
Discount Factor (3000 birds farm)<br />
4%<br />
72<br />
E<br />
E+C<br />
E+F<br />
E+F+C<br />
Source: Author<br />
It was found that at 6% discount rate the farms with 3000 birds and above are f<strong>in</strong>ancially<br />
viable to produce electricity for case 2 where the cost <strong>of</strong> CO2 and electricity is considered for<br />
revenue and the farms with 6000 birds and above are even viable for case 1 where only<br />
electricity cost is considered for revenue. Figure 6.11 shows the variation <strong>of</strong> NPV at different<br />
discount rate for 3000 birds’ and the variation <strong>of</strong> NPV for 6000 birds’ farm are given <strong>in</strong><br />
Appendix 6.6.
NPV (BDT)<br />
500000<br />
400000<br />
300000<br />
200000<br />
100000<br />
0<br />
-100000<br />
Figure 6.11 NPV at different discount factor (3000 birds farm)<br />
8% 6%<br />
Discount Factor (3000 Birds)<br />
4%<br />
73<br />
E<br />
E+C<br />
E+F<br />
E+F+C<br />
Source: Author<br />
At 4% discount rate, it was found that for case 2 farms with 2000 birds and above are<br />
f<strong>in</strong>ancially viable and for case 1 farms with 3000 birds and above are f<strong>in</strong>ancially viable to<br />
produce electricity. <strong>The</strong> variation <strong>of</strong> NPV with the variation <strong>of</strong> discount factor for a 2000<br />
birds’ farm is shown <strong>in</strong> Appendix 6.6.<br />
<strong>The</strong> summary <strong>of</strong> estimated potential <strong>of</strong> electricity generation <strong>in</strong> each case under different<br />
scenarios with the variation <strong>of</strong> discount factor is given <strong>in</strong> the follow<strong>in</strong>g Table 6.8 and Table<br />
6.9.<br />
Table 6.8 Summary <strong>of</strong> estimated potential <strong>of</strong> electricity generation <strong>in</strong> GWh/ Year <strong>in</strong> Gazipur<br />
district<br />
Variation <strong>of</strong> Case 1 Case 2 Case 3 Case 4<br />
Discount Rate (E)<br />
(E+C) (E+F) (E+F+C)<br />
Scenario I 8% 0 0 34 34<br />
6% 0 0 34 34<br />
4% 0 19 34 34<br />
Scenario II 8% 0 13 34 34<br />
6% 13 19 34 34<br />
4% 19 29 34 34<br />
Source: Author
Table 6.9 Summary <strong>of</strong> estimated potential <strong>of</strong> electricity generation <strong>in</strong> GWh/ Year <strong>in</strong><br />
Bangladesh<br />
Variation <strong>of</strong> Case 1 Case 2 Case 3 Case 4<br />
Discount Rate (E)<br />
(E+C) (E+F) (E+F+C)<br />
Scenario I 8% 0 0 360 360<br />
6% 0 0 360 360<br />
4% 0 199 360 360<br />
Scenario II 8% 0 135 360 360<br />
6% 135 199 360 360<br />
4% 199 309 360 360<br />
Source: Author<br />
74
7.1 Conclusions<br />
CHAPTER 7 CONCLUSION AND RECOMMENDATION<br />
<strong>The</strong> study looked at the present energy consumption status <strong>in</strong> different poultry farms, the<br />
f<strong>in</strong>ancial viability <strong>of</strong> the m<strong>in</strong>imum sizes <strong>of</strong> poultry farms for different scenarios and different<br />
cases and the potential <strong>of</strong> electricity generation <strong>from</strong> poultry waste.<br />
<strong>The</strong> study has revealed that there is a potential to produce electricity <strong>from</strong> poultry waste and<br />
there is high <strong>in</strong>terest <strong>from</strong> farmers to produce the electricity. This <strong>in</strong>terest has come due to the<br />
fact that all the poultry farms experience load shedd<strong>in</strong>g through out the day mostly <strong>in</strong> the<br />
even<strong>in</strong>g which hampers the production <strong>of</strong> the farm. Accord<strong>in</strong>g to the f<strong>in</strong>d<strong>in</strong>gs electricity can<br />
be produced <strong>from</strong> poultry waste for the total daily consumption <strong>of</strong> most <strong>of</strong> the poultry farms<br />
and <strong>in</strong> addition electricity can also be produced for the peak hour only to save farms <strong>from</strong><br />
be<strong>in</strong>g cut <strong>of</strong>f.<br />
Energy efficient lamps can be used <strong>in</strong> every poultry farm as the purpose <strong>of</strong> us<strong>in</strong>g lamps is<br />
light<strong>in</strong>g only, not heat<strong>in</strong>g.<br />
<strong>The</strong> capacity <strong>of</strong> most <strong>of</strong> the biogas plants <strong>in</strong>stalled <strong>in</strong> different poultry farms is undersized<br />
than its total potential. Produc<strong>in</strong>g electricity is more significant than us<strong>in</strong>g biogas for thermal<br />
purpose because only few farms can sell biogas at least to one customer whereas the majority<br />
<strong>of</strong> the farms does not have any market to sell biogas.<br />
At present there is no commercial value or market <strong>of</strong> slurry as fertilizer <strong>in</strong> general. S<strong>in</strong>ce<br />
people are not aware <strong>of</strong> the value <strong>of</strong> the slurry as organic fertilizer and exist<strong>in</strong>g law does not<br />
permit to sell biogas slurry <strong>in</strong> the market without patent.<br />
<strong>The</strong> technology used <strong>in</strong> the <strong>in</strong>dustry to produce electricity is not proven yet as it is relatively<br />
new <strong>in</strong> the country. However, the technology used <strong>in</strong> GTZ flagship project is more scientific<br />
than others.<br />
<strong>The</strong> ma<strong>in</strong> barriers to dissem<strong>in</strong>ation <strong>of</strong> the technology is the exist<strong>in</strong>g law for market<strong>in</strong>g slurry<br />
as organic fertilizer and the lack <strong>of</strong> awareness <strong>of</strong> the people us<strong>in</strong>g slurry. Moreover, the<br />
technology itself is a barrier as it is not proven yet. Furthermore, the <strong>in</strong>itial <strong>in</strong>vestment cost<br />
for the <strong>in</strong>stallation is also a barrier for the farmers.<br />
F<strong>in</strong>ancial analysis was done for plants rang<strong>in</strong>g <strong>from</strong> 500 birds up to 50000 birds. From the<br />
analysis it was concluded that electricity generation for twelve hours through out the day is<br />
f<strong>in</strong>ancially more feasible than produc<strong>in</strong>g electricity for five hours <strong>in</strong> the peak.<br />
75
Only electricity as a product to earn revenue cannot make the project feasible for any <strong>of</strong> the<br />
scenarios. In addition <strong>of</strong> CO2 cost with the cost <strong>of</strong> electricity still can not make the project<br />
feasible for Scenario I irrespective <strong>of</strong> poultry size. However, for scenario II, farms with 6000<br />
birds and above can go for electricity production.<br />
In addition <strong>of</strong> fertilizer cost with electricity cost makes the project feasible for both the<br />
scenarios for the farms with a capacity <strong>of</strong> 1000 birds and above. Addition <strong>of</strong> CO2 cost with<br />
fertilizer and electricity cost makes the project more pr<strong>of</strong>itable for both the scenarios for the<br />
farms with a capacity <strong>of</strong> 1000 birds and above. <strong>The</strong> farms with the capacity <strong>of</strong> 500 birds are<br />
no way f<strong>in</strong>ancially feasible to produce electricity.<br />
So, it can be said that CO2 can not make too much difference. Fertilizer makes the<br />
difference.<br />
<strong>The</strong>re is no economic potential to produce electricity if only electricity is considered as a<br />
product to earn revenue. In addition <strong>of</strong> CO2 cost with electricity cost the estimated power<br />
production is 13 GWh/year <strong>in</strong> Gazipur district and 135 GWh/year <strong>in</strong> Bangladesh if the<br />
electricity production is run for twelve hours a day. However, there is no potential <strong>in</strong> this case<br />
if electricity is produced for five hours a day. On the contrary, <strong>in</strong> addition <strong>of</strong> fertilizer cost<br />
with the electricity cost the estimated power production is 34 GWh/year <strong>in</strong> Gazipur district<br />
and 360 GWh/year <strong>in</strong> Bangladesh irrespective <strong>of</strong> the duration <strong>of</strong> electricity production.<br />
Rejection/ acceptance <strong>of</strong> the hypothesis: From the above discussion it can be said that there<br />
is a potential <strong>of</strong> produc<strong>in</strong>g electricity <strong>from</strong> poultry waste. So it justifies the first hypothesis<br />
“<strong>Poultry</strong> waste <strong>in</strong> commercial poultry sector as a source <strong>of</strong> biogas has the significant or<br />
substantial potential for electricity generation”.<br />
On the other hand, the above discussion shows that all the poultry farms are not f<strong>in</strong>ancially<br />
viable to produce electricity <strong>from</strong> poultry waste. For different cases under different scenarios<br />
there is a variation <strong>of</strong> potential to produce electricity as because the m<strong>in</strong>imum size <strong>of</strong> poultry<br />
farm is different for different cases. So the second hypothesis “Produc<strong>in</strong>g electricity <strong>from</strong><br />
poultry waste <strong>of</strong> commercial poultry sector as a source <strong>of</strong> biogas is economically<br />
feasible” is partially accepted.<br />
76
7.2 Recommendation<br />
On the basis <strong>of</strong> f<strong>in</strong>d<strong>in</strong>gs and analysis <strong>of</strong> the study the author recommends the follow<strong>in</strong>gs:<br />
Amendment <strong>of</strong> exist<strong>in</strong>g law is required to elim<strong>in</strong>ate the bureaucratic obstacles for the<br />
market<strong>in</strong>g <strong>of</strong> slurry as organic fertilizer.<br />
Awareness development program is required to build up the knowledge about the<br />
benefit <strong>of</strong> us<strong>in</strong>g slurry as fertilizer among the people to create the market.<br />
Awareness development program is required to make the poultry farmers aware about<br />
the use <strong>of</strong> energy efficient appliances which can reduce the electricity consumption <strong>of</strong><br />
the farm.<br />
To make the technology susta<strong>in</strong>able and proven, H2S removal is necessary. For<br />
dissem<strong>in</strong>ation, the technology be<strong>in</strong>g used <strong>in</strong> GTZ flagship project can be replicated<br />
after be<strong>in</strong>g tested properly.<br />
After <strong>in</strong>stallation <strong>of</strong> the system <strong>in</strong> poultry farms, the farmers should be properly<br />
tra<strong>in</strong>ed for regular ma<strong>in</strong>tenance <strong>of</strong> the system otherwise it will <strong>in</strong>cur additional cost to<br />
hire a technician.<br />
<strong>The</strong> supply <strong>of</strong> spare parts for the eng<strong>in</strong>e and other accessories has to be ensured.<br />
Some enterprises can be established to serve the poultry farmer <strong>in</strong> case <strong>of</strong> necessity<br />
regard<strong>in</strong>g the technology used for electricity production.<br />
Installation <strong>of</strong> biogas plant <strong>in</strong> the poultry farms should be made mandatory to avoid<br />
the environmental hazards and should be <strong>in</strong>tegrated <strong>in</strong> the national policy document.<br />
Further study is required for the dissem<strong>in</strong>ation <strong>of</strong> the technology at mass level.<br />
Further study can be done to f<strong>in</strong>d out the potential <strong>of</strong> produc<strong>in</strong>g electricity <strong>from</strong><br />
poultry waste through a centralized system to feed on to the grid.<br />
77
BIBLIOGRAPHY<br />
Ali, Monsh<strong>of</strong>, 2005: “<strong>The</strong> Use and Status <strong>of</strong> Biogas Plants <strong>in</strong> Pabna District <strong>in</strong> Bangladesh”.<br />
M.Sc. thesis, SESAM, Institute <strong>of</strong> International Management, University <strong>of</strong> Flensburg,<br />
Germany (Unpublished).<br />
BB, 2005-2006: Annual Report 2005-2006. Bangladesh Bank http://www.bangladesh-<br />
bank.org pr<strong>in</strong>ted on 20.08.2007<br />
BBS, 2006: Population Census-2001, Community Series, Zilla: Gazipur. Bangladesh Bureau<br />
<strong>of</strong> Statistics, Dhaka.<br />
BBS, 2007: 2005 Statistical Year Book <strong>of</strong> Bangladesh. Bangladesh Bureau <strong>of</strong> Statistics,<br />
Dhaka<br />
BCAS, 2005: Report on Feasibility Study on Biogas <strong>from</strong> <strong>Poultry</strong> Dropp<strong>in</strong>gs. Bangladesh<br />
Centre for Advance Studies.<br />
Boyd, Britta, 2006: Foundation Course <strong>in</strong> Bus<strong>in</strong>ess Studies. SESAM, University <strong>of</strong><br />
Flensburg, Germany<br />
BPDB, 2004-2005: Annual Report 2004-2005. Bangladesh Power Development Board<br />
Ghoshal, A. K., 2005: <strong>Poultry</strong> biggyan (<strong>Poultry</strong> Science). Adittya Prokashaloy, Kolkata, 272<br />
pp. (Translated by Author)<br />
G<strong>of</strong>ran M. A., 2004: <strong>The</strong> Biogas Technology. Ashraf Jazan Begum, Dhaka, 127 pp.<br />
(Translated by Author)<br />
Grameen Shakti, 2006: Biogas Projukthi Nirdeshika. Grameen Shakti, Grameen Bank<br />
Bhavan, Mirour-2, Dhaka. (Translated by Author)<br />
Hossa<strong>in</strong>, Ijaz and M. Tamim, 2005/2006: Energy and Susta<strong>in</strong>able Development <strong>in</strong><br />
Bangladesh. In: Susta<strong>in</strong>able Energy Watch 2005/2006, HELIO International<br />
http://www.helio-<strong>in</strong>ternational.org/reports/pdfs/Bngldesh-EN.pdf pr<strong>in</strong>ted on 20.08.2007<br />
Kapoor, K. and Philippe Ambrosi,. 2007: State and Trends <strong>of</strong> <strong>The</strong> Carbon Market 2007.<br />
Wash<strong>in</strong>gton D. C. http://etseq.law.harvard.edu/images/uploads/StateCarbon.pdf p. 4, pr<strong>in</strong>ted<br />
on 06.07.2007<br />
Kumar, Sanjay, 1987: Contributions <strong>in</strong> Petroleum Geology and Eng<strong>in</strong>eer<strong>in</strong>g, Volume 4: Gas<br />
Production Eng<strong>in</strong>eer<strong>in</strong>g. Gulf Publish<strong>in</strong>g Company, Huston, 646 pp.<br />
Latif, Md. Abdul, 1981: Primary <strong>Poultry</strong> Science. Bangla Academy, Dhaka, 130<br />
pp.(Translated by Author)<br />
78
Mann<strong>in</strong>g, Francis S. and Richard E. Thompson, 1991: Oil Field Process<strong>in</strong>g <strong>of</strong> Petroleum,<br />
Volume One: Natural Gas. Pennwell Publish<strong>in</strong>g Company, Tulsa, Oklahama, 408 pp.<br />
Nazn<strong>in</strong>, Nadira, 2006: “Study <strong>of</strong> a SI Eng<strong>in</strong>e Us<strong>in</strong>g Biogas for Driv<strong>in</strong>g a Small Generator”.<br />
M.Sc. Eng<strong>in</strong>eer<strong>in</strong>g thesis, Department <strong>of</strong> Mechanical Eng<strong>in</strong>eer<strong>in</strong>g, BUET, Dhaka,<br />
Bangladesh (Unpublished).<br />
NEP, 2004: National Energy Policy. M<strong>in</strong>istry <strong>of</strong> Power, Energy and M<strong>in</strong>eral Resources,<br />
People’s Republic <strong>of</strong> Bangladesh http://www.petrobangla.org.bd/NEP_2004_fulldoc.pdf<br />
pr<strong>in</strong>ted on 15.08.2007<br />
NEP, 2006: National Energy Policy (Draft). M<strong>in</strong>istry <strong>of</strong> Power, Energy and M<strong>in</strong>eral<br />
Resources, People’s Republic <strong>of</strong> Bangladesh (Unpublished).<br />
Nes Wim J. van, Willem Boers and Khurseed-Ul-Islam, 2005: Feasibility <strong>of</strong> a national<br />
programme on domestic biogas <strong>in</strong> Bangladesh, Netherland Development Organisation,<br />
Hague, Netherland<br />
http://www.idcol.org/files/download/Report_on_biogas_feasibility_study_Bangladesh__f<strong>in</strong>al<br />
.pdf pr<strong>in</strong>ted on 20.08.2007<br />
Policy Guidel<strong>in</strong>es for Power Purchase <strong>from</strong> Captive Power Plant, 2007. Power Division,<br />
M<strong>in</strong>istry <strong>of</strong> Power, Energy and M<strong>in</strong>eral Resources, People’s Republic <strong>of</strong> Bangladesh.<br />
Policy Guidel<strong>in</strong>es for Small Power Plant (SPP) <strong>in</strong> private sector, 2001. Bangladesh Gazette<br />
http://www.idcol.org/files/download/pgspp.pdf pr<strong>in</strong>ted on 15.08.2007<br />
Rehl<strong>in</strong>g, Uwe, 2006: Small Biogas Plants. SESAM, University <strong>of</strong> Flensburg, Germany.<br />
Shikdar, Muhammad Hassanuzzaman, 2005: “Study <strong>of</strong> Natural Gas Process<strong>in</strong>g <strong>in</strong><br />
Bangladesh”. M. Eng<strong>in</strong>eer<strong>in</strong>g thesis, Department <strong>of</strong> Petroleum and M<strong>in</strong>eral Resources<br />
Eng<strong>in</strong>eer<strong>in</strong>g, BUET, Dhaka, Bangladesh (Unpublished).<br />
Internet Sources<br />
http://banglapedia.search.com.bd/Maps/MG_0065.GIF pr<strong>in</strong>ted on 10.06.2007<br />
http://en.wikipedia.org/wiki/Net_present_value, pr<strong>in</strong>ted on 15.08.2008<br />
http://www.acdis.uiuc.edu/Research/OPs/Samr<strong>in</strong>a/contents/part1.html, pr<strong>in</strong>ted on 18.08.2007<br />
http://www.bangladesh-bank.org/econdata/exchangerate.php pr<strong>in</strong>ted on 06.07.2007<br />
http://www.bpdb.gov.bd/download/Daily_Summery_Report.pdf pr<strong>in</strong>ted on 20.08.2007<br />
http://www.bpdb.gov.bd/<strong>in</strong>stalled_fuel.htm pr<strong>in</strong>ted on 20.08.2007<br />
http://www.bpdb.gov.bd/key_statistics.htm pr<strong>in</strong>ted on 20.08.2007<br />
http://www.odellion.com/pages/onl<strong>in</strong>e%20community/Payback/f<strong>in</strong>ancialmodels_payback_eq<br />
uations.htm pr<strong>in</strong>ted on 10.08.2007<br />
79
http://www.un.org/Depts/Cartographic/map/pr<strong>of</strong>ile/banglade.pdf pr<strong>in</strong>ted on 10.06.2007<br />
Person contacted and organization visited<br />
1. Dr.-Ing. Khursheed-Ul-Islam, Consultant, GTZ Bangladesh, Dhaka<br />
2. Local Government Eng<strong>in</strong>eer<strong>in</strong>g Department, Agargaon, Dhaka<br />
3. Mr. A. S. Md. Abdul Hannan, Scientific Officer, Department <strong>of</strong> Livestock Services,<br />
Dhaka-1215, Bangladesh<br />
4. Mr. Harun Ur Rashid Talukder, Manager, Fair Trade International, Dhaka, Bangladesh<br />
5. Mr. Kazi Akhtaruzzaman, Director, BCSIR Laboratories, Dhaka<br />
6. Mr. M.A.G<strong>of</strong>ran, Biogas Consultant, Grameen Shakti, Dhaka<br />
7. Mr. Md. Kafiludd<strong>in</strong> Bhuyan, District Livestock Officer, Gazipur<br />
8. Mr. Susanta Chandra Sarkar, Assistant General Maganger (F<strong>in</strong>ance), Gazipur PBS<br />
9. Mr. Tareq Mustafa, Assistant Eng<strong>in</strong>eer, TGTDCL, Dhaka<br />
10. Power Cell, Power Division, M<strong>in</strong>istry <strong>of</strong> Power, Energy and M<strong>in</strong>eral Resources, Govt. <strong>of</strong><br />
the People's Republic <strong>of</strong> Bangladesh<br />
80
Appendix A: Questionnaire<br />
APPENDICES<br />
Survey on the <strong>Potential</strong> <strong>of</strong> <strong>Electricity</strong> <strong>Generation</strong> <strong>from</strong> <strong>Poultry</strong> <strong>Waste</strong><br />
<strong>in</strong> Bangladesh. A case study <strong>of</strong> Gazipur District<br />
SL No:<br />
Part A: General Information<br />
1.1 Name <strong>of</strong> the farm :<br />
1.2 Address :<br />
1.3 District:<br />
1.4 Contact Number:<br />
1.5 Contact Person:<br />
1.6 Number <strong>of</strong> Bird: -------------- No.<br />
1.7 Type <strong>of</strong> Birds:<br />
1Broiler<br />
2Layer<br />
Part B: Present Energy Consumption Status<br />
2.1 What is the name <strong>of</strong> your electricity provider?<br />
1PDB<br />
2REB<br />
3DESA<br />
4DESCO<br />
5Others (please specify) ---------------<br />
2.2 Do you have any energy deficit (Load Shedd<strong>in</strong>g)?<br />
1Yes, go to question 2.3<br />
2No, go to question 2.4<br />
2.3 What is the frequency <strong>of</strong> load shedd<strong>in</strong>g (hours/day)?<br />
Please specify --------------------------------<br />
2.4 Do you have any back up system?<br />
1Yes, go to question 2.5<br />
2No, go to question 2.7<br />
81<br />
Date: . . 07
2.5 What type <strong>of</strong> back up system do you have?<br />
1Diesel Generator<br />
2Natural Gas Generator<br />
3Biogas generator<br />
4Grid<br />
5Others (Please specify) -------------<br />
2.6 What is the capacity <strong>of</strong> your back up systems?<br />
----------------------------------------------------------------------------------------------------------------<br />
--------------------------------------------------------------------------------------------------------<br />
2.7 What is your monthly energy consumption accord<strong>in</strong>g to different energy carriers? Please<br />
specify the consumption and energy carriers.<br />
N<br />
o<br />
Energ<br />
y<br />
Carrie<br />
rs<br />
Monthly Consumption<br />
Jan Feb Mar Apr May Jun Jul Aug Sep Oct Nov Dec<br />
82<br />
Total Unit
2.8 What is your total annual energy demand?<br />
Electrical<br />
Equipment/<br />
Appliances<br />
Light<br />
Fan<br />
Brooder<br />
Scrapper<br />
motor<br />
Water motor<br />
Qty<br />
Total<br />
Power<br />
(kW)<br />
Power<br />
factor (if<br />
applicab<br />
le)<br />
83<br />
Average<br />
use<br />
hours<br />
<strong>in</strong> week<br />
day<br />
Average<br />
use<br />
hours<br />
<strong>in</strong><br />
weekend<br />
Total<br />
hours<br />
per<br />
week<br />
Weeks<br />
<strong>in</strong><br />
operatio<br />
n per<br />
year<br />
Total<br />
energy<br />
per<br />
year<br />
(kWh)<br />
2.9 What is your daily energy consumption/ demand pattern <strong>in</strong> summer?<br />
Hours <strong>of</strong><br />
Power (KW) Total<br />
day<br />
(KW)<br />
Light Fan Brooder Scrapper Water<br />
motor motor<br />
0-1<br />
1-2<br />
2-3<br />
3-4<br />
4-5<br />
5-6<br />
6-7<br />
7-8<br />
8-9<br />
9-10<br />
10-11<br />
11-12<br />
12-13<br />
13-14<br />
14-15<br />
15-16<br />
16-17<br />
17-18<br />
18-19<br />
19-20<br />
20-21<br />
21-22<br />
22-23<br />
23-24
2.10 What is your daily energy consumption/ demand pattern <strong>in</strong> w<strong>in</strong>ter?<br />
Hours <strong>of</strong><br />
Power (KW) Total<br />
day<br />
(KW)<br />
Light Fan Brooder Scrapper Water<br />
motor motor<br />
0-1<br />
1-2<br />
2-3<br />
3-4<br />
4-5<br />
5-6<br />
6-7<br />
7-8<br />
8-9<br />
9-10<br />
10-11<br />
11-12<br />
12-13<br />
13-14<br />
14-15<br />
15-16<br />
16-17<br />
17-18<br />
18-19<br />
19-20<br />
20-21<br />
21-22<br />
22-23<br />
23-24<br />
2.11 What is the amount <strong>of</strong> poultry waste <strong>from</strong> slaughter<strong>in</strong>g per day?<br />
---------------------------------------------------------------------------------------------------kg/day<br />
2.12 How do you dispose your poultry waste? (Please specify)<br />
a) From dropp<strong>in</strong>gs -------------------------------------------------------------------------------------<br />
b) From slaughter<strong>in</strong>g ----------------------------------------------------------------------------------<br />
2.13 Do you use the poultry waste as fertilizer?<br />
1Yes, go to question 2.15<br />
2No, go to question 2.17<br />
2.14 What is the quantity <strong>of</strong> your poultry waste as fertilizer? ------------------ ------kg/ year<br />
2.15 What is amount <strong>of</strong> your <strong>in</strong>come <strong>from</strong> sell<strong>in</strong>g fertilizer? -------------------- ----Tk./year<br />
2.16 Do you already have a biogas plant <strong>from</strong> poultry waste?<br />
1Yes, go to question 2.18<br />
2No, go to Section C<br />
84
2.17 What is the size <strong>of</strong> the biogas plant?<br />
Please specify the amount <strong>of</strong> biogas production/ day --------------------------------------------<br />
2.18 In which year or date did you <strong>in</strong>stall the biogas plant?<br />
Please specify ------------------------------------------------------------------------------------------<br />
2.19 Do you sell biogas?<br />
1Yes, go to question 2.21<br />
2No, go to question 2.23<br />
2.20 What is the quantity <strong>of</strong> sold biogas per month?<br />
Please specify ------------------------------------------------------------------------------------------<br />
2.21 What is the amount <strong>of</strong> money do you earn <strong>from</strong> sell<strong>in</strong>g biogas per month?<br />
Please specify ------------------------------------------------------------------------------------------<br />
2.22 Do you produce electricity <strong>from</strong> your biogas plant?<br />
1Yes, go to question 2.24<br />
2No, go to Section C<br />
2.23 What is the capacity and rat<strong>in</strong>gs <strong>of</strong> the generator?<br />
Please specify ------------------------------------------------------------------------------------------<br />
2.24 In which year or date did you <strong>in</strong>stall the generator for electricity production?<br />
Please specify ------------------------------------------------------------------------------------------<br />
2.25 What is the percentage <strong>of</strong> your demand that is met by electricity generated <strong>from</strong> biogas<br />
plant?<br />
Please specify ------------------------------------------------------------------------------------------<br />
2.26 Do you experience any problem with the system?<br />
Please specify ------------------------------------------------------------------------------------------<br />
85
Part C. Attitude toward <strong>Electricity</strong> <strong>Generation</strong> <strong>from</strong> <strong>Poultry</strong> <strong>Waste</strong><br />
3.1 Are you <strong>in</strong>terested to produce electricity <strong>from</strong> your own poultry waste?<br />
1Yes, go to question 3.2<br />
2No, go to Section D<br />
3.2 Why are you <strong>in</strong>terested to produce electricity <strong>from</strong> your own poultry waste?<br />
Please specify the reasons ----------------------------------------------------------------------<br />
86
Part D. <strong>The</strong> Barriers <strong>of</strong> the Dissem<strong>in</strong>ation <strong>of</strong> the Technology<br />
4.1 What is/are the barriers <strong>of</strong> the dissem<strong>in</strong>ation <strong>of</strong> the technology to produce electricity <strong>from</strong><br />
own poultry waste?<br />
Please specify the reasons -------------------------------------------------------------------------<br />
Thank you for tak<strong>in</strong>g the time to fill out the survey. Your <strong>in</strong>put is greatly appreciate<br />
87
Size <strong>of</strong><br />
poultry Farm<br />
No. <strong>of</strong><br />
lamps<br />
used<br />
Wattage<br />
<strong>of</strong> lamp<br />
Appendix 4<br />
Energy Consumption Status <strong>of</strong> Different <strong>Poultry</strong> Farms:<br />
No <strong>of</strong><br />
fans<br />
used<br />
No.<br />
hours<br />
use <strong>of</strong><br />
fan<br />
Hours <strong>of</strong><br />
load<br />
shedd<strong>in</strong>g<br />
per day<br />
Use <strong>of</strong><br />
back up<br />
system<br />
Size <strong>of</strong><br />
back up<br />
system<br />
(kW)<br />
Annual energy<br />
consumption<br />
(kWh)<br />
Exist<strong>in</strong>g size<br />
<strong>of</strong> biogas<br />
plant (m 3 )<br />
Size <strong>of</strong> biogas<br />
plant (m 3 ) with<br />
total potential<br />
2000 18 26 10 10 4 Yes 2 5379 9 14<br />
1250 9 40 6 6 4 Yes 3 2435 9 9<br />
2400 20 26 7 7 4 Yes 3 5105 9 17<br />
2500 18 60 13 6 4 No - 3573 9 18<br />
2500 25 60 10 9 4 No - 9458 6 18<br />
1625 10 40 0 0 4 No - 3139 9 12<br />
2000 20 26 0 0 4 No - 2123 6 14<br />
2000 12 40 0 0 4 No - 1245 9 14<br />
1400 12 40 6 6 4 No - 2942 9 10<br />
1350 6 40 3 6 4 No - 1342 9 10<br />
1450 9 40 0 0 4 No - 1102 6 10<br />
3000 24 40 0 0 4 No - 3761 6 21<br />
1600 16 40 2 6 4 No - 1476 4 11<br />
1400 8 40 2 6 4 No - 1769 6 10<br />
3000 22 40 1 6 4 No - 3072 4 21<br />
2500 26 40 0 0 4 No - 2094 2 18<br />
3200 20 40 2 6 4 No - 2009 4 23<br />
1000 8 60 0 0 4 No - 701 6 7<br />
7000 80 40 50 12 4 Yes 15 20508 9 50<br />
800 6 26 5 12 3 No - 1135 4 6<br />
1000 5 26 3 7 3 No - 507 3 7<br />
2000 20 40 16 8 7 Yes 5 5261 6 14<br />
2000 16 40 10 8 7 No - 3476 6 14<br />
5000 40 100 20 8 7 No - 12908 6 35<br />
2000 20 100 10 8 7 No - 4994 6 14<br />
Sheikh Ashraf Uz Zaman, SESAM 2007, University <strong>of</strong> Flensburg 88
Size <strong>of</strong><br />
poultry Farm<br />
No. <strong>of</strong><br />
lamps<br />
used<br />
Wattage<br />
<strong>of</strong> lamp<br />
Appendix 4 (Contd…)<br />
Energy Consumption Status <strong>of</strong> Different <strong>Poultry</strong> Farms:<br />
No <strong>of</strong><br />
fans<br />
used<br />
No.<br />
hours<br />
use <strong>of</strong><br />
fan<br />
Hours <strong>of</strong><br />
load<br />
shedd<strong>in</strong>g<br />
per day<br />
Use <strong>of</strong><br />
back up<br />
system<br />
Size <strong>of</strong><br />
back up<br />
system<br />
(kW)<br />
Annual energy<br />
consumption<br />
(kWh)<br />
Exist<strong>in</strong>g size<br />
<strong>of</strong> biogas<br />
plant (m 3 )<br />
Size <strong>of</strong> biogas<br />
plant (m 3 ) with<br />
total potential<br />
5000 50 100 30 8 7 Yes 7.5 11747 6 35<br />
1000 10 40 5 10 4 No - 1340 - -<br />
900 20 60 6 8 4 No - 2750 - -<br />
1500 8 26 5 10 4 No - 2342 - -<br />
1800 12 40 0 0 4 No - 701 - -<br />
2000 6 100 8 10 3 No - 2838 - -<br />
2000 6 100 6 3 3 No - 1350 - -<br />
1300 12 60 8 8 4 No - 2978 - -<br />
600 8 60 4 10 3 No - 1882 - -<br />
3500 22 40 20 8 4 Yes 5 5129 - -<br />
5000 60 40 32 12 4 Yes 10 14465 - -<br />
3000 18 40 24 12 5 Yes 7.5 9408 - -<br />
11000 72 40 84 12 4 Yes 7.5 23179 - -<br />
4000 50 100 18 12 4 Yes 5 7579 - -<br />
8500 50 40 50 15 4 Yes 7.5 21144 - -<br />
2000 20 100 8 8 7 Yes 15 4752 - -<br />
4000 40 100 20 8 7 Yes 15 10852 - -<br />
1000 10 100 6 8 7 No - 3050 - -<br />
2000 16 100 10 8 7 No - 4410 - -<br />
2500 16 100 3 8 7 No - 4427 - -<br />
2000 20 100 10 8 7 No - 4994 - -<br />
8000 80 100 40 8 7 Yes 10 21610 - -<br />
2000 10 100 6 6 7 No - 3050 - -<br />
2200 12 26 12 6 3 No - 1817 - -<br />
2000 18 100 12 6 5 No - 5013 - -<br />
Sheikh Ashraf Uz Zaman, SESAM 2007, University <strong>of</strong> Flensburg 89
Appendix 6.1<br />
Percentage consumption <strong>of</strong> energy <strong>from</strong> own production for Scenario I<br />
Hours <strong>of</strong> operation 5<br />
number <strong>of</strong> bird 5000<br />
Dropp<strong>in</strong>gs/day 500 kg<br />
gas production 31.5 m3<br />
electricity production 42 kWh<br />
generator size 8.4 kW<br />
annual consumption by poultry 8113.75 kWh<br />
annual production<br />
% consumption<br />
15330 kWh<br />
Consider 100 watt lamp 52.92727 %<br />
Consider 60 watt lamp 33.87965 %<br />
Consider 40 watt lamp 24.35584 %<br />
Consider 26 watt lamp 17.68917 %<br />
Average consumption 32.21298 %<br />
So, % <strong>of</strong> energy to be sold 67.79 %<br />
Percentage consumption <strong>of</strong> energy <strong>from</strong> own production for Scenario II<br />
Hours <strong>of</strong> operation 12<br />
number <strong>of</strong> bird 5000<br />
Dropp<strong>in</strong>gs/day 500 kg<br />
gas production 31.5 m3<br />
electricity production 42 kWh<br />
generator size 3.5 kW<br />
annual consumption by poultry 11794 kWh<br />
annual production 15330 kWh<br />
% consumption<br />
100 watt lamp 76.93 %<br />
60 watt lamp 57.88 %<br />
40 watt lamp 48.36 %<br />
26 watt lamp 41.69 %<br />
Average consumption 57 %<br />
% <strong>of</strong> energy to be sold 43 %<br />
90
<strong>Electricity</strong> Tariff <strong>of</strong> Gazipur PBS<br />
Appendix 6.2<br />
Category Range Tariff Unit<br />
Domestic Up to 100 unit= 2.53 Tk/ kWh<br />
Domestic 101 to 300 unit= 2.57 Tk/ kWh<br />
Domestic 301 to 500 unit= 3.89 Tk/ kWh<br />
Domestic More than 500 unit= 5.3 Tk/ kWh<br />
M<strong>in</strong>imum charge for domestic 84 Tk/month<br />
Commercial 5.11 Tk/ kWh<br />
M<strong>in</strong>imum charge for commercial 120 Tk/month<br />
Charitable <strong>in</strong>stitute 3.28 Tk/ kWh<br />
Small Industrial 4.01 Tk/ kWh<br />
Large Industry 3.91 Tk/ kWh<br />
depends on load and other factors<br />
M<strong>in</strong>imum charge<br />
Irrigation 3.02 Tk/ kWh<br />
Street light 3.75 Tk/ kWh<br />
VAT Applicable 5%<br />
*<strong>Poultry</strong> farms are considered under commercial category.<br />
*<strong>Poultry</strong> farms hav<strong>in</strong>g upto 1000 birds are considered under domestic category<br />
*<strong>Poultry</strong> farms hav<strong>in</strong>g more than 1000 birds are under commercial category and these farms<br />
get 20% rebate on the total bill.<br />
Source: <strong>in</strong>terview with Susanta Chandra Sarkar, Assistant General Maganger (F<strong>in</strong>ance),<br />
Gazipur PBS, dated 28.06.07<br />
91
Appendix 6.3<br />
Calculation <strong>of</strong> CO2 sav<strong>in</strong>gs <strong>of</strong> produc<strong>in</strong>g electricity <strong>from</strong> poultry waste:<br />
As biogas is an alternative source <strong>of</strong> energy the emission <strong>of</strong> produc<strong>in</strong>g electricity <strong>from</strong><br />
poultry waste is considered zero.<br />
More than 85% electricity <strong>of</strong> the country comes <strong>from</strong> natural gas (discussed <strong>in</strong> chapter 2). So<br />
the total sav<strong>in</strong>g <strong>of</strong> CO2 can be compared with the CO2 emission <strong>from</strong> the natural gas power<br />
plant.<br />
Accord<strong>in</strong>g to BP World Energy (2005) the total electricity production <strong>in</strong> Bangladesh was<br />
21.57 TWh <strong>in</strong> the year 2004. (http://www.iaea.org/<strong>in</strong>isnkm/nkm/aws/eedrb/data/BD-elp.html<br />
date: 06.08.2007)<br />
Accord<strong>in</strong>g to US DOE 2005 the total energy related CO2 emission was 35.67 million ton <strong>in</strong><br />
the year 2003 <strong>in</strong> Bangladesh. (http://www.iaea.org/<strong>in</strong>isnkm/nkm/aws/eedrb/data/BDenem.html,<br />
date:06.08.2007)<br />
Accord<strong>in</strong>g to US DOE (2005) the fraction <strong>of</strong> CO2 emission <strong>from</strong> natural gas was 60.9% <strong>of</strong><br />
the total energy related emission.<br />
(http://www.iaea.org/<strong>in</strong>isnkm/nkm/aws/eedrb/data/BD-enemgas.html, date: 06.08.2007)<br />
Out <strong>of</strong> the total energy related consumption <strong>of</strong> natural gas, power sector consumes about<br />
48.12% (calculated <strong>from</strong> figure 2.1 <strong>of</strong> this report).<br />
So total emission <strong>from</strong> natural gas <strong>in</strong>volved <strong>in</strong> electricity production is 35.67 X 60.9% X<br />
48.12% which is equal to 10.45 million ton <strong>of</strong> CO2.<br />
Hence the CO2 emission <strong>from</strong> natural gas electricity <strong>in</strong> the country is 10.45 Mt <strong>of</strong> CO2/(21.57<br />
TWhX85.5%) which is equivalent to 0.57 ton <strong>of</strong> CO2 per MWh.<br />
92
Appendix 6.4<br />
Detail result <strong>of</strong> Scenario I (produc<strong>in</strong>g electricity for 5 hours dur<strong>in</strong>g country peak):<br />
No. <strong>of</strong> Birds Products for revenue earn<strong>in</strong>g NPV (BDT) IRR<br />
(%)<br />
500<br />
1000<br />
2000<br />
3000<br />
4000<br />
5000<br />
6000<br />
<strong>Electricity</strong><br />
<strong>Electricity</strong> + CO2<br />
<strong>Electricity</strong> + Fertilizer<br />
<strong>Electricity</strong> + Fertilizer + CO2<br />
<strong>Electricity</strong><br />
<strong>Electricity</strong> + CO2<br />
<strong>Electricity</strong> + Fertilizer<br />
<strong>Electricity</strong> + Fertilizer + CO2<br />
<strong>Electricity</strong><br />
<strong>Electricity</strong> + CO2<br />
<strong>Electricity</strong> + Fertilizer<br />
<strong>Electricity</strong> + Fertilizer + CO2<br />
<strong>Electricity</strong><br />
<strong>Electricity</strong> + CO2<br />
<strong>Electricity</strong> + Fertilizer<br />
<strong>Electricity</strong> + Fertilizer + CO2<br />
<strong>Electricity</strong><br />
<strong>Electricity</strong> + CO2<br />
<strong>Electricity</strong> + Fertilizer<br />
<strong>Electricity</strong> + Fertilizer + CO2<br />
<strong>Electricity</strong><br />
<strong>Electricity</strong> + CO2<br />
<strong>Electricity</strong> + Fertilizer<br />
<strong>Electricity</strong> + Fertilizer + CO2<br />
<strong>Electricity</strong><br />
<strong>Electricity</strong> + CO2<br />
<strong>Electricity</strong> + Fertilizer<br />
<strong>Electricity</strong> + Fertilizer + CO2<br />
93<br />
Pay back<br />
period (Years)<br />
-64000 - -<br />
-58626 - -<br />
-22605 2.58 36.94<br />
-17231 3.83 30.74<br />
-72621 - -<br />
-61873 - -<br />
10168 9.69 9.63<br />
20917 11.47 8.42<br />
-100015 - 84.65<br />
-78518 1.01 49.95<br />
65564 13.92 7.28<br />
87061 15.85 6.57<br />
-82442 2.64 37.74<br />
-50198 4.74 28.02<br />
165926 18.88 4.41<br />
198171 20.97 4.05<br />
-128398 1.77 43.67<br />
-85406 3.85 31.27<br />
202760 17.93 4.55<br />
245752 20.00 4.18<br />
-135827 2.62 37.73<br />
-82086 4.74 27.93<br />
278121 19.10 4.35<br />
331862 21.22 3.99<br />
-154364 2.83 36.47<br />
-89876 4.97 27.13<br />
342373 19.52 4.28<br />
406862 21.67 3.93
Appendix 6.4 (Contd…)<br />
Detail result <strong>of</strong> Scenario I (produc<strong>in</strong>g electricity for 5 hours dur<strong>in</strong>g country peak):<br />
No. <strong>of</strong> Birds Products for revenue earn<strong>in</strong>g NPV (BDT) IRR<br />
(%)<br />
7000<br />
8000<br />
9000<br />
10000<br />
15000<br />
20000<br />
50000<br />
<strong>Electricity</strong><br />
<strong>Electricity</strong> + CO2<br />
<strong>Electricity</strong> + Fertilizer<br />
<strong>Electricity</strong> + Fertilizer + CO2<br />
<strong>Electricity</strong><br />
<strong>Electricity</strong> + CO2<br />
<strong>Electricity</strong> + Fertilizer<br />
<strong>Electricity</strong> + Fertilizer + CO2<br />
<strong>Electricity</strong><br />
<strong>Electricity</strong> + CO2<br />
<strong>Electricity</strong> + Fertilizer<br />
<strong>Electricity</strong> + Fertilizer + CO2<br />
<strong>Electricity</strong><br />
<strong>Electricity</strong> + CO2<br />
<strong>Electricity</strong> + Fertilizer<br />
<strong>Electricity</strong> + Fertilizer + CO2<br />
<strong>Electricity</strong><br />
<strong>Electricity</strong> + CO2<br />
<strong>Electricity</strong> + Fertilizer<br />
<strong>Electricity</strong> + Fertilizer + CO2<br />
<strong>Electricity</strong><br />
<strong>Electricity</strong> + CO2<br />
<strong>Electricity</strong> + Fertilizer<br />
<strong>Electricity</strong> + Fertilizer + CO2<br />
<strong>Electricity</strong><br />
<strong>Electricity</strong> + CO2<br />
<strong>Electricity</strong> + Fertilizer<br />
<strong>Electricity</strong> + Fertilizer + CO2<br />
94<br />
Pay back<br />
period (Years)<br />
-199316 2.34 39.54<br />
-124079 4.48 28.88<br />
380211 18.89 4.37<br />
455448 21.01 4.02<br />
-206744 2.80 36.63<br />
-120759 4.94 27.21<br />
455572 19.53 4.27<br />
541557 21.67 3.93<br />
-225282 2.91 35.92<br />
-128549 5.09 26.77<br />
519824 19.76 4.23<br />
616557 21.92 3.89<br />
-270234 2.58 38.04<br />
-162753 4.73 27.99<br />
557662 19.29 4.30<br />
665143 21.44 3.95<br />
-367117 2.98 35.49<br />
-205896 5.20 26.48<br />
874726 19.95 4.2<br />
1035948 22.13 3.86<br />
-560038 2.36 39.41<br />
-345076 4.52 28.71<br />
1095753 19.13 4.32<br />
1310715 21.29 3.96<br />
-1277215 2.80 36.67<br />
-739809 4.96 27.15<br />
2862262 19.73 4.22<br />
3399668 21.90 3.88
Appendix 6.5<br />
Detail result <strong>of</strong> Scenario II (produc<strong>in</strong>g electricity for 12 hours a day):<br />
No. <strong>of</strong> Birds Products for revenue earn<strong>in</strong>g NPV (BDT) IRR (%) Pay back<br />
period(Years)<br />
500<br />
1000<br />
2000<br />
3000<br />
4000<br />
5000<br />
6000<br />
<strong>Electricity</strong><br />
<strong>Electricity</strong> + CO2<br />
<strong>Electricity</strong> + Fertilizer<br />
<strong>Electricity</strong> + Fertilizer + CO2<br />
<strong>Electricity</strong><br />
<strong>Electricity</strong> + CO2<br />
<strong>Electricity</strong> + Fertilizer<br />
<strong>Electricity</strong> + Fertilizer + CO2<br />
<strong>Electricity</strong><br />
<strong>Electricity</strong> + CO2<br />
<strong>Electricity</strong> + Fertilizer<br />
<strong>Electricity</strong> + Fertilizer + CO2<br />
<strong>Electricity</strong><br />
<strong>Electricity</strong> + CO2<br />
<strong>Electricity</strong> + Fertilizer<br />
<strong>Electricity</strong> + Fertilizer + CO2<br />
<strong>Electricity</strong><br />
<strong>Electricity</strong> + CO2<br />
<strong>Electricity</strong> + Fertilizer<br />
<strong>Electricity</strong> + Fertilizer + CO2<br />
<strong>Electricity</strong><br />
<strong>Electricity</strong> + CO2<br />
<strong>Electricity</strong> + Fertilizer<br />
<strong>Electricity</strong> + Fertilizer + CO2<br />
<strong>Electricity</strong><br />
<strong>Electricity</strong> + CO2<br />
<strong>Electricity</strong> + Fertilizer<br />
<strong>Electricity</strong> + Fertilizer + CO2<br />
95<br />
-56812 - -<br />
-51438 - -<br />
-15417 3.92 30.73<br />
-10043 5.35 25.89<br />
-73413 - -<br />
-62665 - -<br />
9377 9.56 12.49<br />
8.51<br />
20125 11.33<br />
-50256 3.28 33.99<br />
-28760 5.30 26.16<br />
115323 18.91 4.40<br />
136820 20.91 4.05<br />
-42740 5.18 26.57<br />
-10496 7.33 21.29<br />
205629 21.60 3.97<br />
237873 23.70 3.68<br />
-86220 3.81 31.45<br />
-43228 5.89 24.46<br />
244938 19.97 4.19<br />
287931 22.04 3.87<br />
-83185 4.70 28.09<br />
-29444 6.83 22.27<br />
330763 21.18 4.00<br />
384503 23.29 3.71<br />
-57167 6.03 24.17<br />
7321 8.27 17.69<br />
439570 23.08 3.76<br />
504059 25.27 3.49
Appendix 6.5 (Contd…)<br />
Detail result <strong>of</strong> Scenario II (produc<strong>in</strong>g electricity for 12 hours a day):<br />
No. <strong>of</strong> Birds Products for revenue earn<strong>in</strong>g NPV (BDT) IRR (%) Pay back<br />
period(Years)<br />
7000<br />
8000<br />
9000<br />
10000<br />
15000<br />
20000<br />
50000<br />
<strong>Electricity</strong><br />
<strong>Electricity</strong> + CO2<br />
<strong>Electricity</strong> + Fertilizer<br />
<strong>Electricity</strong> + Fertilizer + CO2<br />
<strong>Electricity</strong><br />
<strong>Electricity</strong> + CO2<br />
<strong>Electricity</strong> + Fertilizer<br />
<strong>Electricity</strong> + Fertilizer + CO2<br />
<strong>Electricity</strong><br />
<strong>Electricity</strong> + CO2<br />
<strong>Electricity</strong> + Fertilizer<br />
<strong>Electricity</strong> + Fertilizer + CO2<br />
<strong>Electricity</strong><br />
<strong>Electricity</strong> + CO2<br />
<strong>Electricity</strong> + Fertilizer<br />
<strong>Electricity</strong> + Fertilizer + CO2<br />
<strong>Electricity</strong><br />
<strong>Electricity</strong> + CO2<br />
<strong>Electricity</strong> + Fertilizer<br />
<strong>Electricity</strong> + Fertilizer + CO2<br />
<strong>Electricity</strong><br />
<strong>Electricity</strong> + CO2<br />
<strong>Electricity</strong> + Fertilizer<br />
<strong>Electricity</strong> + Fertilizer + CO2<br />
<strong>Electricity</strong><br />
<strong>Electricity</strong> + CO2<br />
<strong>Electricity</strong> + Fertilizer<br />
<strong>Electricity</strong> + Fertilizer + CO2<br />
96<br />
-53343 6.43 23.25<br />
21894 8.67 14.01<br />
526184 23.65 3.70<br />
601421 25.85 3.43<br />
-68490 6.23 23.7<br />
17495 8.48 16.59<br />
593826 23.39 3.72<br />
679811 25.58 3.45<br />
-63252 6.55 22.98<br />
33481 8.79 13.73<br />
681854 23.85 3.67<br />
778587 26.06 3.40<br />
-70467 6.54 22.99<br />
37015 8.79 13.74<br />
757429 23.87 3.67<br />
864910 26.09 3.40<br />
-42953 7.41 21.15<br />
118269 9.71 12.07<br />
1198890 25.09 3.53<br />
1360112 27.36 3.27<br />
-181933 6.09 24.03<br />
33029 8.37 17.11<br />
1473858 23.44 3.71<br />
1688820 25.66 3.44<br />
-250781 6.93 22.08<br />
286625 9.24 12.83<br />
3888696 24.55 3.58<br />
4426102 26.8 3.33
IRR (%)<br />
IRR (%)<br />
28<br />
24<br />
20<br />
16<br />
12<br />
8<br />
4<br />
0<br />
32<br />
28<br />
24<br />
20<br />
16<br />
12<br />
8<br />
4<br />
0<br />
Appendix 6.6<br />
Sensitivity Analysis<br />
Effect <strong>of</strong> Variation <strong>of</strong> Investment cost by ±20%<br />
Variation <strong>of</strong> IRR at different <strong>in</strong>vestment cost (Scenario I)<br />
-20% 0% 20%<br />
% variation on <strong>in</strong>vestment cost (10000 birds)<br />
Variation <strong>of</strong> IRR at different <strong>in</strong>vestment cost (Scenario II)<br />
-20% 0% 20%<br />
% variation on <strong>in</strong>vestment cost (4000 birds)<br />
97<br />
E<br />
E+C<br />
E+F<br />
E+F+C<br />
E<br />
E+C<br />
E+F<br />
E+F+C
IRR (%)<br />
IRR (%)<br />
36<br />
32<br />
28<br />
24<br />
20<br />
16<br />
12<br />
8<br />
4<br />
0<br />
36<br />
32<br />
28<br />
24<br />
20<br />
16<br />
12<br />
8<br />
4<br />
0<br />
Variation <strong>of</strong> IRR at different <strong>in</strong>vestment cost (Scenario II)<br />
-20% 0% 20%<br />
% variation on <strong>in</strong>vestment cost (6000 birds)<br />
Variation <strong>of</strong> IRR at different <strong>in</strong>vestment cost (Scenario II)<br />
-20% 0% 20%<br />
% variation on <strong>in</strong>vestment cost (10000 birds)<br />
98<br />
E<br />
E+C<br />
E+F<br />
E+F+C<br />
E<br />
E+C<br />
E+F<br />
E+F+C
NPV (BDT)<br />
NPV (BDT)<br />
1200000<br />
1000000<br />
800000<br />
600000<br />
400000<br />
200000<br />
0<br />
-200000<br />
350000<br />
300000<br />
250000<br />
200000<br />
150000<br />
100000<br />
50000<br />
0<br />
-50000<br />
-100000<br />
Effect <strong>of</strong> Variation <strong>of</strong> Discount Rate<br />
Variation <strong>of</strong> NPV at different discount factor (Scenario II)<br />
8% 6% 4%<br />
Discount Factor (6000 Birds)<br />
Variation <strong>of</strong> NPV at different discount factor (Scenario II)<br />
8% 6% 4%<br />
Discount Factor (2000 Birds)<br />
99<br />
E<br />
E+C<br />
E+F<br />
E+F+C<br />
E<br />
E+C<br />
E+F<br />
E+F+C
DECLARATION<br />
I hereby certify that this thesis was <strong>in</strong>dependently written by me. No material was used other<br />
than that referred to. Sources directly quoted and ideas used, <strong>in</strong>clud<strong>in</strong>g figures, tables,<br />
sketches, draw<strong>in</strong>gs and photos, have been correctly denoted. Those not otherwise <strong>in</strong>dicated<br />
belong to the author.<br />
Place, date: Signature<br />
Sheikh Ashraf Uz Zaman, SESAM 2007, University <strong>of</strong> Flensburg 100