

Constraints to Increasing Agricultural Productivity in Nigeria: A Review
Constraints to Increasing Agricultural Productivity in Nigeria: A Review
Constraints to Increasing Agricultural Productivity in Nigeria: A Review

You also want an ePaper? Increase the reach of your titles
YUMPU automatically turns print PDFs into web optimized ePapers that Google loves.
names. In this study, farmers easily identified maize varieties as white local, yellow local, white<br />
open-poll<strong>in</strong>ated, yellow open-poll<strong>in</strong>ated, white hybrid, and yellow hybrid varieties, as opposed <strong>to</strong><br />
us<strong>in</strong>g such technical names as TZSR, TZBSR, and TZESR.<br />
In Borno state, a composite technology adoption study evaluated the impact of the T&V<br />
extension system. The composite adoption rates obta<strong>in</strong>ed were 78 percent (crop varieties), 75<br />
percent (fertilizer application rates), 59 percent (seed dress<strong>in</strong>g chemicals), and 59 percent<br />
(plant<strong>in</strong>g time/method).<br />
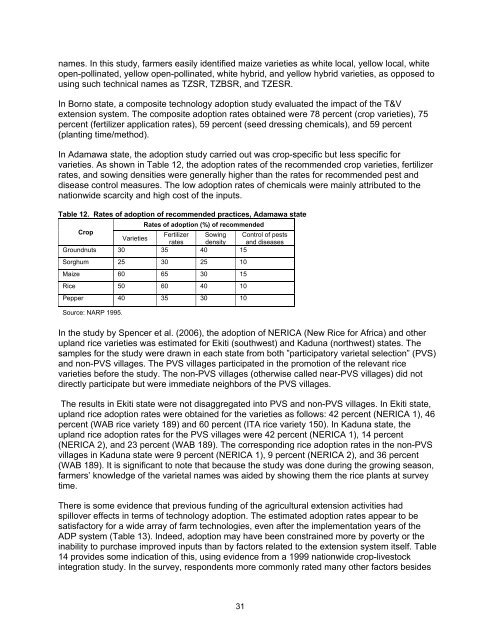
In Adamawa state, the adoption study carried out was crop-specific but less specific for<br />
varieties. As shown <strong>in</strong> Table 12, the adoption rates of the recommended crop varieties, fertilizer<br />
rates, and sow<strong>in</strong>g densities were generally higher than the rates for recommended pest and<br />
disease control measures. The low adoption rates of chemicals were ma<strong>in</strong>ly attributed <strong>to</strong> the<br />
nationwide scarcity and high cost of the <strong>in</strong>puts.<br />
Table 12. Rates of adoption of recommended practices, Adamawa state<br />
Rates of adoption (%) of recommended<br />
Crop<br />
Varieties<br />
Fertilizer<br />
rates<br />
Sow<strong>in</strong>g<br />
density<br />
Control of pests<br />
and diseases<br />
Groundnuts 30 35 40 15<br />
Sorghum 25 30 25 10<br />
Maize 60 65 30 15<br />
Rice 50 60 40 10<br />
Pepper 40 35 30 10<br />
Source: NARP 1995.<br />
In the study by Spencer et al. (2006), the adoption of NERICA (New Rice for Africa) and other<br />
upland rice varieties was estimated for Ekiti (southwest) and Kaduna (northwest) states. The<br />
samples for the study were drawn <strong>in</strong> each state from both ”participa<strong>to</strong>ry varietal selection” (PVS)<br />
and non-PVS villages. The PVS villages participated <strong>in</strong> the promotion of the relevant rice<br />
varieties before the study. The non-PVS villages (otherwise called near-PVS villages) did not<br />
directly participate but were immediate neighbors of the PVS villages.<br />
The results <strong>in</strong> Ekiti state were not disaggregated <strong>in</strong><strong>to</strong> PVS and non-PVS villages. In Ekiti state,<br />
upland rice adoption rates were obta<strong>in</strong>ed for the varieties as follows: 42 percent (NERICA 1), 46<br />
percent (WAB rice variety 189) and 60 percent (ITA rice variety 150). In Kaduna state, the<br />
upland rice adoption rates for the PVS villages were 42 percent (NERICA 1), 14 percent<br />
(NERICA 2), and 23 percent (WAB 189). The correspond<strong>in</strong>g rice adoption rates <strong>in</strong> the non-PVS<br />
villages <strong>in</strong> Kaduna state were 9 percent (NERICA 1), 9 percent (NERICA 2), and 36 percent<br />
(WAB 189). It is significant <strong>to</strong> note that because the study was done dur<strong>in</strong>g the grow<strong>in</strong>g season,<br />
farmers’ knowledge of the varietal names was aided by show<strong>in</strong>g them the rice plants at survey<br />
time.<br />
There is some evidence that previous fund<strong>in</strong>g of the agricultural extension activities had<br />
spillover effects <strong>in</strong> terms of technology adoption. The estimated adoption rates appear <strong>to</strong> be<br />
satisfac<strong>to</strong>ry for a wide array of farm technologies, even after the implementation years of the<br />
ADP system (Table 13). Indeed, adoption may have been constra<strong>in</strong>ed more by poverty or the<br />
<strong>in</strong>ability <strong>to</strong> purchase improved <strong>in</strong>puts than by fac<strong>to</strong>rs related <strong>to</strong> the extension system itself. Table<br />
14 provides some <strong>in</strong>dication of this, us<strong>in</strong>g evidence from a 1999 nationwide crop-lives<strong>to</strong>ck<br />
<strong>in</strong>tegration study. In the survey, respondents more commonly rated many other fac<strong>to</strong>rs besides<br />
31


