- Page 1 and 2:
© 2001 by CRC Press LLC DICTIONARY
- Page 3 and 4:
a Volume in the Comprehensive Dicti
- Page 5 and 6:
PREFACE This work is the result of
- Page 7 and 8:
Curtis Mobley Sequoia Scientific, I
- Page 9 and 10:
© 2001 by CRC Press LLC Editorial
- Page 11 and 12:
A-boundary A-boundary (or atlas bou
- Page 13 and 14:
accretion, Eddington presenceispart
- Page 15 and 16:
active front active front An active
- Page 17 and 18:
ADM mass is the extrinsic curvature
- Page 19 and 20:
afternoon cloud (Mars) are the syno
- Page 21 and 22:
albedo because the horizontal dimen
- Page 23 and 24:
Allan Hills meteorite Allan Hills m
- Page 25 and 26:
anabatic wind layers of the star, t
- Page 27 and 28:
anomalistic year anomalistic year S
- Page 29 and 30:
anticyclonic anticyclonic Any rotat
- Page 31 and 32:
archaeoastronomy A coronal arcade i
- Page 33 and 34:
ascending node of functions), f(−
- Page 35 and 36:
astronomical refraction such as mou
- Page 37 and 38:
atmosphere effect mass of the atmos
- Page 39 and 40:
aurora australis Earth’s magnetic
- Page 41 and 42:
axial dipole principle an order of
- Page 43 and 44:
Ballerina model tosphere through lu
- Page 45 and 46:
asalt In 1967 Sakharov identified t
- Page 47 and 48:
eam spread function erates auroral
- Page 49 and 50:
Beta Lyrae systems Beaufort Wind Sc
- Page 51 and 52:
Big Bang cosmology universe must ha
- Page 53 and 54:
inary star system time (see light-c
- Page 55 and 56:
lack hole black hole A region of sp
- Page 57 and 58:
BL Lacertae object shift z = 0.07,
- Page 59 and 60:
oson boson An elementary particle o
- Page 61 and 62:
Brazil current A generalization of
- Page 63 and 64:
Brunt frequency companions to somew
- Page 65 and 66:
utterfly diagram a very recent epoc
- Page 67 and 68:
Callisto ing probability is as high
- Page 69 and 70:
carbonaceous chondrite the object w
- Page 71 and 72:
Cartesian coordinates 5.4 5.2 5.0 4
- Page 73 and 74:
cataclysmic variable [binary models
- Page 75 and 76:
Celsius, Anders tions from the Eart
- Page 77 and 78:
Čerenkov radiation γ -rays in pur
- Page 79 and 80:
charge exchange an ordinary differe
- Page 81 and 82:
circulation density against polar a
- Page 83 and 84:
coastally trapped waves coastally t
- Page 85 and 86:
color excess color excess A measure
- Page 87 and 88:
comet, artificial in 2003, rendezvo
- Page 89 and 90:
computational relativity defined by
- Page 91 and 92:
conservation of angular momentum Bu
- Page 93 and 94:
continental plate types of continen
- Page 95 and 96:
conversion efficiency Temperature (
- Page 97 and 98:
core collapse the Earth has a core
- Page 99 and 100:
Coriolis Coriolis A term used to re
- Page 101 and 102:
coronal lines Except possibly for t
- Page 103 and 104:
cosmic microwave background, dipole
- Page 105 and 106:
cosmic nucleosynthesis temperature
- Page 107 and 108:
cosmochemistry of space surrounded
- Page 109 and 110:
cosmology does not apply at small (
- Page 111 and 112:
crater depth-diameter plots with a
- Page 113 and 114:
critical level they are recorded fr
- Page 115 and 116:
Curie (Ci) Curie (Ci) The special u
- Page 117 and 118:
curve of growth classical) field th
- Page 119 and 120:
cyclongenesis air masses along fron
- Page 121 and 122:
dark matter, cold study of clusters
- Page 123 and 124:
decibel universe and . indicates th
- Page 125 and 126:
de Hoffman-Teller frame de Hoffman-
- Page 127 and 128:
detritus detritus The particulate d
- Page 129 and 130:
differential heating/cooling differ
- Page 131 and 132:
diffusion creep wind speed. The ter
- Page 133 and 134:
dike results. Because the particle
- Page 135 and 136:
Dione at the new minima, so that th
- Page 137 and 138:
dispersion dispersion A phenomenon
- Page 139 and 140:
diurnal motion the non-periodic var
- Page 141 and 142:
Doppler broadening Doppler broadeni
- Page 143 and 144:
dragging phenomenon skin friction.
- Page 145 and 146:
ductile behavior variables of space
- Page 147 and 148:
dynamic recrystallization dynamic r
- Page 149 and 150:
earthquake intensity tude represent
- Page 151 and 152:
echelle spectrograph a central mass
- Page 153 and 154:
effective pressure independent theo
- Page 155 and 156:
Einstein Universe where Rab is the
- Page 157 and 158:
Electra Electra Magnitude 3.8 type
- Page 159 and 160:
elevation particles have been inter
- Page 161 and 162:
emissivity cence of aromatic hydroc
- Page 163 and 164:
energy particles are accelerated at
- Page 165 and 166:
environmental lapse rate environmen
- Page 167 and 168:
equatorial bulge tor being driven u
- Page 169 and 170:
equilibrium vapor pressure equilibr
- Page 171 and 172:
Eulerian Represents Newton’s 2nd
- Page 173 and 174:
exact solution The path of a star i
- Page 175 and 176:
extreme ultraviolet (EUV) extreme u
- Page 177 and 178:
fall speed (velocity) can be lofted
- Page 179 and 180:
F corona F corona The Fraunhofer, o
- Page 181 and 182:
figure of the Earth See cosmic topo
- Page 183 and 184:
first-order wave theory the fields
- Page 185 and 186:
flat universe flat universe A model
- Page 187 and 188:
focal mechanisms rays arriving para
- Page 189 and 190:
force balance force balance A term
- Page 191 and 192:
Fraunhofer lines where M is the mas
- Page 193 and 194:
friction velocity friction velocity
- Page 195 and 196:
F star where E and B are the electr
- Page 197 and 198:
G gabbro A coarse-grained igneous r
- Page 199 and 200:
Galilei (1564-1642). See Galilean t
- Page 201 and 202:
not become optically thin until muc
- Page 203 and 204:
gas. It is either a constant volume
- Page 205 and 206:
equator. While geodetic latitude is
- Page 207 and 208: the Earth. These interactions can g
- Page 209 and 210: that extend from the sun to Earth a
- Page 211 and 212: Pleistocene, about 2 million years
- Page 213 and 214: the difference between the number o
- Page 215 and 216: temperature is ∼ 10 K everything
- Page 217 and 218: of Einstein’s general relativity
- Page 219 and 220: picture in the weak-field limit in
- Page 221 and 222: Time (UT1) on January 1, 1972. In t
- Page 223 and 224: tra would show a dip at frequencies
- Page 225 and 226: Hα condensation Hα condensation T
- Page 227 and 228: harmonic model harmonic model The r
- Page 229 and 230: Helios mission mination shock, and
- Page 231 and 232: helium burning strated to be 4 He.
- Page 233 and 234: HI region sure and temperature char
- Page 235 and 236: horse latitudes from the loci of th
- Page 237 and 238: Hubble radius Press 1982; Mon. Not.
- Page 239 and 240: hydraulic-fracturing method hydraul
- Page 241 and 242: hydromagnetic wave netized cosmic p
- Page 243 and 244: hysteresis (θ), tension head (ψ),
- Page 245 and 246: igneous rocks rocks are classified
- Page 247 and 248: inclination inclination In geophysi
- Page 249 and 250: inferior conjunction the figure) in
- Page 251 and 252: initial condition time. Different r
- Page 253 and 254: interconnection field interconnecti
- Page 255 and 256: interplanetary dust particles (IDPs
- Page 257: intertropical convergence zone (ITC
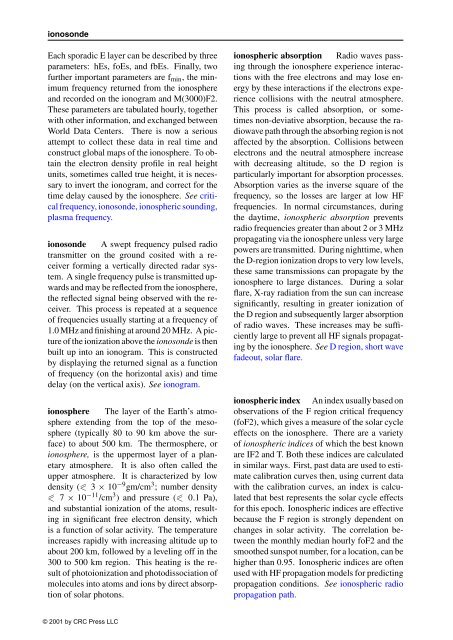
- Page 261 and 262: ionospheric regions subsequently re
- Page 263 and 264: iron Kα line iron Kα line A spect
- Page 265 and 266: isotope delta value (δ) element is
- Page 267 and 268: Jerlov water type one because of gr
- Page 269 and 270: Julian year Gregorian Date (midnigh
- Page 271 and 272: K Kaiser-Stebbins effect (1984) Ani
- Page 273 and 274: ing the gravitational field outside
- Page 275 and 276: observed. However, these correction
- Page 277 and 278: L lagoon A shallow, sheltered bay t
- Page 279 and 280: Langacker-Pi mechanism In cosmology
- Page 281 and 282: the last scattering surface. See qu
- Page 283 and 284: Law-of-the-Wall Scaling Relations L
- Page 285 and 286: light bridge Observed in white ligh
- Page 287 and 288: linear wave theory Also referred to
- Page 289 and 290: and downcoast areas. Sediment is tr
- Page 291 and 292: longshore sediment transport Transp
- Page 293 and 294: deforming forces. If a potential Vn
- Page 295 and 296: defined at moderate (3 Å) resoluti
- Page 297 and 298: Prospector then dropped to an altit
- Page 299 and 300: M M51 Object 51 in the Messier list
- Page 301 and 302: or more km where the magma resides
- Page 303 and 304: oring magnetic field lines to repul
- Page 305 and 306: field, the force due to the magneti
- Page 307 and 308: mencement (SC) in the geomagnetic f
- Page 309 and 310:
and the constant κ is equal to 1 m
- Page 311 and 312:
California, Berkeley Space Sciences
- Page 313 and 314:
For instance, in a model higher der
- Page 315 and 316:
interval, divided by that interval:
- Page 317 and 318:
median diameter, median grain size
- Page 319 and 320:
helium (for which the early tracers
- Page 321 and 322:
or in components, gαβ;γ = 0 , wh
- Page 323 and 324:
length range, normally associated w
- Page 325 and 326:
mirage Appearance of the image of s
- Page 327 and 328:
perature characteristics are found
- Page 329 and 330:
stratification are slight and turbu
- Page 331 and 332:
ock debris carried on or within a g
- Page 333 and 334:
N Nabarro-Herring creep When materi
- Page 335 and 336:
Nasmyth spectrum F(k/k η) 10 6 10
- Page 337 and 338:
esponding chromospheric network def
- Page 339 and 340:
(NASA) initiative to test and prove
- Page 341 and 342:
node A point of zero displacement.
- Page 343 and 344:
modes. Normal modes are excited by
- Page 345 and 346:
special relativity, such a vector h
- Page 347 and 348:
oblique-slip fault low elevation an
- Page 349 and 350:
One-form, 1-form attached to the fl
- Page 351 and 352:
orbital elements higher than the OW
- Page 353 and 354:
OVV quasar OVV quasar Optically vio
- Page 355 and 356:
P packageeffect Inoceanographyandot
- Page 357 and 358:
would exert alone, i.e., if all the
- Page 359 and 360:
the psychrometric constant, KE is a
- Page 361 and 362:
period The amount of time for some
- Page 363 and 364:
the object to be viewed, as with th
- Page 365 and 366:
pheophytin A phytoplankton pigment
- Page 367 and 368:
The Planck length is the approximat
- Page 369 and 370:
these faint, fuzzy objects. At firs
- Page 371 and 372:
types across (now separated) contin
- Page 373 and 374:
plus the arc stretching across it
- Page 375 and 376:
displacement of air and water masse
- Page 377 and 378:
and fluid flow obeys Darcy’s law.
- Page 379 and 380:
eter) andζ is the vertical compone
- Page 381 and 382:
precipitation Any form of liquid or
- Page 383 and 384:
albedo of 0.064, and orbits Neptune
- Page 385 and 386:
Q Q “Quality”; a measure of att
- Page 387 and 388:
static equilibrium, air parcels hav
- Page 389 and 390:
R R 136 See 30 Doradus. Raadu-Kuper
- Page 391 and 392:
tive element is called the parent e
- Page 393 and 394:
Recently radon buildup in buildings
- Page 395 and 396:
where r is the distance from the ce
- Page 397 and 398:
General vectors can be written as a
- Page 399 and 400:
state of saturation, i.e., the rati
- Page 401 and 402:
plasma, for a wave of angular frequ
- Page 403 and 404:
γmnp, this equation is definitiona
- Page 405 and 406:
the position of the turning point,
- Page 407 and 408:
to (1), the ratio of accelerations
- Page 409 and 410:
evolved, the more massive component
- Page 411 and 412:
saturation Satellite ephemeris, r A
- Page 413 and 414:
scattering albedo perpendicular sho
- Page 415 and 416:
seafloor spreading curs at a rate o
- Page 417 and 418:
sedimentary sedimentary Referring t
- Page 419 and 420:
seismometer the body’s interior c
- Page 421 and 422:
sferic galactic nuclei, distinct fr
- Page 423 and 424:
shock spike The shock speed then ca
- Page 425 and 426:
silicon burning spacetime describes
- Page 427 and 428:
sky sky The apparent dome over the
- Page 429 and 430:
Snell’s law gases differ from tho
- Page 431 and 432:
solar eclipse solar eclipse The blo
- Page 433 and 434:
solar P-angle tors Mikheyev, Smirno
- Page 435 and 436:
solar year mic rays into the outer
- Page 437 and 438:
space-like infinity space-like infi
- Page 439 and 440:
specific storage (Ss) volume, e.g.,
- Page 441 and 442:
spectroradiometer diation and limit
- Page 443 and 444:
spiral galaxy more evolved stars. (
- Page 445 and 446:
spring tion and produces fluctuatio
- Page 447 and 448:
stable equilibrium stable equilibri
- Page 449 and 450:
star spots observable Stark effect,
- Page 451 and 452:
stiff fluid stiff fluid A fluid in
- Page 453 and 454:
strain Plateau and the Rockies, and
- Page 455 and 456:
St. Venant Equations St. Venant Equ
- Page 457 and 458:
sudden stratospheric warming the io
- Page 459 and 460:
super cloud cluster called supercel
- Page 461 and 462:
supernovae, 1991bg pergiant stars.
- Page 463 and 464:
supernovae, fallback In practice, t
- Page 465 and 466:
supernovae, Type Ib/Ic in the peak
- Page 467 and 468:
supersonic Typical supernovae light
- Page 469 and 470:
symmetry posite walls of the cube,
- Page 471 and 472:
T tachyon A hypothetical subatomic
- Page 473 and 474:
Tethys system. Calypso orbits at th
- Page 475 and 476:
TT+LG·(JD−2443144.5)·86400 sec,
- Page 477 and 478:
thermal conductivity The property o
- Page 479 and 480:
turbulence is not two-dimensional,
- Page 481 and 482:
tidal period The time between two p
- Page 483 and 484:
a precession of 2.0 ◦ yr −1 , a
- Page 485 and 486:
ular to the direction of the force.
- Page 487 and 488:
to the atmosphere, via absorption o
- Page 489 and 490:
orbit around the sun, are stable po
- Page 491 and 492:
correlated to the number of old dis
- Page 493 and 494:
only the fastest (speeds exceeding
- Page 495 and 496:
unified soil classification schemes
- Page 497 and 498:
V V471 Tauri stars Binary systems i
- Page 499 and 500:
variable star A star that changes i
- Page 501 and 502:
A drop with increasing distance, as
- Page 503 and 504:
in declination. Virgo (Latin for vi
- Page 505 and 506:
Located near Socorro, NM at 34 ◦
- Page 507 and 508:
volume scattering function (VSF) Th
- Page 509 and 510:
wash load the magnetopause are disp
- Page 511 and 512:
Weber- Davis Model physical instabi
- Page 513 and 514:
Wheeler- DeWitt equation The Weyl t
- Page 515 and 516:
Wien distribution law Wien distribu
- Page 517 and 518:
winter anomaly Scale Wind Condition
- Page 519 and 520:
X xenoliths Rocks carried to the su
- Page 521 and 522:
Y yardangs Streamlined elongated hi
- Page 523 and 524:
Z Zeeman effect The splitting of sp


