Annual Report and Accounts 2009 - BG Group
Annual Report and Accounts 2009 - BG Group
Annual Report and Accounts 2009 - BG Group

Create successful ePaper yourself
Turn your PDF publications into a flip-book with our unique Google optimized e-Paper software.
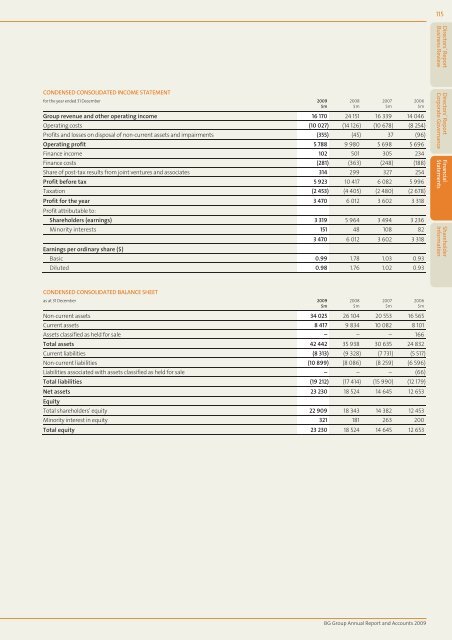
CONDENSED CONSOLIDATED INCOME STATEMENT<br />
for the year ended 31 December <strong>2009</strong><br />
$m<br />
<strong>Group</strong> revenue <strong>and</strong> other operating income 16 170 24 151 16 339 14 046<br />
Operating costs (10 027) (14 126) (10 678) (8 254)<br />
Profits <strong>and</strong> losses on disposal of non-current assets <strong>and</strong> impairments (355) (45) 37 (96)<br />
Operating profit 5 788 9 980 5 698 5 696<br />
Finance income 102 501 305 234<br />
Finance costs (281) (363) (248) (188)<br />
Share of post-tax results from joint ventures <strong>and</strong> associates 314 299 327 254<br />
Profit before tax 5 923 10 417 6 082 5 996<br />
Taxation (2 453) (4 405) (2 480) (2 678)<br />
Profit for the year 3 470 6 012 3 602 3 318<br />
Profit attributable to:<br />
Shareholders (earnings) 3 319 5 964 3 494 3 236<br />
Minority interests 151 48 108 82<br />
Earnings per ordinary share ($)<br />
2008<br />
$m<br />
2007<br />
$m<br />
2006<br />
$m<br />
3 470 6 012 3 602 3 318<br />
Basic 0.99 1.78 1.03 0.93<br />
Diluted 0.98 1.76 1.02 0.93<br />
CONDENSED CONSOLIDATED BALANCE SHEET<br />
as at 31 December <strong>2009</strong><br />
2008<br />
2007<br />
2006<br />
$m<br />
$m<br />
$m<br />
$m<br />
Non-current assets 34 025 26 104 20 553 16 565<br />
Current assets 8 417 9 834 10 082 8 101<br />
Assets classified as held for sale – – – 166<br />
Total assets 42 442 35 938 30 635 24 832<br />
Current liabilities (8 313) (9 328) (7 731) (5 517)<br />
Non-current liabilities (10 899) (8 086) (8 259) (6 596)<br />
Liabilities associated with assets classified as held for sale – – – (66)<br />
Total liabilities (19 212) (17 414) (15 990) (12 179)<br />
Net assets<br />
Equity<br />
23 230 18 524 14 645 12 653<br />
Total shareholders’ equity 22 909 18 343 14 382 12 453<br />
Minority interest in equity 321 181 263 200<br />
Total equity 23 230 18 524 14 645 12 653<br />
<strong>BG</strong> <strong>Group</strong> <strong>Annual</strong> <strong>Report</strong> <strong>and</strong> <strong>Accounts</strong> <strong>2009</strong><br />
115<br />
Directors’ <strong>Report</strong><br />
Business Review<br />
Directors’ <strong>Report</strong><br />
Corporate Governance<br />
Financial<br />
Statements<br />
Shareholder<br />
Information