Annual Report and Accounts 2009 - BG Group
Annual Report and Accounts 2009 - BG Group
Annual Report and Accounts 2009 - BG Group

Create successful ePaper yourself
Turn your PDF publications into a flip-book with our unique Google optimized e-Paper software.
78<br />
Financial Statements<br />
Notes to the accounts continued<br />
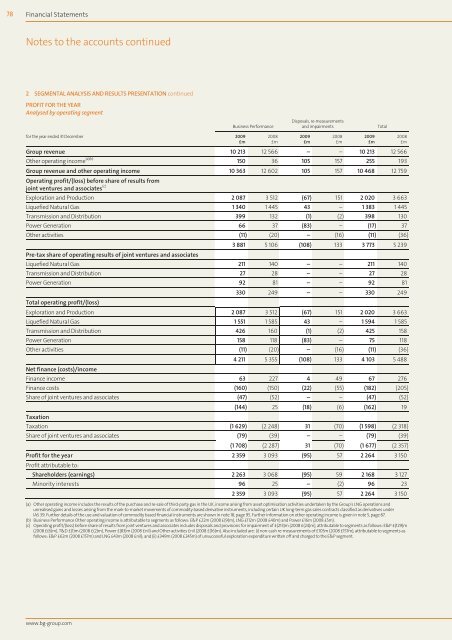
2 SEGMENTAL ANALYSIS AND RESULTS PRESENTATION continued<br />
PROFIT FOR THE YEAR<br />
Analysed by operating segment<br />
for the year ended 31 December <strong>2009</strong><br />
£m<br />
www.bg-group.com<br />
Business Performance<br />
2008<br />
£m<br />
Disposals, re-measurements<br />
<strong>and</strong> impairments Total<br />
<strong>Group</strong> revenue 10 213 12 566 – – 10 213 12 566<br />
Other operating income (a)(b) 150 36 105 157 255 193<br />
<strong>Group</strong> revenue <strong>and</strong> other operating income<br />
Operating profit/(loss) before share of results from<br />
joint ventures <strong>and</strong> associates<br />
10 363 12 602 105 157 10 468 12 759<br />
(c)<br />
Exploration <strong>and</strong> Production 2 087 3 512 (67) 151 2 020 3 663<br />
Liquefied Natural Gas 1 340 1 445 43 – 1 383 1 445<br />
Transmission <strong>and</strong> Distribution 399 132 (1) (2) 398 130<br />
Power Generation 66 37 (83) – (17) 37<br />
Other activities (11) (20) – (16) (11) (36)<br />
Pre-tax share of operating results of joint ventures <strong>and</strong> associates<br />
3 881 5 106 (108) 133 3 773 5 239<br />
Liquefied Natural Gas 211 140 – – 211 140<br />
Transmission <strong>and</strong> Distribution 27 28 – – 27 28<br />
Power Generation 92 81 – – 92 81<br />
Total operating profit/(loss)<br />
330 249 – – 330 249<br />
Exploration <strong>and</strong> Production 2 087 3 512 (67) 151 2 020 3 663<br />
Liquefied Natural Gas 1 551 1 585 43 – 1 594 1 585<br />
Transmission <strong>and</strong> Distribution 426 160 (1) (2) 425 158<br />
Power Generation 158 118 (83) – 75 118<br />
Other activities (11) (20) – (16) (11) (36)<br />
Net finance (costs)/income<br />
4 211 5 355 (108) 133 4 103 5 488<br />
Finance income 63 227 4 49 67 276<br />
Finance costs (160) (150) (22) (55) (182) (205)<br />
Share of joint ventures <strong>and</strong> associates (47) (52) – – (47) (52)<br />
Taxation<br />
(144) 25 (18) (6) (162) 19<br />
Taxation (1 629) (2 248) 31 (70) (1 598) (2 318)<br />
Share of joint ventures <strong>and</strong> associates (79) (39) – – (79) (39)<br />
(1 708) (2 287) 31 (70) (1 677) (2 357)<br />
Profit for the year<br />
Profit attributable to:<br />
2 359 3 093 (95) 57 2 264 3 150<br />
Shareholders (earnings) 2 263 3 068 (95) 59 2 168 3 127<br />
Minority interests 96 25 – (2) 96 23<br />
2 359 3 093 (95) 57 2 264 3 150<br />
(a) Other operating income includes the results of the purchase <strong>and</strong> re-sale of third-party gas in the UK, income arising from asset optimisation activities undertaken by the <strong>Group</strong>’s LNG operations <strong>and</strong><br />
unrealised gains <strong>and</strong> losses arising from the mark-to-market movements of commodity based derivative instruments, including certain UK long-term gas sales contracts classified as derivatives under<br />
IAS 39. Further details of the use <strong>and</strong> valuation of commodity based financial instruments are shown in note 18, page 95. Further information on other operating income is given in note 5, page 87.<br />
(b) Business Performance Other operating income is attributable to segments as follows: E&P £22m (2008 £(9)m), LNG £112m (2008 £40m) <strong>and</strong> Power £16m (2008 £5m).<br />
(c) Operating profit/(loss) before share of results from joint ventures <strong>and</strong> associates includes disposals <strong>and</strong> provisions for impairment of £(213)m (2008 £(24)m), attributable to segments as follows: E&P £(129)m<br />
(2008 £(6)m), T&D £(1)m (2008 £(2)m), Power £(83)m (2008 £nil) <strong>and</strong> Other activities £nil (2008 £(16)m). Also included are: (i) non-cash re-measurements of £105m (2008 £157m), attributable to segments as<br />
follows: E&P £62m (2008 £157m) <strong>and</strong> LNG £43m (2008 £nil); <strong>and</strong> (ii) £349m (2008 £245m) of unsuccessful exploration expenditure written off <strong>and</strong> charged to the E&P segment.<br />
<strong>2009</strong><br />
£m<br />
2008<br />
£m<br />
<strong>2009</strong><br />
£m<br />
2008<br />
£m