Annual Report and Accounts 2009 - BG Group
Annual Report and Accounts 2009 - BG Group
Annual Report and Accounts 2009 - BG Group

You also want an ePaper? Increase the reach of your titles
YUMPU automatically turns print PDFs into web optimized ePapers that Google loves.
126<br />
Financial Statements<br />
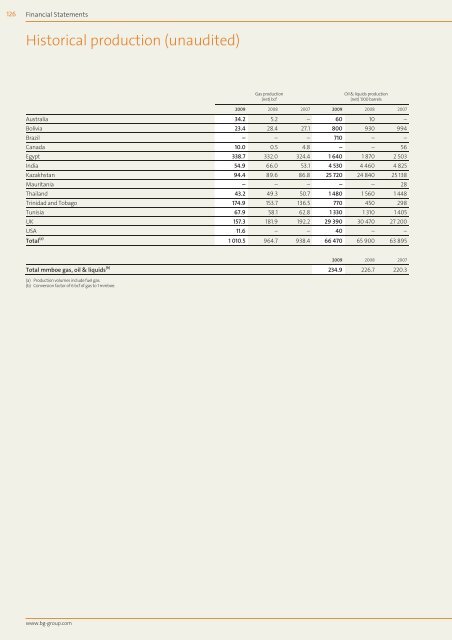
Historical production (unaudited)<br />
www.bg-group.com<br />
Gas production<br />
(net) bcf<br />
Oil & liquids production<br />
(net) ’000 barrels<br />
<strong>2009</strong> 2008 2007 <strong>2009</strong> 2008 2007<br />
Australia 34.2 5.2 – 60 10 –<br />
Bolivia 23.4 28.4 27.1 800 930 994<br />
Brazil – – – 710 – –<br />
Canada 10.0 0.5 4.8 – – 56<br />
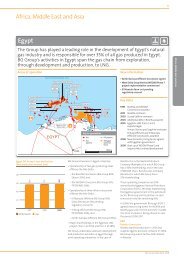
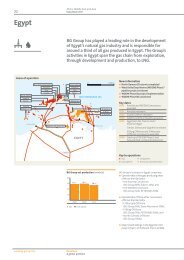
Egypt 338.7 332.0 324.4 1 640 1 870 2 503<br />
India 54.9 66.0 53.1 4 530 4 460 4 825<br />
Kazakhstan 94.4 89.6 86.8 25 720 24 840 25 138<br />
Mauritania – – – – – 28<br />
Thail<strong>and</strong> 43.2 49.3 50.7 1 480 1 560 1 448<br />
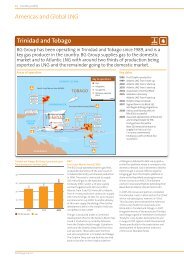
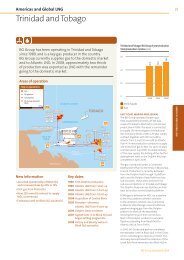
Trinidad <strong>and</strong> Tobago 174.9 153.7 136.5 770 450 298<br />
Tunisia 67.9 58.1 62.8 1 330 1 310 1 405<br />
UK 157.3 181.9 192.2 29 390 30 470 27 200<br />
USA 11.6 – – 40 – –<br />
Total (a) 1 010.5 964.7 938.4 66 470 65 900 63 895<br />
<strong>2009</strong> 2008 2007<br />
Total mmboe gas, oil & liquids (b) 234.9 226.7 220.3<br />
(a) Production volumes include fuel gas.<br />
(b) Conversion factor of 6 bcf of gas to 1 mmboe.