Annual Report and Accounts 2009 - BG Group
Annual Report and Accounts 2009 - BG Group
Annual Report and Accounts 2009 - BG Group

You also want an ePaper? Increase the reach of your titles
YUMPU automatically turns print PDFs into web optimized ePapers that Google loves.
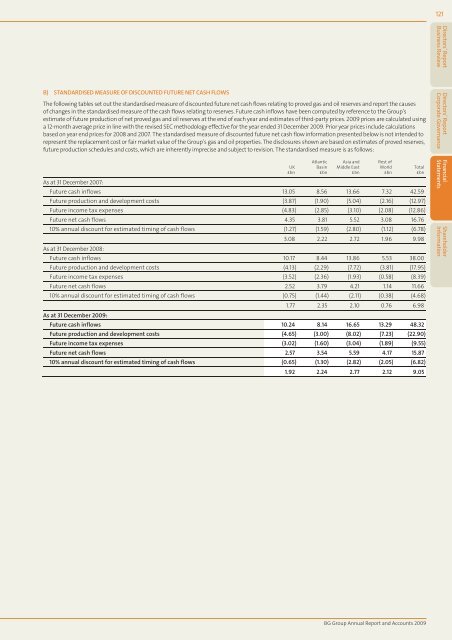
B) STANDARDISED MEASURE OF DISCOUNTED FUTURE NET CASH FLOWS<br />
The following tables set out the st<strong>and</strong>ardised measure of discounted future net cash flows relating to proved gas <strong>and</strong> oil reserves <strong>and</strong> report the causes<br />
of changes in the st<strong>and</strong>ardised measure of the cash flows relating to reserves. Future cash inflows have been computed by reference to the <strong>Group</strong>’s<br />
estimate of future production of net proved gas <strong>and</strong> oil reserves at the end of each year <strong>and</strong> estimates of third-party prices. <strong>2009</strong> prices are calculated using<br />
a 12-month average price in line with the revised SEC methodology effective for the year ended 31 December <strong>2009</strong>. Prior year prices include calculations<br />
based on year end prices for 2008 <strong>and</strong> 2007. The st<strong>and</strong>ardised measure of discounted future net cash flow information presented below is not intended to<br />
represent the replacement cost or fair market value of the <strong>Group</strong>’s gas <strong>and</strong> oil properties. The disclosures shown are based on estimates of proved reserves,<br />
future production schedules <strong>and</strong> costs, which are inherently imprecise <strong>and</strong> subject to revision. The st<strong>and</strong>ardised measure is as follows:<br />
UK<br />
£bn<br />
Atlantic<br />
Basin<br />
£bn<br />
Asia <strong>and</strong><br />
Middle East<br />
£bn<br />
As at 31 December 2007:<br />
Future cash inflows 13.05 8.56 13.66 7.32 42.59<br />
Future production <strong>and</strong> development costs (3.87) (1.90) (5.04) (2.16) (12.97)<br />
Future income tax expenses (4.83) (2.85) (3.10) (2.08) (12.86)<br />
Future net cash flows 4.35 3.81 5.52 3.08 16.76<br />
10% annual discount for estimated timing of cash flows (1.27) (1.59) (2.80) (1.12) (6.78)<br />
As at 31 December 2008:<br />
3.08 2.22 2.72 1.96 9.98<br />
Future cash inflows 10.17 8.44 13.86 5.53 38.00<br />
Future production <strong>and</strong> development costs (4.13) (2.29) (7.72) (3.81) (17.95)<br />
Future income tax expenses (3.52) (2.36) (1.93) (0.58) (8.39)<br />
Future net cash flows 2.52 3.79 4.21 1.14 11.66<br />
10% annual discount for estimated timing of cash flows (0.75) (1.44) (2.11) (0.38) (4.68)<br />
As at 31 December <strong>2009</strong>:<br />
1.77 2.35 2.10 0.76 6.98<br />
Future cash inflows 10.24 8.14 16.65 13.29 48.32<br />
Future production <strong>and</strong> development costs (4.65) (3.00) (8.02) (7.23) (22.90)<br />
Future income tax expenses (3.02) (1.60) (3.04) (1.89) (9.55)<br />
Future net cash flows 2.57 3.54 5.59 4.17 15.87<br />
10% annual discount for estimated timing of cash flows (0.65) (1.30) (2.82) (2.05) (6.82)<br />
1.92 2.24 2.77 2.12 9.05<br />
Rest of<br />
World<br />
£bn<br />
Total<br />
£bn<br />
<strong>BG</strong> <strong>Group</strong> <strong>Annual</strong> <strong>Report</strong> <strong>and</strong> <strong>Accounts</strong> <strong>2009</strong><br />
121<br />
Directors’ <strong>Report</strong><br />
Business Review<br />
Directors’ <strong>Report</strong><br />
Corporate Governance<br />
Financial<br />
Statements<br />
Shareholder<br />
Information