Annual Report and Accounts 2009 - BG Group
Annual Report and Accounts 2009 - BG Group
Annual Report and Accounts 2009 - BG Group

Create successful ePaper yourself
Turn your PDF publications into a flip-book with our unique Google optimized e-Paper software.
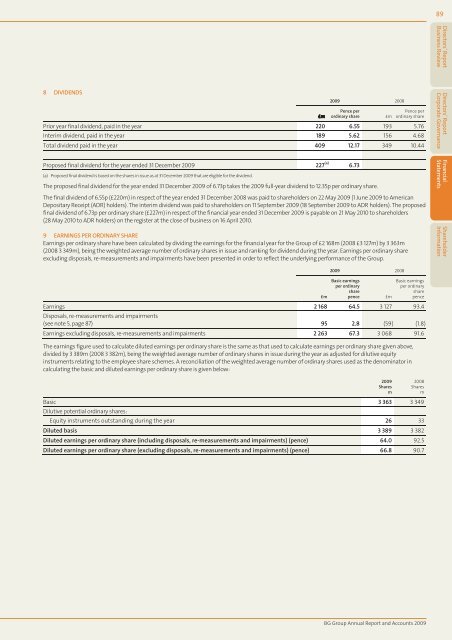
8 DIVIDENDS<br />
£m<br />
<strong>2009</strong> 2008<br />
Pence per<br />
ordinary share £m<br />
Pence per<br />
ordinary share<br />
Prior year final dividend, paid in the year 220 6.55 193 5.76<br />
Interim dividend, paid in the year 189 5.62 156 4.68<br />
Total dividend paid in the year 409 12.17 349 10.44<br />
Proposed final dividend for the year ended 31 December <strong>2009</strong> 227 (a) 6.73<br />
(a) Proposed final dividend is based on the shares in issue as at 31 December <strong>2009</strong> that are eligible for the dividend.<br />
The proposed final dividend for the year ended 31 December <strong>2009</strong> of 6.73p takes the <strong>2009</strong> full-year dividend to 12.35p per ordinary share.<br />
The final dividend of 6.55p (£220m) in respect of the year ended 31 December 2008 was paid to shareholders on 22 May <strong>2009</strong> (1 June <strong>2009</strong> to American<br />
Depositary Receipt (ADR) holders). The interim dividend was paid to shareholders on 11 September <strong>2009</strong> (18 September <strong>2009</strong> to ADR holders). The proposed<br />
final dividend of 6.73p per ordinary share (£227m) in respect of the financial year ended 31 December <strong>2009</strong> is payable on 21 May 2010 to shareholders<br />
(28 May 2010 to ADR holders) on the register at the close of business on 16 April 2010.<br />
9 EARNINGS PER ORDINARY SHARE<br />
Earnings per ordinary share have been calculated by dividing the earnings for the financial year for the <strong>Group</strong> of £2 168m (2008 £3 127m) by 3 363m<br />
(2008 3 349m), being the weighted average number of ordinary shares in issue <strong>and</strong> ranking for dividend during the year. Earnings per ordinary share<br />
excluding disposals, re-measurements <strong>and</strong> impairments have been presented in order to reflect the underlying performance of the <strong>Group</strong>.<br />
<strong>2009</strong> 2008<br />
Basic earnings<br />
Basic earnings<br />
per ordinary<br />
per ordinary<br />
share<br />
share<br />
£m<br />
pence £m<br />
pence<br />
Earnings<br />
Disposals, re-measurements <strong>and</strong> impairments<br />
2 168 64.5 3 127 93.4<br />
(see note 5, page 87) 95 2.8 (59) (1.8)<br />
Earnings excluding disposals, re-measurements <strong>and</strong> impairments 2 263 67.3 3 068 91.6<br />
The earnings figure used to calculate diluted earnings per ordinary share is the same as that used to calculate earnings per ordinary share given above,<br />
divided by 3 389m (2008 3 382m), being the weighted average number of ordinary shares in issue during the year as adjusted for dilutive equity<br />
instruments relating to the employee share schemes. A reconciliation of the weighted average number of ordinary shares used as the denominator in<br />
calculating the basic <strong>and</strong> diluted earnings per ordinary share is given below:<br />
Basic<br />
Dilutive potential ordinary shares:<br />
3 363 3 349<br />
Equity instruments outst<strong>and</strong>ing during the year 26 33<br />
Diluted basis 3 389 3 382<br />
Diluted earnings per ordinary share (including disposals, re-measurements <strong>and</strong> impairments) (pence) 64.0 92.5<br />
Diluted earnings per ordinary share (excluding disposals, re-measurements <strong>and</strong> impairments) (pence) 66.8 90.7<br />
<strong>2009</strong><br />
Shares<br />
m<br />
2008<br />
Shares<br />
m<br />
<strong>BG</strong> <strong>Group</strong> <strong>Annual</strong> <strong>Report</strong> <strong>and</strong> <strong>Accounts</strong> <strong>2009</strong><br />
89<br />
Directors’ <strong>Report</strong><br />
Business Review<br />
Directors’ <strong>Report</strong><br />
Corporate Governance<br />
Financial<br />
Statements<br />
Shareholder<br />
Information