Peak Oil Task Force Report - City of Bloomington - State of Indiana
Peak Oil Task Force Report - City of Bloomington - State of Indiana
Peak Oil Task Force Report - City of Bloomington - State of Indiana

You also want an ePaper? Increase the reach of your titles
YUMPU automatically turns print PDFs into web optimized ePapers that Google loves.
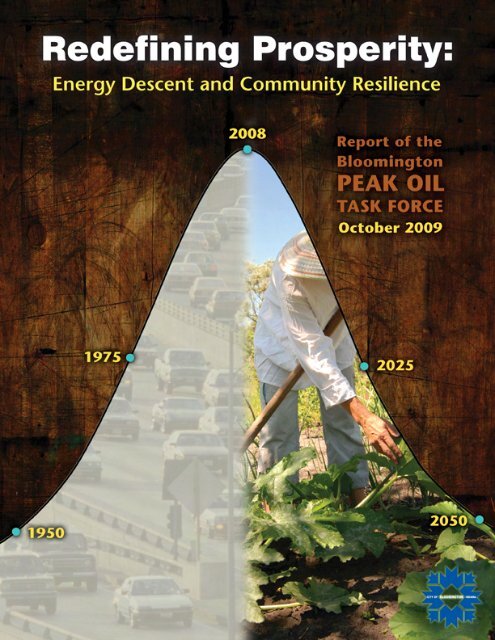
Redefining Prosperity:<br />
Energy Descent and Community Resilience<br />
<strong>Report</strong> <strong>of</strong> the <strong>Bloomington</strong> <strong>Peak</strong> <strong>Oil</strong> <strong>Task</strong> <strong>Force</strong><br />
Prepared By:<br />
The <strong>Bloomington</strong> <strong>Peak</strong> <strong>Oil</strong> <strong>Task</strong> <strong>Force</strong><br />
Dave Rollo (Chair)<br />
Peter Bane<br />
Gary Charbonneau<br />
Clay Fuqua<br />
Christine Glaser<br />
Stephanie Kimball<br />
Jim Silberstein<br />
Gregory Travis<br />
Staff<br />
Stacy Jane Rhoads<br />
October 2009<br />
http://bloomington.in.gov/peakoil<br />
Cover Design: Merridee LaMantia<br />
mlan@kiva.net
oil is everywhere<br />
ro<strong>of</strong>ing paper ● heart valves ● asphalt ● crayons ● parachutes<br />
telephones ● dishwashing liquid ● transparent tape ● antiseptics<br />
purses ● deodorant ● panty hose ● air conditioners ● shower<br />
curtains ● shoes ● volleyballs ● electrician's tape ● floor wax<br />
lipstick ● synthetic clothing ● coal extraction and processing<br />
bubble gum ● running shoes ● car bodies ● tires ● house paint<br />
hair dryers ● pens ● ammonia ● eyeglasses ● contacts ● insect<br />
repellent ● fertilizers ● hair coloring ●movie film ● ice chests<br />
loudspeakers ● basketballs ● footballs, ● combs/brushes<br />
linoleum ● fishing rods ● rubber boots ● water pipes ● motorcycle<br />
helmets ● fishing lures ● petroleum jelly ● lip balm<br />
antihistamines ● golf balls ● dice ● insulation ● trash bags<br />
rubber cement ● cold cream ● umbrellas ● inks <strong>of</strong> all types ● paint<br />
brushes ● hearing aids ● compact discs ● mops ● bandages<br />
artificial turf ● cameras ● glue ● shoe polish ● caulking ● tape<br />
recorders ● stereos ● plywood ● adhesives ● toilet seats ● car<br />
batteries ● candles ● refrigerator seals ● carpet ● cortisone<br />
vaporizers ● solvents ● nail polish ● denture adhesives ● balloons<br />
boats ● dresses ● non-cotton shirts ● perfumes ● toothpaste<br />
plastic forks ● hair curlers ● plastic cups ● electric blankets ● oil<br />
filters ● floor wax ● Ping-Pong paddles ● bras ● water skis<br />
upholstery ● chewing gum ● thermos bottles ● plastic chairs<br />
plastic wrap ● rubber bands ● computers ● gasoline ● diesel fuel<br />
kerosene heating oil ● motor oil ● jet fuel ● marine diesel and<br />
butane.*<br />
* Over 500,000 products use oil or oil by-products as an ingredient in their production. Source: Gary L.<br />
Stringer, Northeast Louisiana University
This report is dedicated to Colin J. Campbell, whose research and lectures on the<br />
coming world oil peak inspired many <strong>of</strong> us to begin transition planning.
CONTENTS<br />
PREFACE ............................................................................................................................................. i<br />
ACKNOWLEDGEMENTS.................................................................................................................ii<br />
EXECUTIVE SUMMARY.................................................................................................................iii<br />
INTRODUCTION ..............................................................................................................................1<br />
AN EXAMINATION OF COMMUNITY SYSTEMS<br />
THE ECONOMIC CONTEXT .......................................................................................................18<br />
MUNICIPAL SERVICES ................................................................................................................37<br />
WATER..................................................................................................................................40<br />
WASTE ..................................................................................................................................52<br />
POLICE, FIRE & OTHER EMERGENCY SERVICES ...............................................64<br />
FLEET & STREET..............................................................................................................72<br />
BUILDINGS ..........................................................................................................................83<br />
REVENUE .............................................................................................................................85<br />
THE BUILT ENVIRONMENT.....................................................................................................87<br />
LAND USE ............................................................................................................................88<br />
TRANSPORTATION ...................................................................................................... 112<br />
HOUSING........................................................................................................................... 153<br />
SUSTENANCE................................................................................................................................ 172<br />
FOOD .................................................................................................................................. 173<br />
WATER .............................................................................................................................. 199<br />
WASTE ............................................................................................................................... 203<br />
HEALTHCARE ................................................................................................................. 206<br />
OPPORTUNITIES FOR CITIZEN ACTION: WHAT CAN YOU DO? ..................................... 212<br />
CONCLUSION ............................................................................................................................................... 218<br />
FURTHER READING ............................................................................................................................... 219<br />
APPENDICES<br />
APPENDIX I FACTORS AFFECTING GLOBAL DECLINE RATE ............................... 226<br />
APPENDIX II PEAK COAL........................................................................................................ 228<br />
APPENDIX III PEAK NATURAL GAS..................................................................................... 238<br />
APPENDIX IV VEHICLE OWNERSHIP PER PERSON IN MONROE COUNTY ....... 243<br />
TASK FORCE MEMBERS .................................................................................................................. 244
Preface<br />
Our society is reaching a turning point. Very soon, perhaps already, a key energy and<br />
material resource will reach a historic transition. This point, known as “peak oil,” will<br />
usher in a new age – <strong>of</strong> declining capacity to supply society with an energy source<br />
unmatched in energy density, net energy return, scale, and ease <strong>of</strong> use.<br />
<strong>Peak</strong> production has occurred before in fields, regions and nations – the United <strong>State</strong>s<br />
<strong>of</strong>fering the most famous example – but now we stand poised to peak globally. Because oil<br />
is a finite, non‐renewable resource, a worldwide decline in production is inevitable.<br />
<strong>Peak</strong> oil will necessitate many changes in society. It is difficult to imagine how we can<br />
continue a transportation‐intensive culture without this key resource. Similarly, most <strong>of</strong><br />
industrial agriculture relies on fossil fuel inputs. Indeed, oil is a feedstock <strong>of</strong> a truly<br />
massive array <strong>of</strong> products. And economic growth, entailing ever‐greater throughput <strong>of</strong><br />
materials and increasing consumption, has depended on expanding energy availability.<br />
The consequences <strong>of</strong> oil production decline are therefore serious. It may be difficult to fully<br />
grasp and acknowledge the implications. Can the future be so different than today? Ten<br />
years ago, few would have predicted the collapse <strong>of</strong> a paramount blue chip institution such<br />
as General Motors. And few astute political commentators would have predicted the<br />
election <strong>of</strong> an African American President <strong>of</strong> the United <strong>State</strong>s. The collapse <strong>of</strong> the former<br />
Soviet Union and the rise <strong>of</strong> global communications via the internet are also testaments to<br />
rapid change in a very short time.<br />
The changes implied by peak oil are immense, and thus will require preparation and<br />
planning commensurate with the size <strong>of</strong> the problem.<br />
The transition to a post‐peak oil world will likely entail the shortening <strong>of</strong> commercial and<br />
trade supply lines and the relocalization <strong>of</strong> essential community needs, such as food<br />
production. Products that require little oil in their composition and manufacturing will be<br />
favored. We will have to develop and employ new technologies that are both<br />
environmentally benign and based on renewable resources and energy. There will also be<br />
a need for skills that have been neglected in the age <strong>of</strong> cheap energy, and knowledge<br />
thought to be outdated and obsolete. Prosperity may take on new meaning – from a simple<br />
metric <strong>of</strong> accumulated money to a broader meaning <strong>of</strong> community well being, security, and<br />
commonwealth.<br />
On the most basic level, peak oil, climate change, and a host <strong>of</strong> other environmental crises<br />
require that we recognize and live within the limits <strong>of</strong> our biosphere. This is the challenge<br />
and opportunity that we have before us today. We hope that this report contributes to a<br />
prosperous and resilient future.<br />
Dave Rollo<br />
Chair, <strong>Bloomington</strong> <strong>Peak</strong> <strong>Oil</strong> <strong>Task</strong> <strong>Force</strong><br />
<strong>Report</strong> <strong>of</strong> the <strong>Bloomington</strong> <strong>Peak</strong> <strong>Oil</strong> <strong>Task</strong> <strong>Force</strong> i
ACKNOWLEDGMENTS<br />
Thank you to the Mayor and <strong>City</strong> Council for their vision in establishing this <strong>Task</strong> <strong>Force</strong>.<br />
Many thanks to Russ Goodman, GIS Specialist for the <strong>City</strong> <strong>of</strong> <strong>Bloomington</strong>, for his tireless<br />
and patient help in rendering maps, attending meetings, and <strong>of</strong>fering feedback.<br />
Thanks to the <strong>Task</strong> <strong>Force</strong>’s excellent SPEA Fellows: Sean Ziegler (May 2008 ‐ October 2008)<br />
and Sarah Germann (October 2008‐May 2009) for their thorough note taking and research.<br />
Thanks also to the following <strong>City</strong> staff for their insight and help in collecting data:<br />
Lisa Abbott, Danise Alano, Bobby Chestnut, Barry Collins, Chief Diekh<strong>of</strong>f, Leigh Hayes,<br />
Raymond Hess, Susie Johnson, Chief Kerr, John Langley, Lisa Lazell, Danny Lopez, Tom<br />
Micuda, Patrick Murphy, Mick Renneisen, Scott Robinson, Dan Sherman, Amy Silkworth,<br />
Michael Simmons, Shelby Walker, Adam Wason, Chuck Winkle & Alisa Wood.<br />
Thanks to Lew May, General Manager <strong>of</strong> <strong>Bloomington</strong> Transit Corporation and to Terry<br />
Usrey <strong>of</strong> the Southern <strong>Indiana</strong> Renewable Energy Network (SIREN).<br />
Thank you to the fantastic CATS crew for their expert coverage <strong>of</strong> <strong>Task</strong> <strong>Force</strong> meetings.<br />
Throughout the <strong>Task</strong> <strong>Force</strong>’s life, a number <strong>of</strong> students have provided assistance. Thanks<br />
to: Syed Mohiuddin for his analysis <strong>of</strong> local currency. Thanks also to: Jillian Carter, Michael<br />
Falls, Stephen Lucas, Ian Oehler and Emilee Schwartz.<br />
Further thanks to Nate Hagens <strong>of</strong> the Gund Institute for teleconferencing with the <strong>Task</strong><br />
<strong>Force</strong> about natural gas production. Thanks to Richard Heinberg, Senior Fellow‐in‐<br />
Residence at the Post‐Carbon Institute and Pat Murphy and Megan Quinn <strong>of</strong> Community<br />
Solutions for giving presentations on peak oil to the <strong>Bloomington</strong> Community.<br />
Each <strong>Task</strong> <strong>Force</strong> member assumed responsibility for drafting a section <strong>of</strong> the report.<br />
• The Economic Context (Gary Charbonneau)<br />
• Municipal Services (Dave Rollo & Stacy Jane Rhoads)<br />
• Land Use (Gregory Travis)<br />
• Transportation (Christine Glaser)<br />
• Housing (Stephanie Kimball)<br />
• Sustenance (Peter Bane)<br />
• Appendix on decline rate (Dave Rollo)<br />
• Appendices on coal and natural gas (Gary Charbonneau)<br />
Editors: Charbonneau, Fuqua, and Rhoads.<br />
The findings and recommendations herein are solely those <strong>of</strong> the <strong>Task</strong> <strong>Force</strong> and do not<br />
necessarily reflect those <strong>of</strong> any other individual, department, institution, or agency.<br />
Any errors are those <strong>of</strong> the <strong>Task</strong> <strong>Force</strong>.<br />
<strong>Report</strong> <strong>of</strong> the <strong>Bloomington</strong> <strong>Peak</strong> <strong>Oil</strong> <strong>Task</strong> <strong>Force</strong><br />
ii
EXECUTIVE SUMMARY<br />
<strong>Oil</strong> infuses just about every aspect <strong>of</strong> our lives. We rely on cheap oil for everyday<br />
necessities such as transportation, food, clothing, and electricity. However, oil is a non‐<br />
renewable resource. It is widely acknowledged that the world has reached, or will soon<br />
reach, the point at which oil production is at its maximum, or peak. Once the world reaches<br />
peak oil production, we will not run out <strong>of</strong> oil but we will run short <strong>of</strong> oil. At that point, the<br />
price <strong>of</strong> oil will rise and become more volatile. Given the systemic nature <strong>of</strong> oil, a decline in<br />
the availability <strong>of</strong> cheap oil will have implications for all aspects <strong>of</strong> society.<br />
The <strong>Bloomington</strong> <strong>Peak</strong> <strong>Oil</strong> <strong>Task</strong> <strong>Force</strong> was charged with assessing <strong>Bloomington</strong>'s<br />
vulnerability to a decline in cheap oil and developing researched and prudent strategies to<br />
protect our community. Since March 2008, the <strong>Bloomington</strong> <strong>Peak</strong> <strong>Oil</strong> <strong>Task</strong> <strong>Force</strong> has met<br />
bi‐weekly to discuss ways in which our community might be made more resilient in the<br />
face <strong>of</strong> peak oil. Specifically, the <strong>Task</strong> <strong>Force</strong> examined the following community systems:<br />
municipal services, transportation, land use, housing, sustenance, and the economic<br />
context.<br />
The <strong>Task</strong> <strong>Force</strong> envisions a post‐peak <strong>Bloomington</strong> wherein most residents live within<br />
walking distance <strong>of</strong> daily needs; most <strong>of</strong> the food required to feed residents is grown within<br />
Monroe County; residents can easily and conveniently get where they need to go on bike,<br />
foot or public transit; most <strong>of</strong> the community’s housing stock is retr<strong>of</strong>it for energy<br />
efficiency; and local government provides high‐quality services to its residents while using<br />
less fossil fuel energy.<br />
While peak oil presents our community with serious challenges, it also presents us with an<br />
opportunity to make a great community even better.<br />
<strong>Report</strong> <strong>of</strong> the <strong>Bloomington</strong> <strong>Peak</strong> <strong>Oil</strong> <strong>Task</strong> <strong>Force</strong><br />
iii
The following is a representative, but not exhaustive, review <strong>of</strong> vulnerabilities and<br />
strategies identified by the <strong>Task</strong> <strong>Force</strong>:<br />
Economic Context. <strong>Bloomington</strong> and Monroe County are clearly part <strong>of</strong> both national and<br />
global economies and our reliance on a steady supply <strong>of</strong> inexpensive goods from as far<br />
away as half‐way around the world makes us vulnerable to a decline in inexpensive oil.<br />
Mitigation:<br />
• Promote economic relocalization through “Buy Local!” initiatives; encourage a Local<br />
Exchange Trading System and cooperate with Transition <strong>Bloomington</strong>.<br />
• Examine sector dependence on oil.<br />
• Develop and deploy sustainable forms <strong>of</strong> energy.<br />
• Develop and promote green jobs.<br />
Municipal Services. As the price <strong>of</strong> oil both becomes more volatile and more expensive,<br />
so too will the price <strong>of</strong> electricity, natural gas, and other energy resources. It will become<br />
more expensive for the <strong>City</strong> to: treat and pump drinking water; treat its wastewater;<br />
provide fuel for law enforcement and fire protection; heat and cool municipal buildings;<br />
and pick up trash and recycling. Similarly, the <strong>City</strong> will also experience a general increase in<br />
cost <strong>of</strong> just about anything that relies on energy to produce and transport it.<br />
Mitigation:<br />
• Explore hybrid energy (hydroelectric‐solar) generation to complement existing<br />
power at the water treatment plant.<br />
• Encourage more rainwater capture by residents and the <strong>City</strong>.<br />
• Offer energy efficiency and water conservation incentives to residents.<br />
• Expand water storage capacity.<br />
• Transition all back‐up generators to renewable sources <strong>of</strong> energy.<br />
• Develop a community compost program.<br />
• Establish waste reduction goals ‐‐ Zero Waste <strong>Bloomington</strong> by 2040.<br />
• Explore sludge‐to‐biogas energy generation at the wastewater treatment plant.<br />
• Develop a fuel allocation plan wherein, in the event <strong>of</strong> a fuel shortage, the Police<br />
and Fire Departments are given greatest priority.<br />
• Replace patrol cars with electric vehicles.<br />
• Investigate police pursuit vehicles that do not rely on fossil fuels and transition over<br />
to such vehicles as this technology improves.<br />
• Explore alternatives to asphalt.<br />
• Offer carpooling incentives to employees.<br />
• Reduce the size <strong>of</strong> the <strong>City</strong> fleet though partnerships with car sharing groups.<br />
<strong>Report</strong> <strong>of</strong> the <strong>Bloomington</strong> <strong>Peak</strong> <strong>Oil</strong> <strong>Task</strong> <strong>Force</strong><br />
iv
Transportation. Of all sectors, transportation is the most petroleum dependent and the<br />
most vulnerable to a disruption resulting from declining world petroleum supplies. Ninety‐<br />
seven percent <strong>of</strong> transportation energy is reliant on fossil fuel. In Monroe County, we drive<br />
approximately 2.8 million miles per day. That’s like driving one car around the Earth at the<br />
equator 112 times in one day.<br />
Mitigation:<br />
• Bring daily necessities closer to where people live.<br />
• Establish ride and car sharing programs.<br />
• Increase connectivity & the number <strong>of</strong> planned “lengthy corridors” for bicyclists.<br />
• Make bus transportation faster and more attractive.<br />
• Seek funding improvements for <strong>Bloomington</strong> Transit.<br />
• Encourage <strong>Bloomington</strong> Transit to transition its bus fleet from one relying on diesel<br />
fuel to one relying on locally‐produced biogas.<br />
• Work toward a regional Comprehensive Land Use and Transportation Plan<br />
involving the <strong>City</strong> <strong>of</strong> <strong>Bloomington</strong>, Monroe County, and <strong>Indiana</strong> University that<br />
fosters bicycle, pedestrian, and transit‐friendly changes in land use.<br />
• Encourage commuter rail between <strong>Bloomington</strong> and other cities.<br />
• Encourage bus service between <strong>Bloomington</strong> and downtown <strong>Indiana</strong>polis.<br />
Land Use. When it comes to land use, the physical separation <strong>of</strong> where we live from<br />
where we carry out the activities <strong>of</strong> everyday life – work, food, school, health care, and<br />
community – is by far the biggest threat posed by the end <strong>of</strong> cheap oil.<br />
Mitigation:<br />
• Through zoning and other land management tools, encourage the redistribution <strong>of</strong><br />
land to bring about denser living arrangements, and a closer integration <strong>of</strong><br />
residential and commercial activity, thus reducing the total amount <strong>of</strong> intra‐city<br />
transportation required. We must restructure our community to provide high‐<br />
density, multi‐use arrangements friendly to transit, bicycles, and pedestrians.<br />
• Update the <strong>City</strong>’s land use documents with an eye to peak oil.<br />
• Target public transit routes to help shape neighborhood development.<br />
Housing. An aging grid, paired with the likelihood that more and more people will turn to<br />
electricity to power their cars, means that the grid will be increasingly taxed. In <strong>Indiana</strong>,<br />
the grid is powered by coal‐generated energy. Coal relies on oil for extraction and<br />
transportation. Absent efficiency improvements, it will be ever‐more expensive to heat our<br />
homes.<br />
Mitigation:<br />
• Engage in outreach to reduce energy demand through conservation.<br />
• Work to retr<strong>of</strong>it 5% <strong>of</strong> homes for energy efficiency per year.<br />
• Explore the possibility <strong>of</strong> local power generation from renewable sources.<br />
• Establish loans and incentives for installation <strong>of</strong> renewable energy.<br />
• Create incentives to make rental units more energy efficient.<br />
<strong>Report</strong> <strong>of</strong> the <strong>Bloomington</strong> <strong>Peak</strong> <strong>Oil</strong> <strong>Task</strong> <strong>Force</strong><br />
v
Sustenance can be understood as the maintenance and nurturance <strong>of</strong> health and life. The<br />
elements <strong>of</strong> sustenance include: food, water, waste handling, and health care. At present,<br />
these elements are provided by private companies, government, and publicly‐owned<br />
corporations and are entirely dependent on petroleum. Indeed, less than 2 percent <strong>of</strong> the<br />
food consumed by city residents is produced within the city, its surrounding region or the<br />
state.<br />
Mitigation:<br />
• Work closely with the private sector and <strong>Indiana</strong> University to outline a detailed<br />
plan for community food security. Adopt a Food Security Resolution.<br />
• Plant edible landscapes on public property.<br />
• Organize <strong>City</strong>‐led horticultural services to include the collection,<br />
processing, and distribution <strong>of</strong> organic waste.<br />
• Increase local food storage.<br />
• Train and deploy more urban farmers.<br />
• Remove or reduce legal, institutional, and cultural barriers to farming within<br />
and around the city, and open institutional markets to local food.<br />
• Establish food‐business incubator programs with access to community<br />
kitchens.<br />
• Dedicate public land to intensive gardening and farming.<br />
• Work toward a year‐round regional farmers’ market.<br />
• Work toward the establishment <strong>of</strong> a local land trust for the banking <strong>of</strong> farmland.<br />
• Work toward providing more local or regional organic food to Monroe County<br />
Community School Corporation, <strong>Indiana</strong> University, Ivy Tech, and <strong>Bloomington</strong><br />
Hospital.<br />
• Create a local, publicly‐controlled seedbank.<br />
• Encourage water conservation through outreach and incentives.<br />
• Create community composting sites.<br />
• While the <strong>City</strong> has little direct influence over health care, it can work with<br />
stakeholders to advocate for a health care system that is resilient even in the face<br />
<strong>of</strong> peak oil. Specifically, as a community we should: encourage a mobile medical<br />
corps for house calls; encourage more neighborhood health clinics and doctors’<br />
<strong>of</strong>fices; and support a concentration <strong>of</strong> essential medical services to remain in the<br />
central city location accessible by public transit and pedestrians.<br />
<strong>Report</strong> <strong>of</strong> the <strong>Bloomington</strong> <strong>Peak</strong> <strong>Oil</strong> <strong>Task</strong> <strong>Force</strong><br />
vi
<strong>Report</strong> <strong>of</strong> the <strong>Bloomington</strong> <strong>Peak</strong> <strong>Oil</strong> <strong>Task</strong> <strong>Force</strong><br />
INTRODUCTION<br />
<strong>Oil</strong> is everywhere. The food we eat, the clothes we wear, the tools and materials we use to<br />
build and repair our homes, all rely on petroleum inputs. Most medical products and the<br />
delivery <strong>of</strong> medical care rely on oil. Of course, oil has afforded us an unmatched mobility as<br />
found in the personal automobile. Cars have given birth to vast road networks that have<br />
reshaped human settlement patterns. The billions <strong>of</strong> plastic products available today are<br />
made from oil. <strong>Oil</strong> is even a major component <strong>of</strong> some non‐obvious products like denture<br />
adhesives, basketballs, and lip balm. In short, oil is systemic – a key, if <strong>of</strong>ten invisible,<br />
component <strong>of</strong> our everyday lives.<br />
Cheap oil has allowed us to achieve great economic benefit, enabling us to enjoy<br />
inexpensive food, travel, and manufactured products. Indeed, while the US comprises five<br />
percent <strong>of</strong> the world’s population, it consumes 25 percent <strong>of</strong> the world’s oil. Ninety‐five<br />
percent <strong>of</strong> our transportation infrastructure relies on petroleum.<br />
However, oil is also finite. Most <strong>of</strong> the oil the world now consumes consists <strong>of</strong> biological<br />
material deposited at the bottom <strong>of</strong> ancient shallow seas between 90 million and 150<br />
million years ago. While nature can and eventually will produce more oil, it will do so only<br />
very slowly and on a time scale that must be measured in “geologic” terms – tens <strong>of</strong><br />
millions <strong>of</strong> years. Therefore, for all practical human purposes, once a barrel <strong>of</strong> oil is<br />
consumed, it will never be replaced.<br />
1
WHAT IS “PEAK OIL”?<br />
Given the finite nature <strong>of</strong> oil, the fundamental problem is that there must inevitably come a<br />
point in time when world oil production reaches some absolute maximum and then goes<br />
into decline. Attributed to petroleum geologist M. King Hubbert, the term “peak oil” does<br />
not refer to the time when we “run out” <strong>of</strong> oil. Instead, the problem is that we will run out<br />
<strong>of</strong> cheap oil. Long before the oil runs out, the difficulty and cost <strong>of</strong> extraction will have risen<br />
so far that it will no longer be possible to increase the rate <strong>of</strong> production. Instead <strong>of</strong><br />
increasing, production will start to fall. That point – the point at which the growth rate in<br />
global oil production turns into a decline rate – is the point <strong>of</strong> “peak oil.” When we reach<br />
that point, we will not have “run out” <strong>of</strong> oil, but we will have “run short.”<br />
In order to grasp the point that “running short” is not the same as “running out,” it is<br />
necessary to understand that the “sipping soda through a straw” model <strong>of</strong> oil production is<br />
incorrect. That model assumes that it would be possible to suck up the world’s oil at a<br />
uniform high rate until suddenly, one day, the oil is all gone, just as it would be possible to<br />
sip up all the soda in a glass at a uniformly high rate until the bottom <strong>of</strong> the glass is reached.<br />
The extraction <strong>of</strong> natural resources such as oil does not proceed in this way.<br />
In reality, what happens is that the oil which is high quality, easy to find and readily<br />
processed is used first. The oil that is inferior, harder to find and/or more difficult to<br />
extract is produced later. The result is something <strong>of</strong> a bell‐shaped curve, in which<br />
production rises over time to a peak and then transitions into decline. During the decline<br />
phase, oil production continues to fall as the remaining sources become more and more<br />
difficult to extract. M. King Hubbert projected that world oil production would peak around<br />
2000, but continue at ever‐declining rates for another 200 years thereafter. Hubbert’s<br />
projection turns out to have been <strong>of</strong>f by a few years – world oil production did not actually<br />
peak quite as early as 2000 – but he was remarkably close.<br />
<strong>Report</strong> <strong>of</strong> the <strong>Bloomington</strong> <strong>Peak</strong> <strong>Oil</strong> <strong>Task</strong> <strong>Force</strong><br />
2
The “Hubbert Curve.” Decades ago, Hubbert predicted oil production would peak in 2000. It turns out Hubbert<br />
was not exactly right, but pretty close. Source: Wikimedia Commons<br />
When this <strong>Task</strong> <strong>Force</strong> began its work in March 2008, there was a sense that the peak might<br />
still be a few years away. However, it is now clear that peak may have arrived while we<br />
went about our work. It is likely that the world will never again produce or be able to<br />
produce as much oil in a single year as it did in 2008. Production reached a plateau in 2005<br />
and barely budged above that the plateau through 2008, despite a record oil price <strong>of</strong> $147 a<br />
barrel recorded in July. That month, the price <strong>of</strong> a gallon <strong>of</strong> unleaded gasoline rose to over<br />
$4.00 a gallon in <strong>Bloomington</strong> and as high as $5.00 a gallon in other parts <strong>of</strong> the county.<br />
Subsequently, as we all know, the market price <strong>of</strong> oil – and the price <strong>of</strong> unleaded –<br />
plummeted. This was not because <strong>of</strong> an increase in production, but because <strong>of</strong> a huge drop<br />
in demand. In fact, oil production is down significantly. The Organization <strong>of</strong> Petroleum<br />
Exporting Countries (OPEC) in particular has reduced its output in an attempt to set a<br />
bottom limit to the price. In the meantime, exploration for new oil fields and much<br />
development <strong>of</strong> previously‐identified but hitherto unexploited fields has been put on hold.<br />
As the economy begins to recover from its worst nosedive since the Great Depression,<br />
<strong>Report</strong> <strong>of</strong> the <strong>Bloomington</strong> <strong>Peak</strong> <strong>Oil</strong> <strong>Task</strong> <strong>Force</strong><br />
3
demand for oil will once again ramp up, but it will be difficult to achieve the production<br />
level <strong>of</strong> 2008, much less to move beyond it.<br />
Further evidence that peak oil has been either reached or is very near is that we are now<br />
discovering less and less new oil. Indeed, the rate <strong>of</strong> production has been outrunning the<br />
rate <strong>of</strong> new discovery by an ever‐growing margin for almost a quarter <strong>of</strong> a century:<br />
Source: www.aspo‐ireland.org<br />
However, it’s not just the <strong>Bloomington</strong> <strong>Peak</strong> <strong>Oil</strong> <strong>Task</strong> <strong>Force</strong> who thinks we’ve reached peak.<br />
Many experts agree. Recently, analysts at the financial services company Raymond James<br />
announced that:<br />
Non‐OPEC oil production apparently peaked in the first quarter <strong>of</strong> 2007, and given<br />
precipitous falls in oil output from Russia to Mexico, there’s not much hope <strong>of</strong> a<br />
recovery. OPEC production – and thus global output – peaked a little later, in the<br />
first quarter <strong>of</strong> 2008…. The contention rests on a simple argument: OPEC oil<br />
production actually fell even as oil prices were above $100 a barrel, a sign <strong>of</strong> the<br />
‘tyranny <strong>of</strong> geology’ that limits the easy production <strong>of</strong> ever more crude. Those<br />
declines had to have come for involuntary reasons such as the inherent geological<br />
limits <strong>of</strong> oil fields…. We believe that the oil market has already crossed over to the<br />
downward sloping side <strong>of</strong> Hubbert’s <strong>Peak</strong>. 1<br />
1 Keith Johnson, “<strong>Peak</strong> <strong>Oil</strong>: Global Production’s <strong>Peak</strong>ed, Analyst Says,” Wall Street Journal Blog, May 4, 2009.<br />
http://blogs.wsj.com/environmentalcapital/2009/05/04/peak‐oil‐global‐oil‐productions‐peaked‐analyst‐says.<br />
<strong>Report</strong> <strong>of</strong> the <strong>Bloomington</strong> <strong>Peak</strong> <strong>Oil</strong> <strong>Task</strong> <strong>Force</strong><br />
4
Other observers believe that peak oil might not be here just yet, but is right around the<br />
corner.<br />
● The president <strong>of</strong> the international Association for the Study <strong>of</strong> <strong>Peak</strong> <strong>Oil</strong> and<br />
Gas, Pr<strong>of</strong>. Kjell Aleklett <strong>of</strong> the University <strong>of</strong> Uppsala in Sweden, stated that<br />
“oil production will probably peak between 2011 and 2012…. Perhaps if<br />
demand grows more moderately than expected, the peak might be delayed<br />
until 2018 or so.” 2<br />
● Speaking at his association’s 2009 annual convention, Eric Streitberg,<br />
chairman <strong>of</strong> the Australian Petroleum Production and Exploration<br />
Association, stated that “peak oil is just three years away.” 3<br />
● Charlie Maxwell, energy expert from Barron’s magazine, believes that,<br />
because <strong>of</strong> the current recession, peak oil has been postponed by a couple <strong>of</strong><br />
years, from 2013 to 2015. 4<br />
2 Tom Nicholls, “The <strong>Peak</strong> is Nigh” [interview with Kjell Aleklett], Petroleum Economist, April 2008, 40,<br />
http://www.fysast.uu.se/ges/files/April%202008%20Issue%20‐%20The%20peak%20is%20nigh.pdf.<br />
3 Andrew Collins and Andrew Curtin, “<strong>Peak</strong> <strong>Oil</strong>, ETS and Jobs on the Agenda at APPEA 09 <strong>Oil</strong> and Gas<br />
Conference,” February 6, 2009, http://www.abc.net.au/rural/resource/stories/s2587478.htm<br />
4 When recently asked what had surprised him most about the “oil roller coaster we’ve been on,” Maxwell<br />
replied:<br />
I would have to say that what struck me most, as a surprise, is the virulence in the<br />
downtrend in the world economy. That’s a negative for the peak oil story, but only a<br />
temporary negative. By crushing demand, we are in effect gaining two more years, maybe<br />
three, in which we in the consuming world have added to our time before the peak, and<br />
could take good advantage <strong>of</strong>, since the peak is right upon us – I have it still at 2015 for all<br />
liquids…. A lot <strong>of</strong> people had said that the year 2015 is too far out for the peak. But I built a<br />
big margin in there because I thought we might have two recessions. I didn’t dream that we<br />
would have one really big one. So I’ve got 2015 out there. But if you said to me last July,<br />
when do you really believe the peak is going to come, I would have said 2013. I started years<br />
earlier by estimating 2015 and I happily held to that view as I saw the recession begin to<br />
develop because I could see that we would probably push it <strong>of</strong>f a little bit. For your<br />
purposes, I’ve got 2008 for the peak <strong>of</strong> non‐OPEC – not really a peak, it’s a plateau, but we’re<br />
falling <strong>of</strong>f it now. And then 2011 for the peak <strong>of</strong> the top 50 listed companies, the ones that<br />
dominate the stock market, so the stock market investors will say the oil industry has<br />
peaked because their stocks have peaked. And then I’ve got 2012 for the peak <strong>of</strong> black crude<br />
oil and the 2015 for the all‐liquids peak, which I take to be ultimate peak oil. And that would<br />
include gas‐to‐liquids, coal‐to‐liquids, NGL’s [natural gas liquids]. And it would include both<br />
synthetic and natural crudes. Steve Andrews, “Interview with Charlie Maxwell (Part 1 <strong>of</strong> 2),”<br />
The Energy Bulletin, June 22, 2009 (http://www.energybulletin.net/node/49303).<br />
<strong>Report</strong> <strong>of</strong> the <strong>Bloomington</strong> <strong>Peak</strong> <strong>Oil</strong> <strong>Task</strong> <strong>Force</strong><br />
5
The phenomenon <strong>of</strong> peak oil is even recognized by the U.S. government. The Government<br />
Accountability Office (GAO) reports that energy markets will become more volatile, making<br />
supply disruptions more likely. The GAO advises that “[t]he consequences <strong>of</strong> a peak and<br />
permanent decline in oil production could be even more prolonged and severe than those<br />
<strong>of</strong> past oil supply shocks.” 5 A U.S. Department <strong>of</strong> Energy‐sponsored study, widely known as<br />
the “Hirsch <strong>Report</strong>,” makes it clear that peak oil presents the world with an unprecedented<br />
risk management problem:<br />
Waiting until world oil production peaks before taking crash program action<br />
would leave the world with a significant liquid fuel deficit for more than two<br />
decades. Initiating a mitigation crash program 10 years before world oil<br />
peaking helps considerably but still leaves a liquid fuels shortfall roughly a<br />
decade after the time that oil would have peaked. Initiating a mitigation<br />
crash program 20 years before peaking appears to <strong>of</strong>fer the possibility <strong>of</strong><br />
avoiding a world liquid fuels shortfall for the forecast period.<br />
The obvious conclusion … is that with adequate, timely mitigation, the<br />
economic costs to the world can be minimized. If mitigation were to be too<br />
little, too late, world supply/demand balance will be achieved through<br />
massive demand destruction (shortages), which would translate to<br />
significant economic hardship.<br />
There will be no quick fixes…. Effective mitigation means taking decisive<br />
action well before the problem is obvious. 6<br />
When the Hirsch <strong>Report</strong> was written in 2005, the authors were reluctant to state precisely<br />
when oil production might peak, as the range <strong>of</strong> estimates was still too broad. They cited a<br />
number <strong>of</strong> authorities who disagreed about the probable date <strong>of</strong> peaking, putting it<br />
anywhere from as early as 2006 to as late as 2025 or later. By June 2008, however, lead<br />
author Robert Hirsch had concluded that “Today the situation is worse [than it was in<br />
2005] and the reason for this is that it is now obvious that world oil production is already<br />
on a plateau. It has reached a high level, and has leveled <strong>of</strong>f. The point at which oil<br />
production will decline is probably not far away. If the world [had] started to implement<br />
5 US General Accounting Office, Crude <strong>Oil</strong>: Uncertainty about Future <strong>Oil</strong> Supply Make it Important to Develop a<br />
Strategy for Addressing a <strong>Peak</strong> and Decline in <strong>Oil</strong> Production, GAO‐07‐283, February 2007.<br />
6 Hirsch, R. L., Bezdek, R., Wendling, R. <strong>Peak</strong>ing <strong>of</strong> World <strong>Oil</strong> Production: Impacts, Mitigation & Risk<br />
Management. U.S. Department <strong>of</strong> Energy. National Energy Technology Laboratory. February 2005<br />
(hereinafter, the “Hirsch <strong>Report</strong>”).<br />
<strong>Report</strong> <strong>of</strong> the <strong>Bloomington</strong> <strong>Peak</strong> <strong>Oil</strong> <strong>Task</strong> <strong>Force</strong><br />
6
solutions 20 years before the peak oil problem, we would have stood a very good chance <strong>of</strong><br />
beating the problem and could have avoided significant negative consequences for our<br />
economy. As it turns out, we now don’t have 20 years; we don’t even have 10.” 7<br />
The <strong>Task</strong> <strong>Force</strong> endorses this view. After close examination, the <strong>Task</strong> <strong>Force</strong> agrees that the<br />
date <strong>of</strong> peak will turn out to be somewhere between 2008 and 2015 – most likely 2008. It<br />
is clear that peak oil is either here or right around the corner. Now is the time to<br />
collectively implement measures to reduce our reliance on petroleum.<br />
RATE OF OIL DEPLETION<br />
So what happens after production peaks? Production obviously declines thereafter. The<br />
rate <strong>of</strong> decline is widely estimated to be about 3 percent per year. 9 The Association for the<br />
Study <strong>of</strong> <strong>Peak</strong> <strong>Oil</strong> and Gas estimates that by 2030, production could be down to 50‐60<br />
million barrels per day from a possible high <strong>of</strong> 90‐94 million barrels per day. 10 The rate at<br />
which the world has been burning through oil is sobering. Although oil production began<br />
as far back as 1859, by 2005:<br />
97% <strong>of</strong> all the oil that had ever been produced worldwide had been<br />
produced since 1940.<br />
88% <strong>of</strong> the oil that had ever been produced had been produced since<br />
1960.<br />
57% <strong>of</strong> all the oil that had ever been produced had been produced<br />
since 1980.<br />
37% <strong>of</strong> all the oil that had ever been produced had been produced since<br />
1990. 11<br />
7 Allianz, Energy Future: A Significant Period <strong>of</strong> Discomfort, Interview with Robert Hirsch, June 2008.<br />
http://knowledge.allianz.com/en/globalissues/safety_security/energy_security/hirsch_peak_oil_production.html<br />
9 The <strong>Oil</strong> Depletion Protocol, http://www.oildepletionprotocol.org/. Please see Appendix I for a discussion <strong>of</strong><br />
factors that affect global decline rate.<br />
10 Nicholls, loc. cit.<br />
11 Richard Gilbert and Anthony Perl, Transport Revolutions: Moving People and Freight Without <strong>Oil</strong> (London,<br />
Earthscan, 2008), 120.<br />
<strong>Report</strong> <strong>of</strong> the <strong>Bloomington</strong> <strong>Peak</strong> <strong>Oil</strong> <strong>Task</strong> <strong>Force</strong><br />
7
Given the enormous rate at which the world has been burning its way through oil in the<br />
past few decades, two things are highly probable:<br />
• Geological constraints alone are enough to prevent continued production at the<br />
current near‐peak rates much beyond 2015.<br />
• Despite continuing significant declines as time goes on, production rates will remain<br />
sufficiently high that most <strong>of</strong> the remaining oil in the world will be consumed over<br />
the course <strong>of</strong> the next few decades. If the downslope <strong>of</strong> the global oil production<br />
curve resembles the upslope, 90% <strong>of</strong> the world’s remaining recoverable oil will be<br />
gone within 50 years <strong>of</strong> the peak – in other words, within roughly 50 years <strong>of</strong> the<br />
present.<br />
What’s more, the U.S. currently imports approximately two‐thirds <strong>of</strong> its oil. Our ability to<br />
do so depends on the continued willingness and ability <strong>of</strong> a relatively small number <strong>of</strong> oil‐<br />
producing nations with surpluses to continue to export. However, production within many<br />
<strong>of</strong> those countries will probably be going into decline within one or two decades.<br />
It’s time to change the way we do business. It’s time to re‐think our individual and<br />
community habits to radically reduce our reliance on oil.<br />
STRATEGIES THAT WILL NOT SOLVE THE PROBLEM<br />
As the discourse on “peak oil” intensifies, so too do possible “solutions.” Many solutions<br />
pivot on the idea that we will be able to continue “business as usual” without any effort to<br />
conserve or become more efficient. For reasons explained below, the <strong>Task</strong> <strong>Force</strong> considers<br />
some <strong>of</strong> the most popular proposals – drilling in the Arctic National Wildlife Refuge, mining<br />
oil shale and bi<strong>of</strong>uels – as intrinsically limited and flawed.<br />
Arctic National Wildlife Refuge (ANWR)<br />
The ban on <strong>of</strong>fshore drilling in the Arctic National Wildlife Refuge (ANWR) has re‐entered<br />
public discussion and some advocate for opening up this ecologically‐fragile area for<br />
drilling. However, even if a substantial amount <strong>of</strong> oil is found in this area, it will take many<br />
years to bring it into production.<br />
<strong>Report</strong> <strong>of</strong> the <strong>Bloomington</strong> <strong>Peak</strong> <strong>Oil</strong> <strong>Task</strong> <strong>Force</strong><br />
8
What’s more, it is highly unlikely that ANWR could produce anywhere near the amount <strong>of</strong><br />
oil necessary to meet current U.S. demand. According to a U.S. Geological Survey estimate,<br />
the amount <strong>of</strong> technically‐recoverable oil in ANWR is somewhere between 5.7 and 16<br />
billion barrels. 12 Those sound like huge numbers, but they pale in comparison to<br />
consumption rates. The U.S. has been using oil at the rate <strong>of</strong> approximately 7 billion<br />
barrels per year. Therefore, if ANWR actually does contain as much as 16 billion barrels <strong>of</strong><br />
technically recoverable oil, the U.S. would go through every drop <strong>of</strong> it in a little over two<br />
It is interesting to note that the purpose <strong>of</strong> the first oil well in<br />
Pennsylvania was to find a replacement for whale oil for indoor lighting.<br />
Whale oil burned with a clean, bright flame, but by 1846, the U.S. whaling<br />
fleet had reached “peak whales” and was going to the ends <strong>of</strong> the earth in<br />
search <strong>of</strong> its prey. Above is a cartoon from Vanity Fair, published in 1861<br />
showing happy whales celebrating the discovery <strong>of</strong> oil wells in<br />
Pennsylvania. Source: Vanity Fair, April 20, 1861, 186.<br />
<strong>Report</strong> <strong>of</strong> the <strong>Bloomington</strong> <strong>Peak</strong> <strong>Oil</strong> <strong>Task</strong> <strong>Force</strong><br />
years if it had to rely on that<br />
source alone. 13<br />
By the time ANWR oil came<br />
into production, it is likely<br />
that world production will<br />
already be in steep decline.<br />
The additional production<br />
from ANWR would not be<br />
sufficient to increase world<br />
petroleum output. It would<br />
simply reduce the rate <strong>of</strong><br />
decline slightly for a few<br />
years until ANWR, too,<br />
becomes depleted.<br />
12 The probability that it is at least 5.7 billion barrels is 95%. The probability that it could be as high as 16<br />
billion barrels is only 5%. The mean estimate is 10.4 billion barrels.<br />
13 U.S. Geological Survey, Arctic National Wildlife Refuge, 1002 Area, Petroleum Assessment, 1998, Including<br />
Economic Analysis (Fact Sheet 0028‐01: Online <strong>Report</strong>), http://pubs.usgs.gov/fs/fs‐0028‐01/fs‐0028‐01.htm<br />
9
<strong>Oil</strong> Shale<br />
Production <strong>of</strong> oil from shale has also been proposed as a solution. “<strong>Oil</strong> shale” is neither oil<br />
nor shale. It is a rock containing kerogen, a waxy substance that might best be described as<br />
a precursor to oil. Like petroleum, it consists <strong>of</strong> organic matter laid down millions years<br />
ago. Unlike petroleum, the source rock was never buried deep enough (7,500 to 15,000<br />
feet) to be subject to the intense heat needed to “cook” the kerogen into petroleum. To turn<br />
the kerogen into oil, humans must do what nature has not – apply substantial amounts <strong>of</strong><br />
heat to do the cooking. This makes the conversion <strong>of</strong> kerogen into oil an energy‐intensive<br />
and costly process. Thus, while it always seems as though the production <strong>of</strong> oil from oil<br />
shale might become pr<strong>of</strong>itable if only the price <strong>of</strong> oil would rise a few more dollars a barrel,<br />
when the price <strong>of</strong> oil does go up, the rising cost <strong>of</strong> energy itself continues to make the<br />
production <strong>of</strong> oil from shale economically<br />
unfeasible. This phenomenon has been<br />
dubbed the “Law <strong>of</strong> Receding Horizons.”<br />
According to a 2007 U.S. General<br />
Accounting Office report, “The Green River<br />
Basin is believed to have the potential to<br />
<strong>Report</strong> <strong>of</strong> the <strong>Bloomington</strong> <strong>Peak</strong> <strong>Oil</strong> <strong>Task</strong> <strong>Force</strong><br />
In 1980, I asked an economist who was an<br />
expert on the cost <strong>of</strong> producing oil shales,<br />
what the world price <strong>of</strong> oil would need to be<br />
in order to make oil shale commercial. He<br />
turned the question around by replying that oil<br />
shale would always cost at least $10 per barrel<br />
over the world price <strong>of</strong> oil…. So forget about<br />
oil shale.<br />
– Robert A. Hefner, The GET, 2009<br />
produce 3 million to 5 million barrels per day for hundreds <strong>of</strong> years. However, it is<br />
possible that 10 years from now, the oil shale resource could be producing 0.5 million to<br />
1.0 million barrels per day.” 14 That would be 2.6% to 5% <strong>of</strong> U.S. consumption at current<br />
rates. Such a rate <strong>of</strong> production ten years from now would not result in an increase in U.S.<br />
oil production, but rather would simply reduce the rate <strong>of</strong> decline. However, unless the<br />
"Law <strong>of</strong> Receding Horizons" is somehow repealed, no oil will be produced in commercial<br />
quantities from U.S. oil shale, ever.<br />
14 GAO, Crude <strong>Oil</strong>: Uncertainty about Future <strong>Oil</strong> Supply Makes It Important to Develop a Strategy for Addressing<br />
a <strong>Peak</strong> and Decline in <strong>Oil</strong> Production, February 2007 (http://www.gao.gov/new.items/d07283.pdf), 55.<br />
10
Bi<strong>of</strong>uels<br />
Some believe that it will be possible to make up for the decline in oil production by<br />
resorting to the large scale production <strong>of</strong> bi<strong>of</strong>uels – petroleum substitutes made from<br />
plants. The story <strong>of</strong> bi<strong>of</strong>uel production in the U.S. has been, up to this point, largely the<br />
story <strong>of</strong> corn‐based ethanol. By 2005, the U.S. consumed 3.9 billion gallons <strong>of</strong> ethanol<br />
(compared to 136.9 billion gallons <strong>of</strong> gasoline). 15 By 2008, ethanol production was<br />
predicted to reach some 9 billion gallons. This growth in production was achieved in large<br />
part due to lavish federal subsidies, which in 2007 amounted to 76% <strong>of</strong> all federal subsidy<br />
money going to renewable energy. 16 The utility <strong>of</strong> corn ethanol production has been widely<br />
questioned because <strong>of</strong> doubts about how much it produces in the way <strong>of</strong> additional energy.<br />
According to David Pimentel <strong>of</strong> Cornell University, “To produce a liter <strong>of</strong> 99.5% ethanol<br />
uses 43% more fossil energy than the energy produced as ethanol.” 17 If that statement is<br />
even remotely accurate, then the U.S. corn ethanol program must be viewed as a farm<br />
subsidy program, not an alternative energy program.<br />
Production <strong>of</strong> ethanol from sugar cane, a major industry in Brazil (where production is also<br />
subsidized and where half <strong>of</strong> the cane crop is devoted to ethanol production), seems to<br />
have more potential. According to one estimate, the amount <strong>of</strong> energy produced is about 9<br />
times the amount <strong>of</strong> fossil fuel energy input. 18 However, Pimentel and Tad Patzek place<br />
the energy return on Brazilian cane sugar much lower, at 2.28:1 rather than 9:1; for U.S.<br />
cane sugar, they estimate the rate <strong>of</strong> return at 1.48:1. 19<br />
15 Energy Information Administration, Bi<strong>of</strong>uels in the U.S. Transportation Sector, February 2007 with errata as<br />
<strong>of</strong> October 15, 2007, http://www.eia.doe.gov/oiaf/analysispaper/biomass.html.<br />
16 Jeff St. John, Corn Ethanol’s Subsidy Glut, January 9, 2009,<br />
http://www.greentechmedia.com/articles/read/corn‐ethanols‐subsidy‐glut‐5489/<br />
17 David Pimentel, “Renewable and Solar Energy Technologies: Energy and Environmental Issues,” in Bi<strong>of</strong>uels,<br />
Solar and Wind as Renewable Energy Systems: Benefits and Risks, David Pimentel, ed. (New York: Springer,<br />
2008), 10.<br />
18 Robert M. Boddey et al., “Bio‐Ethanol Production in Brazil,” in Pimentel, ed., Bi<strong>of</strong>uels, Solar and Wind, 321‐356.<br />
19 David Pimentel and Tad W. Patzek, “Ethanol Production: Energy and Economic Issues Related to U.S. and<br />
Brazilian Sugarcane,” in Pimentel, ed., Bi<strong>of</strong>uels, Solar and Wind, 361.<br />
<strong>Report</strong> <strong>of</strong> the <strong>Bloomington</strong> <strong>Peak</strong> <strong>Oil</strong> <strong>Task</strong> <strong>Force</strong><br />
11
One <strong>of</strong> the major problems associated with the production <strong>of</strong> ethanol from corn is that it<br />
drives up the price <strong>of</strong> corn and the price <strong>of</strong> food for consumers. In fact, the ethanol subsidy<br />
program, in combination with heavy spring rains and flooding in the Midwest, was blamed<br />
for a 119% increase in the price <strong>of</strong> corn between 2007 and 2008. 20 Furthermore, because<br />
industrial agriculture relies so heavily upon petroleum inputs, we are likely to experience<br />
lower grain productivity post peak.<br />
Because diverting food crops to fuel production seems like a risky or questionable strategy,<br />
some hopes are placed on “cellulosic” ethanol – fuel produced from crop residues or<br />
grassland biomass. However, Patzek warns that the removal <strong>of</strong> any substantial amount <strong>of</strong><br />
biomass from the land for use as bi<strong>of</strong>uel feedstock is unsustainable – it would rapidly wear<br />
out the soils because the biomass would no longer replenish the nutrients.<br />
NOT JUST PEAK OIL: PEAK ENERGY<br />
<strong>Oil</strong> is not the only hydrocarbon fuel whose production peak will pose difficulties. Coal and<br />
natural gas will also peak in the near future, likely within a couple <strong>of</strong> decades. As more and<br />
more people switch to electricity to power their cars and heat their homes, the peaking <strong>of</strong><br />
both coal and natural gas will also affect the way we go about our individual and collective<br />
lives. In <strong>Indiana</strong>, most <strong>of</strong> our electricity is generated by coal‐burning power plants. The<br />
<strong>Task</strong> <strong>Force</strong> took a very close look at coal and projects that world coal production might<br />
peak around 2030, and that world natural gas might also peak at about the same time.<br />
Both <strong>of</strong> these issues are discussed in detail in Appendices II and III.<br />
20 David Goldman, Food Price Spike: Is Ethanol to Blame? June 27, 2008,<br />
http://money.cnn.com/2008/06/27/news/economy/ethanol_food_prices/index.htm.<br />
<strong>Report</strong> <strong>of</strong> the <strong>Bloomington</strong> <strong>Peak</strong> <strong>Oil</strong> <strong>Task</strong> <strong>Force</strong><br />
12
THE BLOOMINGTON PEAK OIL TASK FORCE<br />
The <strong>Bloomington</strong> <strong>City</strong> Council and Mayor acknowledged peak oil in 2006 with the passage<br />
<strong>of</strong> Resolution 0607: Recognizing the <strong>Peak</strong> <strong>of</strong> World <strong>Oil</strong> Production. In late 2007, the <strong>City</strong><br />
strengthened its commitment to mitigate the effects <strong>of</strong> peak by establishing the<br />
<strong>Bloomington</strong> <strong>Peak</strong> <strong>Oil</strong> <strong>Task</strong> <strong>Force</strong>. As spelled out in Resolution 0716: Establishing a<br />
<strong>Bloomington</strong> <strong>Peak</strong> <strong>Oil</strong> <strong>Task</strong> <strong>Force</strong>, the charge <strong>of</strong> the group was to assess the community’s<br />
vulnerability to changing energy markets and to develop researched and prudent<br />
mitigation strategies. The Resolution called for the <strong>Task</strong> <strong>Force</strong> to document its findings in a<br />
report for approval by the Mayor and <strong>City</strong> Council.<br />
Beginning in March 2008, the seven members <strong>of</strong> the <strong>Task</strong> <strong>Force</strong> met bi‐weekly to work<br />
through vulnerabilities and possible solutions. Early on, the <strong>Task</strong> <strong>Force</strong> decided to parse its<br />
work into the following subjects: The Economic Context, Municipal Services, Land Use,<br />
Transportation, Housing, and Sustenance. Each <strong>Task</strong> <strong>Force</strong> member assumed<br />
responsibility for a particular subject‐matter area. The <strong>Task</strong> <strong>Force</strong> approached each <strong>of</strong><br />
these subject areas with a three‐pronged analysis. First, the group collected background<br />
data. Second, it assessed the community’s vulnerability to a decline in cheap oil in each <strong>of</strong><br />
these subject areas. Lastly, it worked to develop prudent mitigation strategies.<br />
The <strong>Task</strong> <strong>Force</strong> has aimed to make its work as transparent as possible. Members <strong>of</strong> the<br />
<strong>Bloomington</strong> community frequently attended our meetings. For those unable to attend,<br />
<strong>Task</strong> <strong>Force</strong> meetings were broadcast via our local Cable Access Television Service since<br />
August 2008. Members <strong>of</strong> the <strong>Task</strong> <strong>Force</strong> have also given several public talks.<br />
<strong>Report</strong> <strong>of</strong> the <strong>Bloomington</strong> <strong>Peak</strong> <strong>Oil</strong> <strong>Task</strong> <strong>Force</strong><br />
13
GUIDING PRINCIPLES<br />
In drafting recommendations for this <strong>Report</strong>, the <strong>Task</strong> <strong>Force</strong> was guided by the following<br />
principles:<br />
• SUSTAINABILITY. Recommendations should be sustainable. That is, they<br />
should foster environmental integrity, equity, and economic health. They<br />
should also be more than mere short‐term fixes. Recommendations should<br />
work indefinitely, or at least for a very long time.<br />
• ACTIONABILITY. Recommendations should be actionable. Toward this end,<br />
the <strong>Task</strong> <strong>Force</strong> has organized its goals and strategies into those which should<br />
be implemented and/or realized in the short term and those which are long‐<br />
term goals. Most <strong>of</strong>ten, the <strong>Task</strong> <strong>Force</strong>’s recommendations call for the <strong>City</strong><br />
and other community stakeholders to start to explore change immediately,<br />
understanding that it may take years to fully implement a recommendation.<br />
• A FOCUS ON CONSERVATION. While the <strong>Task</strong> <strong>Force</strong>’s recommendations call<br />
for greater efficiencies and, occasionally, new energy sources, most <strong>of</strong> the<br />
recommendations focus on reducing oil consumption. The <strong>Task</strong> <strong>Force</strong><br />
maintains that a lot <strong>of</strong> the oil we use is wasted. We do not need to use all the<br />
oil we do to have happy, prosperous, and fulfilling lives. To the extent that<br />
much <strong>of</strong> our current oil consumption is frivolous, initial steps at conservation<br />
should be immediately actionable.<br />
<strong>Report</strong> <strong>of</strong> the <strong>Bloomington</strong> <strong>Peak</strong> <strong>Oil</strong> <strong>Task</strong> <strong>Force</strong><br />
14
ENDORSEMENT OF THE OIL DEPLETION PROTOCOL<br />
& CALL FOR 5% REDUCTION IN OIL CONSUMPTION<br />
Many other communities have either adopted oil reduction or oil independence goals.<br />
Toward this end, many have endorsed the <strong>Oil</strong> Depletion Protocol, a proposed international<br />
agreement under which nations would reduce their oil consumption at rates at which<br />
known oil reserves are being depleted – approximately 3 percent. 21 The intent <strong>of</strong> the<br />
Protocol is to reduce competition among nations for scare resources and to help<br />
communities prepare for oil price shocks and shortages. Notably, the <strong>Bloomington</strong><br />
Common Council supported the adoption <strong>of</strong> a global oil depletion protocol in 2006 with<br />
Resolution 0607: Recognizing the <strong>Peak</strong> <strong>of</strong> World <strong>Oil</strong> Production.<br />
However, to prepare for peak in a robust way, the <strong>Task</strong> <strong>Force</strong> calls for a reduction in<br />
consumption that not just keeps pace with depletion, but exceeds it. The <strong>Task</strong> <strong>Force</strong><br />
recommends that the community start now to reduce its reliance on petroleum, by<br />
reducing petroleum consumption by 5 percent per year. This would realize a 50 percent<br />
decrease in oil consumption in just 14 years. While it may sound like an ambitious goal, by<br />
cooperating and re‐thinking the way we do things, this is an achievable goal. Not only will<br />
reducing petroleum consumption make the community healthier and more sustainable, it<br />
will save us all money.<br />
21 See <strong>Oil</strong> Depletion Protocol. supra note 9.<br />
<strong>Report</strong> <strong>of</strong> the <strong>Bloomington</strong> <strong>Peak</strong> <strong>Oil</strong> <strong>Task</strong> <strong>Force</strong><br />
15
VISION<br />
The recommendations herein are intended to envision a resilient and prosperous<br />
community while we collectively descend the peak <strong>of</strong> energy production. In so doing, the<br />
<strong>Task</strong> <strong>Force</strong> uses terms that might be new to some, and uses other terms in ways that are a<br />
little different from conventional understandings. We define these key terms as follows:<br />
ENERGY DESCENT: The irreversible decline <strong>of</strong> net energy available and the<br />
accompanying transition from a high to a low fossil fuel use community. 22<br />
RESILIENCE: The ability <strong>of</strong> an ecosystem – from an individual to a whole community – to<br />
maintain its integrity and ability to function in the face <strong>of</strong> change and shocks from the<br />
outside. Resilient systems can roll with external changes and adapt as needed.<br />
PROSPERITY: Our ability to flourish as individuals and as a community under energy<br />
constraints and within ecological limits <strong>of</strong> the planet. “Prosperity is about things going well<br />
for us – in accordance with (pro‐in the Latin) our hopes and expectations (speres)… But<br />
prosperity is not synonymous with income or wealth.” 23<br />
This <strong>Report</strong> is intended to be a guiding document; it is advisory in nature. The <strong>Task</strong> <strong>Force</strong><br />
makes no claim that our recommendations provide all the answers; indeed, we hope and<br />
expect that the community will have numerous innovative ideas to add. However, we do<br />
think that the ideas we propose here provide a good start.<br />
Certainly, preparing for peak oil presents our community with unprecedented challenges.<br />
However, it also presents us with unprecedented opportunity. While the recommendations<br />
that follow are primarily aimed at “powering down” our energy consumption, they also<br />
promise non‐energy benefits such as reduced environmental impacts, greater savings for<br />
residents, improved quality <strong>of</strong> life and greater interaction among community members.<br />
Indeed, while individual preparation for peak oil is certainly important, the greatest way to<br />
prepare for peak is to work together toward a community solution. <strong>Peak</strong> oil presents us<br />
with an opportunity to make a great community even better.<br />
22 “What Exactly IS Energy Descent?” Transition Culture, http://transitionculture.org/2006/05/02/what‐exactly‐is‐<br />
energy‐descent/.<br />
23 Tim Jackson, Prosperity Without Growth? The Transition to a Sustainable Economy (s.l.: [U.K.] Sustainable<br />
Development Commission, Mar. 2009), http://www.sd‐<br />
commission.org.uk/publications/downloads/prosperity_without_growth_report.pdf, 16<br />
<strong>Report</strong> <strong>of</strong> the <strong>Bloomington</strong> <strong>Peak</strong> <strong>Oil</strong> <strong>Task</strong> <strong>Force</strong><br />
16
NEXT STEPS<br />
This <strong>Report</strong> outlines a number <strong>of</strong> recommendations that call upon the <strong>City</strong> to act. Some<br />
recommendations are relatively simple and can be implemented in the near term; others<br />
are considerably more complex and call upon the <strong>City</strong> to explore the issue further in the<br />
interest <strong>of</strong> realizing a long‐term goal. Many <strong>of</strong> the suggestions call for action by <strong>City</strong><br />
departments and require the expertise <strong>of</strong> <strong>City</strong> staff. A team <strong>of</strong> <strong>City</strong> staff should be charged<br />
with addressing the <strong>Task</strong> <strong>Force</strong>’s proposals. The team might wish to delegate some ideas to<br />
<strong>City</strong> entities whose missions align, in part, with those <strong>of</strong> the <strong>Task</strong> <strong>Force</strong>, such as the <strong>City</strong> <strong>of</strong><br />
<strong>Bloomington</strong> Commission on Sustainability (BCOS), the <strong>City</strong>’s new Sustainability Director,<br />
the Environmental Commission, and Team Process. We leave it up to the best judgment <strong>of</strong><br />
the <strong>City</strong> Administration (with feedback from the <strong>City</strong> Council) how to build such a team.<br />
<strong>Report</strong> <strong>of</strong> the <strong>Bloomington</strong> <strong>Peak</strong> <strong>Oil</strong> <strong>Task</strong> <strong>Force</strong><br />
17
AN EXAMINATION OF COMMUNITY SYSTEMS
THE ECONOMIC CONTEXT<br />
The enormous expansion <strong>of</strong> the human population and the economies <strong>of</strong> the United <strong>State</strong>s and<br />
many other nations in the past 100 years have been accomplished by, and allowed by, a<br />
commensurate expansion in the use <strong>of</strong> fossil (old) fuels, meaning coal, oil, and natural gas. To<br />
many energy analysts the expansion <strong>of</strong> cheap fuel energy has been the principal enabler <strong>of</strong><br />
economic expansion, far more important than business acumen, economic policy, or ideology.<br />
– Charles A.S. Hall, Robert Powers and William Schoenberg 24<br />
As this <strong>Report</strong> is being written, the most serious global recession since World War II has<br />
been under way for over a year. While the severity and duration <strong>of</strong> the recession may<br />
include factors that are not directly connected to the peak oil phenomenon, some observers<br />
attribute the economic crisis to the rapid escalation <strong>of</strong> oil prices over the last decade – an<br />
escalation that reached an unprecedented high in the summer <strong>of</strong> 2008.<br />
As is commonly understood, the current crisis was largely triggered by the collapse <strong>of</strong> the<br />
sub‐prime mortgage market. However, what is less understood is the link between oil and<br />
the housing market. It is very possible that the trend <strong>of</strong> ever‐increasing energy costs from<br />
2004‐2008 caused the housing bubble to burst.<br />
24 Charles A.S. Hall et al.,“<strong>Peak</strong> <strong>Oil</strong>, EROI, Investments and the Economy in an Uncertain Future,” in Pimentel,<br />
ed., Bi<strong>of</strong>uels, Solar and Wind as Renewable Energy Systems: Benefits and Risks, David Pimentel, ed. (New York:<br />
Springer, 2008), 110.<br />
<strong>Report</strong> <strong>of</strong> the <strong>Bloomington</strong> <strong>Peak</strong> <strong>Oil</strong> <strong>Task</strong> <strong>Force</strong><br />
18
Indeed, this run‐up occasioned energy prices to occupy a percentage <strong>of</strong> the Gross Domestic<br />
Product (GDP) not seen since 1985:<br />
Source: Charles A.S. Hall, “Economic Implications <strong>of</strong> Changing EROI Ratios,” presentation to the Association for the Study <strong>of</strong><br />
<strong>Peak</strong> <strong>Oil</strong> and Gas, Barcelona, Spain, October 2008.<br />
This thesis is explored most thoroughly by economist Jeff Rubin. Rubin asserts that oil<br />
price increases were behind four <strong>of</strong> the last five global recessions, including the present<br />
one. He writes:<br />
From January 2004 to January 2006, the rise in oil prices from $35 to $68 per barrel<br />
drove energy inflation, as measured in the US consumer price index, from less than 1<br />
percent measured year over to year to as high as 35 percent. Together with an<br />
associated increase in food prices … soaring energy costs drove the overall consumer<br />
price inflation rate from below 2 percent to almost 6 percent during the summer <strong>of</strong><br />
2008, reaching its highest mark since the 1991 oil shock. You don’t have to be a Nobel<br />
Prize‐winning economist to figure out what happened to interest rates over that period.<br />
As soaring oil prices stoked inflation’s flame, the federal funds rate began a relentless<br />
climb from a record low <strong>of</strong> 1 percent to over 5 percent by 2007. And rates stayed by<br />
and large at that level for another year until the economy rolled over into recession. But<br />
just as interest rates were starting to catch up with inflation, a mountain <strong>of</strong> subprime<br />
mortgages came due for refinancing. Not only was the interest‐free teaser period about<br />
to end, but the interest rates that subprime mortgage holders would now have to start<br />
paying are almost double the rates when they first got the mortgages. The rest is<br />
history. 25<br />
25 Jeff Rubin, Why Your World is About to Get a Whole Lot Smaller: <strong>Oil</strong> and the End <strong>of</strong> Globalization (New York:<br />
Random House, 2009), 190.<br />
<strong>Report</strong> <strong>of</strong> the <strong>Bloomington</strong> <strong>Peak</strong> <strong>Oil</strong> <strong>Task</strong> <strong>Force</strong><br />
19
Inflation and Volatility<br />
It will be difficult to predict the effect <strong>of</strong> peak oil<br />
on prices. As Rubin suggests, the natural effect<br />
<strong>of</strong> petroleum shortages would be to cause<br />
inflation. The primary cause <strong>of</strong> inflation in such<br />
an environment would be an increase in the<br />
price <strong>of</strong> oil.<br />
And, as discussed in the Transportation chapter,<br />
a significant increase in the cost <strong>of</strong> fuel will<br />
stress the budgets <strong>of</strong> households reliant on<br />
personal vehicles and will have an especially<br />
regressive effect on the community’s lowest wage earners. Similarly, the cost <strong>of</strong> products<br />
will likely rise for at least two reasons. First, many products (plastics, aspirin and clothing,<br />
to name a few) are reliant on oil as a key input. Second, as <strong>Bloomington</strong> imports most <strong>of</strong><br />
the products it consumes, as the cost <strong>of</strong> transporting goods to the community increases, so<br />
too will product prices escalate.<br />
<strong>Report</strong> <strong>of</strong> the <strong>Bloomington</strong> <strong>Peak</strong> <strong>Oil</strong> <strong>Task</strong> <strong>Force</strong><br />
Source: Clayton Guiltner, blog entry, Apr. 22, 2008<br />
A period <strong>of</strong> inflation, accompanied by slow or negative economic growth, would represent a<br />
return to the so‐called “stagflation” <strong>of</strong> the 1970s and early 1980s. There were two major<br />
periods <strong>of</strong> inflation during this time. The first, during 1973‐74, arose from the “first oil<br />
shock” caused by the OPEC oil embargo that resulted from the 1973 Arab‐Israeli War. It<br />
saw the rate <strong>of</strong> inflation increase from an annual rate <strong>of</strong> 3.63 percent in January 1973 to a<br />
high <strong>of</strong> 11.80 percent in January 1975. Inflation declined somewhat thereafter, falling to a<br />
low <strong>of</strong> 4.86 percent in December 1976 before beginning to rise again. It shot up in a major<br />
way following the “second oil shock” resulting from political events in Iran in 1978‐79. In<br />
November 1978, Iranian oil workers reduced output from 6 million barrels per day to 1.5<br />
barrels per day. The inflation rate in the United <strong>State</strong>s rose from 8.89 percent in<br />
November 1978 to 14.76 percent in March 1980. It remained as high as 10.14 percent in<br />
October 1981. Meanwhile, GDP actually declined in 1973 and 1974, and again in 1982.<br />
20
However, inflation is just one part <strong>of</strong> the picture. As prices increase, demand decreases,<br />
triggering lower prices. Lower prices tend to encourage greater demand. Wild oscillations<br />
in demand could result in wild oscillations in gas prices.<br />
The fallout <strong>of</strong> the summer <strong>of</strong> 2008 is testament to this volatility: On July 11, 2008, the price<br />
<strong>of</strong> oil hit $147.29/barrel. Faced with record prices at the gasoline pump, motorists rapidly<br />
began to alter their behavior, cutting back on discretionary driving or resorting to public<br />
transportation. New gas guzzlers sat forlornly on auto dealers’ lots.<br />
Further figuring into demand destruction was the mortgage crisis that hit just a few weeks<br />
after the record oil price peak, triggering a global economic meltdown. <strong>Oil</strong> took a nosedive<br />
down to about $33/barrel in December 2008. Indeed, oil demand dropped by nearly 1.5<br />
million barrels a day since July 2008. 26 Six months after the December low, oil was once<br />
again inching its way above $70/barrel. In the teeth <strong>of</strong> the worst postwar recession on<br />
record, this doubling <strong>of</strong> oil prices in only six months is truly remarkable. The increasing<br />
likelihood <strong>of</strong> ever‐more volatile oil prices is widely recognized. The United <strong>State</strong>s<br />
Government Accounting Office (GAO) reports that energy markets will become increasingly<br />
volatile, making supply disruptions more likely. 27<br />
26 Jad Mouawad, “One Year After <strong>Oil</strong>’s Price <strong>Peak</strong>: Volatility,” New York Times, July 10, 2009, Green Inc.<br />
http://greeninc.blogs.nytimes.com/2009/07/10/one‐year‐after‐oils‐price‐peak‐<br />
volatility/?scp=1&sq=one%20year%20after%20oil's%20price%20peak&st=cse<br />
27 “Crude <strong>Oil</strong>: Uncertainty about Future <strong>Oil</strong> Supply Makes It Important to Develop a Strategy for Addressing<br />
the <strong>Peak</strong> and Decline <strong>of</strong> <strong>Oil</strong> Production,” GAO‐07‐283, February 2007,<br />
http://www.gao.gov/new.items/d07283.pdf<br />
<strong>Report</strong> <strong>of</strong> the <strong>Bloomington</strong> <strong>Peak</strong> <strong>Oil</strong> <strong>Task</strong> <strong>Force</strong><br />
21
Daily changes in the spot price <strong>of</strong> crude oil, 1983‐2009. Source: International Monetary Fund, Bloomberg as<br />
cited in the New York Times, July 10, 2009. 28<br />
Some observers might see the rapid fall <strong>of</strong> oil prices in the latter half <strong>of</strong> 2008 as pro<strong>of</strong> that<br />
the theory <strong>of</strong> peak oil has been falsified, but we believe they are wrong. It is hard to know<br />
how long the current recession will last. However, if the recession begins to lift soon, oil<br />
consumption will once again begin to accelerate. Then rising demand could collide with<br />
falling production, triggering another rapid run‐up in oil prices and possibly bringing about<br />
another recession soon after the current one ends. However, if the recession is prolonged<br />
(for, say, another five or even ten years), then oil production could fall below even that<br />
required to meet depressed demand. In that case, rising oil prices could prolong the<br />
recession still further. At that point, if not before, the world will probably begin to sit up<br />
and take notice that the Age <strong>of</strong> <strong>Oil</strong> is coming to its inevitable end. By the end <strong>of</strong> the present<br />
century, if not before, most <strong>of</strong> the energy that is now being produced to fuel our vehicles<br />
and charge our electrical grid will have to come from renewable resources.<br />
28 Ibid.<br />
<strong>Report</strong> <strong>of</strong> the <strong>Bloomington</strong> <strong>Peak</strong> <strong>Oil</strong> <strong>Task</strong> <strong>Force</strong><br />
22
VULNERABILITIES<br />
1. Systemic reliance.<br />
As pointed out in the Introduction, crude oil is the lifeblood <strong>of</strong> our culture and society.<br />
From transportation to food to ubiquitous plastic products, everything hinges on oil.<br />
Thanks to this dependency, few <strong>of</strong> us have control over basic necessities <strong>of</strong> life. As a<br />
community, we are very vulnerable to a decline in cheap oil.<br />
2. New competitors for energy resources.<br />
When the United <strong>State</strong>s was on the upward slope <strong>of</strong> Hubbert's Curve, there were many<br />
populous countries in the world that consumed relatively little petroleum per capita. Now<br />
some <strong>of</strong> those countries – particularly China and India – are developing and motorizing<br />
rapidly. As a result, on the downward slope <strong>of</strong> the curve, Americans will have formidable<br />
new competitors for the world's remaining supplies <strong>of</strong> petroleum and other fossil fuels.<br />
3. Financial chaos.<br />
The current financial crisis will continue to make it difficult to mobilize the resources<br />
necessary either to maintain the current level <strong>of</strong> oil production or to continue the migration<br />
to a post‐petroleum economy. The development <strong>of</strong> new oil fields, which are <strong>of</strong>ten in<br />
challenging environments and therefore very costly, has been slowed or postponed. The<br />
development <strong>of</strong> major renewable energy projects has likewise been delayed or postponed.<br />
4. A finite Earth cannot support infinite growth.<br />
This is a point that seems simple enough to grasp, but it tends to get lost in our well‐<br />
intended efforts to produce and consume more. This point is also one long championed by<br />
ecological economists, specifically Herman Daly. Daly struggled to communicate the idea <strong>of</strong><br />
ecological constraint to the World Bank, where he worked in the late 1980s and early<br />
1990s.<br />
<strong>Report</strong> <strong>of</strong> the <strong>Bloomington</strong> <strong>Peak</strong> <strong>Oil</strong> <strong>Task</strong> <strong>Force</strong><br />
23
Daly writes:<br />
That was when I realized that economists have not grasped a simple fact that to scientists is<br />
obvious: the size <strong>of</strong> the Earth as a whole is fixed. Neither the surface nor the mass <strong>of</strong> the<br />
planet is growing or shrinking. The same is true for energy budgets: the amount absorbed<br />
by the Earth is equal to the amount it radiates. The overall size <strong>of</strong> the system – the amount<br />
<strong>of</strong> water, land, air, minerals and other resources present on the planet we live on – is fixed.<br />
The most important change on earth in recent times has been the enormous growth <strong>of</strong> the<br />
economy, which has taken over an ever greater share <strong>of</strong> the planet’s resources. In my<br />
lifetime, world population has tripled, while the numbers <strong>of</strong> livestock, cars, houses and<br />
refrigerators have increased by vastly more. In fact, our economy is now reaching the point<br />
where it is outstripping Earth’s ability to sustain it. Resources are running out and waste<br />
sinks are becoming full. The remaining natural world can no longer support the existing<br />
economy, much less one that continues to expand. 29<br />
Clearly, the energy budget <strong>of</strong> the Earth is fixed. For more than 200 years we have been<br />
increasingly able to exceed that budget by drawing down non‐renewable fossil fuel<br />
resources created by ancient sunlight tens or hundreds <strong>of</strong> millions <strong>of</strong> years ago. However,<br />
this sort <strong>of</strong> consumption cannot go on for another 200 years.<br />
Since 1929, U.S. GDP has grown by 3.4 percent per year. 30 Even if we replace petroleum<br />
reliance with renewable energy, it would be a considerable challenge to sustain an<br />
economy the size <strong>of</strong> the one we have now. Assuming that GDP increases by 3 percent per<br />
year, the nature <strong>of</strong> exponential growth suggests that by the year 2100 the economy would<br />
be 14 times as large as the one we have now. And if 3 percent annual growth required the<br />
consumption <strong>of</strong> 2 percent more primary energy per year to achieve, then by 2100 our<br />
economy would require almost 6 times as much energy as it does now. It is highly unlikely<br />
that such a scenario is achievable.<br />
What if a 2 percent growth rate in energy consumption is extended out to a period <strong>of</strong> a<br />
thousand years? In that case, annual energy consumption would have to be at a level<br />
398,264,652 times as high as it was a thousand years earlier. This is an obvious absurdity,<br />
29 Herman Daly, Special <strong>Report</strong>: Economics Blind Spot is a Disaster for the Planet, 15 Oct. 2008,<br />
http://www.newscientist.com/article/mg20026786.300‐special‐report‐economics‐blind‐spot‐is‐a‐disaster‐<br />
for‐the‐planet.html?page=2<br />
30 Bureau <strong>of</strong> Economic Analysis, Comprehensive Revision <strong>of</strong> the National Income and Product Accounts: 1929<br />
Through First Quarter 2009 (July 2009).<br />
<strong>Report</strong> <strong>of</strong> the <strong>Bloomington</strong> <strong>Peak</strong> <strong>Oil</strong> <strong>Task</strong> <strong>Force</strong><br />
24
and it is clear that it simply will not be possible to supply enough energy to increase energy<br />
consumption by a factor <strong>of</strong> almost four hundred million using only the resources available<br />
on and to a finite planet.<br />
The argument is not fundamentally changed even if we assume that we manage to increase<br />
the energy efficiency <strong>of</strong> the economy so that we cut the amount <strong>of</strong> additional energy<br />
required per unit <strong>of</strong> GDP growth in half. Suppose that, in order to support annual GDP<br />
growth <strong>of</strong> 3 percent, primary energy consumption only needed to increase 1 percent<br />
instead <strong>of</strong> 2 percent. In that case, we would need to consume 1.1 times as much energy per<br />
year in ten years as we do today, 2.7 times as much in a hundred years, and 20,959 times in<br />
a thousand years. While 20,959 is a lot less than 398,264,652, it is almost as absurd to<br />
imagine that we could increase our consumption (and production) <strong>of</strong> energy by a factor <strong>of</strong><br />
20,959 in a thousand years as it is to imagine that we could increase it by a factor <strong>of</strong><br />
398,264,652. In recent decades, economic growth and energy consumption have been<br />
relatively “decoupled,” which means that the amount <strong>of</strong> additional energy required per unit<br />
<strong>of</strong> growth has decreased. However, in order for economic growth to continue in perpetuity,<br />
it would have to be the case that growth and energy consumption can be absolutely<br />
decoupled. This seems wildly implausible.<br />
Better, Not Bigger<br />
The economic problems caused by peaking oil, coal, and natural gas production will<br />
eventually begin to call into question, in a much more obvious way than previously,<br />
conventional notions <strong>of</strong> “growth.” It is commonly assumed that an increase in the<br />
production and consumption <strong>of</strong> goods is associated with a higher quality <strong>of</strong> life. <strong>Peak</strong><br />
energy will call into the idea that quality <strong>of</strong> life and economic health are necessarily tied to<br />
more. A “growth economy” is typically characterized by an increasing GDP. However, a<br />
growing GDP does not necessarily imply a comparable improvement in quality <strong>of</strong> life, as it<br />
does not account for income distribution, social factors such as health, and ecological<br />
factors – not least <strong>of</strong> which is energy scarcity. It is possible to have a "prosperous" economy<br />
which is not based on perpetually rising production and consumption. In other words,<br />
<strong>Report</strong> <strong>of</strong> the <strong>Bloomington</strong> <strong>Peak</strong> <strong>Oil</strong> <strong>Task</strong> <strong>Force</strong><br />
25
instead <strong>of</strong> the old notion that “bigger is better,” peak will require us to focus more closely<br />
on “better, not bigger.” 31<br />
To be sure, the <strong>City</strong> <strong>of</strong> <strong>Bloomington</strong> has already taken forward‐thinking steps to foster<br />
thoughtful economic vitality. The <strong>City</strong>’s Department <strong>of</strong> Economic and Sustainable<br />
Development states that, “[l]ocal government must take the lead in envisioning and<br />
creating a thriving community, identified by the health <strong>of</strong> its environment, the vitality <strong>of</strong> its<br />
economy and the equity among its citizens.” 32<br />
In a post‐peak community, it makes sense to work toward a steady‐state economy.<br />
Importantly, steady state does not mean stagnation or plateau; instead it means that the<br />
amount <strong>of</strong> resource throughput and waste disposal remain relatively constant. The key<br />
features <strong>of</strong> such an economy are: (1) sustainable scale, in which economic activities fit<br />
within the capacity provided by ecosystems; (2) fair distribution <strong>of</strong> wealth; and (3) efficient<br />
allocation <strong>of</strong> resources. 33 Toward this end, we echo the resolution <strong>of</strong> the <strong>Bloomington</strong><br />
Environmental Commission:<br />
A sustainable economy (that is, an economy with a relatively stable, mildly<br />
fluctuating product <strong>of</strong> population and per capita consumption) is a viable<br />
alternative to a growing economy and has become a more appropriate goal<br />
for the U.S. and other large, wealthy economies. A long‐run sustainable<br />
economy requires its establishment at a size small enough to avoid the<br />
breaching <strong>of</strong> ecological and economic capacity (especially during supply<br />
shocks such as droughts and energy shortages), to promote the efficient use<br />
<strong>of</strong> energy, materials and water, and enable an accelerated shift toward the<br />
use <strong>of</strong> renewable energy resources. 34<br />
31 To borrow from Eben Fodor who borrowed from Edward Abbey. See, Eben Fodor, Better, Not Bigger: How<br />
to Take Control <strong>of</strong> Urban Growth and Improve Your Community (Gabriola Island, BC: New Society Publishers,<br />
1999).<br />
32 <strong>City</strong> <strong>of</strong> <strong>Bloomington</strong>, Department <strong>of</strong> Economic and Sustainable Development, Business and Sustainability<br />
site: http://bloomington.in.gov/sections/viewSection.php?section_id=6<br />
33 Center for the Advancement <strong>of</strong> the Steady <strong>State</strong> Economy, http://www.steadystate.org/CASSEBasics.html<br />
34 Position <strong>of</strong> the <strong>City</strong> <strong>of</strong> <strong>Bloomington</strong> Environmental Commission on Economic Growth in the United <strong>State</strong>s,<br />
adopted on May 22, 2008 following two years <strong>of</strong> discussion.<br />
http://bloomington.in.gov/media/media/application/pdf/3465.pdf.<br />
<strong>Report</strong> <strong>of</strong> the <strong>Bloomington</strong> <strong>Peak</strong> <strong>Oil</strong> <strong>Task</strong> <strong>Force</strong><br />
26
From Global Problems to Homegrown Solutions<br />
The <strong>Bloomington</strong> economy is clearly woven into the fabric <strong>of</strong> both the national and global<br />
economies. The food we eat, the clothes we wear, and the tools we use to fix our homes<br />
and tend our gardens are almost exclusively imported from distant states, sometimes even<br />
distant countries. Getting these basic goods to our community exacts a heavy<br />
transportation cost. While a protracted examination <strong>of</strong> the local <strong>Bloomington</strong>/Monroe<br />
County economy is beyond the scope <strong>of</strong> this <strong>Report</strong>, as the price <strong>of</strong> oil continues to become<br />
more volatile, we can anticipate the emergence <strong>of</strong> certain local economic threats. On the<br />
other hand, our community’s position as a college‐driven metro area will likely buffer some<br />
<strong>of</strong> the economic effects <strong>of</strong> peak oil. Traditionally, Monroe County has had one <strong>of</strong> the lowest<br />
unemployment rates in <strong>Indiana</strong>. In part, this is due to the presence <strong>of</strong> <strong>Indiana</strong> University.<br />
Higher Production and Distribution Costs<br />
Most local businesses rely on shipping in products for retail sale or raw materials for<br />
product manufacturing. As the cost <strong>of</strong> fuel becomes more expensive, these businesses will<br />
be hard hit. <strong>Bloomington</strong> businesses that buy or sell in national and global markets will<br />
have to contend with higher shipping costs. They may have to adopt new business<br />
strategies or may have to lay <strong>of</strong>f employees to compensate for higher costs.<br />
Less Discretionary Income<br />
If households have to spend more on energy, they will have less to spend on discretionary<br />
goods and services. Businesses such as restaurants and entertainment venues which rely<br />
on the discretionary spending <strong>of</strong> local residents or out‐<strong>of</strong>‐town visitors will be squeezed.<br />
<strong>Report</strong> <strong>of</strong> the <strong>Bloomington</strong> <strong>Peak</strong> <strong>Oil</strong> <strong>Task</strong> <strong>Force</strong><br />
27
Fuel Rationing<br />
As we collectively slide down the peak oil curve, motor fuels will become more scarce. As a<br />
result, fuel will be rationed. Rationing will either be imposed by the market in the form <strong>of</strong><br />
higher prices that drive out marginal consumers, or by the government by fiat. A<br />
combination <strong>of</strong> both forms <strong>of</strong> rationing is plausible.<br />
Despite the inconvenience, gasoline<br />
and diesel fuel rationing could have<br />
the benefit <strong>of</strong> permitting the allocation<br />
<strong>of</strong> fuel to priority users such as<br />
emergency first responders, urban<br />
transit systems, farmers, and truckers<br />
in adequate quantities or at below‐<br />
market prices, so that they could<br />
continue to operate despite<br />
budgetary constraints. At the same<br />
time, however, rationing would mean that others who still have the money to pay for fuel<br />
would not necessarily be able to buy as much as they want, whenever they want, and might<br />
have to curtail their consumption. While local government does not have any jurisdiction<br />
over rationing, we should anticipate that rationing may happen.<br />
<strong>Report</strong> <strong>of</strong> the <strong>Bloomington</strong> <strong>Peak</strong> <strong>Oil</strong> <strong>Task</strong> <strong>Force</strong><br />
Gasoline rationing was considered during the Second <strong>Oil</strong> Shock <strong>of</strong> 19781979.<br />
Ration coupons were printed, but never issued. Source: Wikimedia Commons<br />
28
Population growth and shifting demographics<br />
The population <strong>of</strong> <strong>Bloomington</strong> might grow or change as a result <strong>of</strong> peak oil. As is discussed<br />
in the Transportation chapter, Monroe County is a net importer <strong>of</strong> workers – almost 19<br />
percent <strong>of</strong> the workforce comes to Monroe County from surrounding counties to work.<br />
These commuters might move to <strong>Bloomington</strong> in order to avoid or reduce the cost <strong>of</strong> daily<br />
commuting. On the flip side, people who currently live in <strong>Bloomington</strong> but work elsewhere<br />
(about 7 percent) might move away for the same reason.<br />
Economic hardship could cause an increase in enrollment at <strong>Indiana</strong> University if residents<br />
lose their jobs and elect to return to school. On the other hand, hardship might instead<br />
mean declining enrollments at IU if parents and students are unable to afford tuition. If<br />
enrollment declines, the number <strong>of</strong> students living in the city might decline, resulting in a<br />
change in the mix <strong>of</strong> temporary to permanent residents in the city. Businesses catering<br />
particularly to the student population could be adversely affected.<br />
Changes in population size and mix could have unanticipated effects on housing demand.<br />
Housing demand might be reduced if economic adversity causes a reduction in the number<br />
<strong>of</strong> individual households, as people formerly living apart (such as adult children living<br />
apart from their parents) move in together in an attempt to save money.<br />
<strong>Report</strong> <strong>of</strong> the <strong>Bloomington</strong> <strong>Peak</strong> <strong>Oil</strong> <strong>Task</strong> <strong>Force</strong><br />
29
MITIGATION GOALS & STRATEGIES<br />
Following are some general steps we can collectively take to mitigate the economic effects<br />
<strong>of</strong> peak oil while fostering a healthy and prosperous post‐peak local economy.<br />
All <strong>of</strong> these steps are classified as “short‐term” simply because we need to take these steps<br />
very soon to mitigate the effects <strong>of</strong> peak oil. However, once instituted, the presumption is<br />
that these initiatives will only become stronger in the long term.<br />
SHORTTERM STRATEGIES (15 years)<br />
1. Promote economic relocalization.<br />
Rising petroleum prices will result in increasing costs for importing goods into the<br />
community from outside and for exporting goods from the community elsewhere. We<br />
should start to work now toward relocalization. Relocalization aims to build communities<br />
based on the local production <strong>of</strong> food, energy, and goods. That <strong>Bloomington</strong> must and will<br />
undergo a significant relocalization at some point is assumed in other sections <strong>of</strong> this<br />
<strong>Report</strong>, particularly the chapter on Sustenance. Because <strong>of</strong> this tendency, we think that<br />
<strong>Bloomington</strong> businesses which are able to replace distant suppliers with local and regional<br />
suppliers, and distant markets with local and regional markets, might ultimately tend to do<br />
better than businesses that are unable to manage such a transition. 35 As globalization is an<br />
energy‐intensive system <strong>of</strong> exchange and production, it is extremely vulnerable to high<br />
energy costs and shortages. Economic relocalization should be considered necessary for<br />
community economic security.<br />
35 It should be noted, however, that extreme price volatility might hamper efforts at relocalization as<br />
individuals or businesses encouraged to produce for the <strong>Bloomington</strong> market because <strong>of</strong> high transportation<br />
costs could suddenly find themselves priced out <strong>of</strong> that market very quickly if transportation costs plummet.<br />
Moreover, if government rationing or fuel allocation policies are introduced that give priority to freight<br />
transportation the cost <strong>of</strong> importing goods into <strong>Bloomington</strong> from elsewhere could remain low much longer<br />
than if no such priority exists.<br />
<strong>Report</strong> <strong>of</strong> the <strong>Bloomington</strong> <strong>Peak</strong> <strong>Oil</strong> <strong>Task</strong> <strong>Force</strong><br />
30
• Economic incentives.<br />
The <strong>City</strong> should leverage economic development incentives, such as a Business<br />
Incentive Loan Fund and tax abatements to further encourage the relocalization <strong>of</strong><br />
goods and services, especially those essential to daily life. 36<br />
• Foster a “buy local” campaign.<br />
Local government can help foster and expedite relocalization by actively promoting<br />
local businesses. The <strong>City</strong> <strong>of</strong> <strong>Bloomington</strong> has taken great strides to foster local<br />
purchasing by partnering with local stakeholders to launch a community‐wide I Buy<br />
<strong>Bloomington</strong> publicity campaign to be launched in the fall 2009. Such efforts to<br />
publicize the economic and pragmatic benefits <strong>of</strong> local purchasing are essential. We<br />
hope that such outreach strengthens existing local businesses and encourages new<br />
ones to form.<br />
• Encourage a Local Exchange Trading System (LETS).<br />
In thinking through ways to encourage more people to buy locally, the <strong>Task</strong> <strong>Force</strong><br />
examined the possibility <strong>of</strong> reinstituting a local currency. Local currency<br />
complements U.S.‐issued money but is a medium <strong>of</strong> exchange that could only be<br />
spent in <strong>Bloomington</strong>. This might tend to encourage local production. Local<br />
currencies have been used in other communities with mixed success. A previous<br />
attempt to introduce a local currency (BloomingHOURS) was unsuccessful.<br />
BloomingHOURS was introduced in August 1999; however, within a year the<br />
currency had gone out <strong>of</strong> circulation. Merchants were left with a stockpile <strong>of</strong><br />
currency that they could spend neither inside nor outside <strong>of</strong> the community. For a<br />
local currency to be successful in <strong>Bloomington</strong>, it would be important for<br />
government and other large institutions to back the system. For example, if the<br />
Utilities Department and <strong>Bloomington</strong> Transit accepted local currency, such support<br />
would substantially help strengthen such an alternative system.<br />
As local currencies tend to have mixed results, it would be prudent for the<br />
community to explore the idea <strong>of</strong> a Local Exchange Trading System (LETS) as a<br />
complement to conventional U.S. currency. LETS systems are local, non‐pr<strong>of</strong>it<br />
exchange networks in which goods and services can be traded without the need for<br />
printed currency. LETS networks use interest‐free local credit so direct swaps do<br />
not need to be made. For instance, a member may earn credit by doing childcare or<br />
computer work for one person and spend it later on carpentry with another person<br />
in the same network. This helps a wide cross section <strong>of</strong> the community –<br />
individuals, small businesses, local services and non‐pr<strong>of</strong>its – exchange local goods<br />
and services. 37<br />
36 See, <strong>City</strong> <strong>of</strong> <strong>Bloomington</strong>’s Business Incentives, http://bloomington.in.gov/sections/viewSection.php?section_id=418.<br />
37 See further, LETS Program: A Sustainable Local Economy, Relocalize.net<br />
http://www.relocalize.net/node/2194. However, a similar problem can occur with a LETS system as that<br />
which contributed to the demise <strong>of</strong> BloomingHOURS ‐‐ some people may accumulate a lot <strong>of</strong> credits but have<br />
no way to spend them.<br />
<strong>Report</strong> <strong>of</strong> the <strong>Bloomington</strong> <strong>Peak</strong> <strong>Oil</strong> <strong>Task</strong> <strong>Force</strong><br />
31
• Local government should collaborate with Transition <strong>Bloomington</strong><br />
Relocalization promises resilience and is gaining increasing momentum thanks to<br />
the growing “Transition Movement.” This movement seeks to equip communities<br />
for the twin challenges <strong>of</strong> climate change and peak oil. It aims to prepare cities and<br />
towns for a shift from oil dependence to local resilience. 38 Central to the Transition<br />
Movement is the idea that life without oil could be happier and more rewarding<br />
than a current oil‐dependent society. 39 Indeed, a recent New York Times article on<br />
the Transition Movement exclaimed, “The End is Near! (Yay!)” 40 while a popularizer<br />
<strong>of</strong> the Transition Movement, Rob Hopkins, has written that transition meets the<br />
threat <strong>of</strong> peak oil with a spirit <strong>of</strong> “elation, rather than the guilt, anger and horror”<br />
behind most environmental activism. “Change is inevitable, but this change could be<br />
fantastic.” 41<br />
The key tenet <strong>of</strong> the Transition Movement is that communities, especially in<br />
western, industrialized countries, lack “resilience,” defined as the ability to respond<br />
with adaptability to disturbance. The Transition Movement is predicated on four<br />
key assumptions:<br />
1) That life with dramatically lower energy consumption is inevitable, and that<br />
it’s better to plan for it than to be taken by surprise;<br />
2) That our settlements and communities presently lack the resilience to enable<br />
them to weather the severe energy shocks that will accompany peak oil;<br />
3) That we have to act collectively, and we have to act now; and<br />
4) That by unleashing the collective genius <strong>of</strong> those around us to creatively and<br />
proactively design our energy descent, we can build ways <strong>of</strong> living that are<br />
more connected, more enriching and recognize the biological limits <strong>of</strong> our<br />
planet. 42<br />
A local Transition group has recently formed in our own community – Transition<br />
<strong>Bloomington</strong>. 43 The local government should partner with Transition <strong>Bloomington</strong><br />
to work toward a cooperative post‐carbon future.<br />
38 Rob Hopkins, The Transition Handbook: From <strong>Oil</strong> Dependency to Local Resilience (Totnes, Devon: Green<br />
Books Ltd., 2008), 54.<br />
39 Rob Hopkins and Lipman, P., Who We Are and What We Do, version 1.0 (01 February 2009).<br />
40 Jon Mooallem, The End is Near! (Yay!), New York Times, April 19, 2009,<br />
http://www.nytimes.com/2009/04/19/magazine/19town‐t.html?_r=1&scp=1&sq=the%20end%20is%20near&st=cse<br />
41 Ibid.<br />
42 Ibid., 172<br />
43 http://transitionus.ning.com/group/transitionbloomington<br />
<strong>Report</strong> <strong>of</strong> the <strong>Bloomington</strong> <strong>Peak</strong> <strong>Oil</strong> <strong>Task</strong> <strong>Force</strong><br />
32
2. Examine sector dependency on oil.<br />
Leaders from the <strong>Bloomington</strong> Economic Development Corporation, The <strong>City</strong> <strong>of</strong><br />
<strong>Bloomington</strong>’s Economic and Sustainable Development Office and the Greater <strong>Bloomington</strong><br />
Chamber <strong>of</strong> Commerce met with members <strong>of</strong> the <strong>Bloomington</strong> <strong>Peak</strong> <strong>Oil</strong> <strong>Task</strong> <strong>Force</strong> to<br />
discuss the relationship between peak oil and the local economy. It is clear that leaders are<br />
committed to improving the quality <strong>of</strong> life for <strong>Bloomington</strong> residents. However, it is also<br />
clear that these leading economic development entities have not looked specifically at the<br />
local economic vulnerabilities posed by peak oil. As the specific economic effects <strong>of</strong> peak<br />
are both difficult to predict and beyond the scope <strong>of</strong> this <strong>Report</strong>, we recommend that local<br />
economic development entities engage in an analysis <strong>of</strong> the extent to which our<br />
community’s biggest employers are dependent on petroleum for their business. As is<br />
discussed in the Sustenance chapter, we know that the health care industry is intimately<br />
tied to oil. What about IU? What <strong>of</strong> the other industries the community aims to strengthen:<br />
biotechnology, technology, life sciences, and the arts? Local government and its community<br />
partners should work to identify the ways in which peak oil will affect:<br />
• Production and distribution cost;<br />
• Consumer demand;<br />
• Suppliers <strong>of</strong> raw materials and semi‐processed goods; and<br />
• Embodied energy required for products and services.<br />
3. Prepare the tourism industry for peak oil.<br />
<strong>Bloomington</strong> has positioned itself as a premiere<br />
cultural, arts, entertainment, and recreational<br />
destination for residents and visitors. In an<br />
environment where fuel is costly, it is likely that<br />
tourist destinations close to home could become<br />
more popular, and <strong>Bloomington</strong>'s tourism<br />
industry could benefit from a relocalization <strong>of</strong><br />
travel. There are three major population centers (<strong>Indiana</strong>polis, Louisville, and Evansville)<br />
near <strong>Bloomington</strong>. Having bus or rail transportation links to those centers would further<br />
enhance the position <strong>of</strong> <strong>Bloomington</strong> as a tourist destination. Having improved local<br />
<strong>Report</strong> <strong>of</strong> the <strong>Bloomington</strong> <strong>Peak</strong> <strong>Oil</strong> <strong>Task</strong> <strong>Force</strong><br />
33
transit and pedestrian and biking facilities would help also. However, the possibility also<br />
exists that in an oil‐short world, people will be reluctant or unable to travel even to nearby<br />
tourist attractions.<br />
4. Commit to a steady state economy.<br />
A steady state economy is one in which the level <strong>of</strong> production and consumption remains<br />
relatively constant. It is one in which the goal <strong>of</strong> having more stuff is replaced by the goal<br />
<strong>of</strong> having an improved quality <strong>of</strong> life.<br />
The notion <strong>of</strong> a steady state economy is likely to be resisted by many people. However, a<br />
debate over whether such an economy is "good" or "bad" would be pointless. We do not<br />
take the position that a steady state economy is preferable to a growth economy. Rather,<br />
we take the position that a growth economy will soon simply no longer be possible.<br />
Considering the two remaining alternatives – a steady state economy, or an economy in a<br />
continual state <strong>of</strong> crisis and collapse – the steady state is clearly preferable.<br />
5. Develop and deploy alternative forms <strong>of</strong> energy.<br />
With global peak energy perhaps as little as a couple <strong>of</strong> decades away, the world and the<br />
nation will need to take immediate steps to manage it. Because peak energy will occur as a<br />
result <strong>of</strong> production constraints <strong>of</strong> various non‐renewable<br />
sources <strong>of</strong> energy, attempting to solve the problem <strong>of</strong> peak<br />
energy by substituting some forms <strong>of</strong> non‐renewable energy<br />
(e.g. natural gas) for others (e.g. petroleum) is a temporary but<br />
not a permanent solution. While a detailed examination <strong>of</strong><br />
possible forms <strong>of</strong> alternative energy is beyond the scope <strong>of</strong> this<br />
<strong>Report</strong>, local government should work with public, private<br />
entities, and other stakeholders to encourage and provide<br />
incentives for sustainable forms <strong>of</strong> energy. 44<br />
<strong>Report</strong> <strong>of</strong> the <strong>Bloomington</strong> <strong>Peak</strong> <strong>Oil</strong> <strong>Task</strong> <strong>Force</strong><br />
Source: www.globalwarming.house.gov<br />
44 The <strong>City</strong>’s zoning law, The Unified Development Ordinance, contains incentives for developers to integrate<br />
alternative energy into their projects. However, to date, these incentives are seldom engaged.<br />
34
6. Vigorously promote green jobs.<br />
As one <strong>of</strong> its key economic development strategies, the <strong>City</strong> <strong>of</strong> <strong>Bloomington</strong> has expressed<br />
its intent to position <strong>Bloomington</strong> as a “green capital <strong>of</strong> the Midwest.” 45 While it is difficult<br />
to predict exactly what the post‐peak employment environment will look like, we can<br />
anticipate that we will experience a “greening” <strong>of</strong> employment as the economy becomes<br />
less dependent on fossil fuels and more dependent on renewable energy. Local<br />
government should partner with the public and private sectors to aggressively promote<br />
and provide incentives for business start‐ups and existing employers in sectors facilitating<br />
the transition from non‐renewable to renewable energy. It is at least equally important to<br />
promote those facilitating reductions in energy demand through conservation.<br />
The change in the employment pr<strong>of</strong>ile presented by peak oil represents both challenges<br />
and opportunities. Unfortunately, it is somewhat difficult to predict what the eventual<br />
employment mix might be, and even more difficult to predict the timing <strong>of</strong> any shift from<br />
one job mix to another. As previously noted, economic difficulties facing consumers could<br />
cause the supply <strong>of</strong> jobs in restaurants, entertainment, personal services, and “luxury”<br />
retail to shrink. This would be particularly problematic for the many <strong>Indiana</strong> University<br />
students who use such jobs to help pay their way through college. Thus, it is more than<br />
conceivable that a post‐peak economy could make it more financially difficult for students<br />
to attend <strong>Indiana</strong> University. A substantial decline in enrollments would adversely affect<br />
the city’s largest employer. Additionally, for employees in low‐paying jobs, the costs <strong>of</strong><br />
commuting a long distance may come to outweigh the economic benefits <strong>of</strong> employment.<br />
Thus, some jobs could go unfilled even as unemployment rises.<br />
In general, jobs in fields that are petroleum‐intensive will be in jeopardy. For example, the<br />
demand for long‐haul truck drivers could fall as more <strong>of</strong> the nation’s freight shifts from the<br />
roads to the more energy‐efficient railroads. As jet fuel becomes increasingly expensive,<br />
more airlines could be driven out <strong>of</strong> business, resulting in mass employee lay<strong>of</strong>fs.<br />
45 <strong>City</strong> <strong>of</strong> <strong>Bloomington</strong>, <strong>Indiana</strong>, Strategic Plan 20092010, 8. See, http://bloomington.in.gov/strategicplan<br />
<strong>Report</strong> <strong>of</strong> the <strong>Bloomington</strong> <strong>Peak</strong> <strong>Oil</strong> <strong>Task</strong> <strong>Force</strong><br />
35
On the other hand, there is probably considerable potential for new employment in “green<br />
jobs,” especially those related to the manufacture, installation, and maintenance <strong>of</strong> solar<br />
electric and solar thermal systems.<br />
According to the BlueGreen Alliance and the Natural Resources Defense Council, in a post‐<br />
peak environment, <strong>Indiana</strong> will need the following types <strong>of</strong> skilled workers:<br />
• Carpenters to make buildings more energy efficient;<br />
• Electricians for expanding mass transit solutions;<br />
• Operations managers to manufacture energy‐efficient automobiles;<br />
• Machinists to craft essential components <strong>of</strong> wind power; and<br />
• Welders for solar power manufacturing. 46<br />
To this list, we would add home and business energy efficiency specialists, appliance repair<br />
specialists, and farmers and agricultural workers. In the long run, should fuel shortages<br />
cause a breakdown in mechanized agriculture, a significant amount <strong>of</strong> additional labor<br />
could be required for food production.<br />
Green‐collar jobs require some new skills and some new thinking about old skills. The<br />
economic development community, in cooperation with local employers, Workforce<br />
Development, and local educational institutions, should identify specific skills called for to<br />
meet the demands <strong>of</strong> our economy during the period <strong>of</strong> energy descent, and should develop<br />
educational and training programs to teach those skills. Some <strong>of</strong> green jobs will be entirely<br />
local because they are in the service sector; while solar panels can be manufactured in<br />
China, we can't ship our houses to China to have the panels installed there. Green<br />
manufacturing jobs will have to compete in a marketplace that will remain theoretically<br />
global, but the rising cost <strong>of</strong> transportation may give local producers a competitive<br />
advantage that they currently lack. Green jobs must provide workers a living wage, and we<br />
must work toward creating a green‐collar environment that provides for a mix <strong>of</strong> entry and<br />
pr<strong>of</strong>essional‐level work.<br />
46 Job Opportunities in a Green Economy: <strong>Indiana</strong> Can Gain from Fighting Global Warming,<br />
http://www.nrdc.org/globalWarming/jobs/indiana.pdf; See also, Pollin and Wicks‐Lim, Job Opportunities for<br />
the Green Economy: <strong>State</strong>by<strong>State</strong> Picture <strong>of</strong> Occupations that Gain from Green Investment,<br />
http://www.bluegreenalliance.org/admin/publications/files/0005.4.pdf .<br />
<strong>Report</strong> <strong>of</strong> the <strong>Bloomington</strong> <strong>Peak</strong> <strong>Oil</strong> <strong>Task</strong> <strong>Force</strong><br />
36
<strong>Report</strong> <strong>of</strong> the <strong>Bloomington</strong> <strong>Peak</strong> <strong>Oil</strong> <strong>Task</strong> <strong>Force</strong><br />
MUNICIPAL SERVICES<br />
Identifying and mitigating community vulnerabilities is probably one <strong>of</strong> the more important – if<br />
<strong>of</strong>ten unwritten – expectations we have <strong>of</strong> our local governments. 47<br />
– Daniel Lerch, Post Carbon Cities<br />
Three challenges are converging to shape the way <strong>City</strong> Hall carries out its business <strong>of</strong><br />
protecting the health, safety, and welfare <strong>of</strong> the people <strong>of</strong> <strong>Bloomington</strong>: weaning the<br />
community from its dependence on oil, climate change, and the resultant uncertainties <strong>of</strong><br />
both. 48 These challenges present us with an unprecedented moment when it comes to the<br />
way the <strong>City</strong> carries out it duties. But it also provides us with opportunity. <strong>Peak</strong> oil<br />
requires that the <strong>City</strong> take a systemic look at its oil dependencies and match each<br />
dependency with greater conservation, greater efficiency, and renewable energy sources.<br />
To be sure, the <strong>City</strong> has already implemented some very forwarding‐thinking steps to<br />
reduce our reliance on petroleum:<br />
• The Mayor recently announced his Sustainable <strong>City</strong> Initiative whose mission is to<br />
“to promote economic vitality while improving the human condition and preserving<br />
the community character <strong>of</strong> our <strong>City</strong>. It operates on the principle that <strong>Bloomington</strong><br />
can achieve environmental health, economic prosperity and social justice through<br />
sustainable development;” 49<br />
• in 2005, the <strong>City</strong> shifted to a biodiesel‐only diesel purchasing policy;<br />
• in 2007, the <strong>City</strong> engaged in an energy audit <strong>of</strong> <strong>City</strong> Hall, the result <strong>of</strong> which was a<br />
series <strong>of</strong> HVAC upgrades resulting in monthly reductions in energy consumption by<br />
10‐15% and yielding a 32% savings – or $45,634.66 – within its first year;<br />
• the <strong>City</strong> has established an internal team to examine vehicle acquisition, energy<br />
consumption and purchasing policies;<br />
• the Office <strong>of</strong> the Mayor and the <strong>City</strong> <strong>of</strong> <strong>Bloomington</strong> Commission on Sustainability<br />
continue to actively promote the Change a Light, Change the World program, which<br />
encourages citizens to replace incandescent light bulbs with compact fluorescents<br />
(CFLs). The <strong>City</strong> has partnered with the local grocery cooperative Bloomingfoods to<br />
distribute over 40,000 bulbs, with a total estimated savings <strong>of</strong> $2.0 million over the<br />
life <strong>of</strong> these bulbs;<br />
47 Lerch, Daniel. Post Carbon Cities: Planning for Energy and Climate Uncertainty. A Guidebook on <strong>Peak</strong> <strong>Oil</strong> and<br />
Global Warming for Local Governments (Sebastopol: Post Carbon Press 2007), 4.<br />
48 Ibid. at v.<br />
49 http://bloomington.in.gov/sustainablecity<br />
37
• all <strong>City</strong> traffic signals have been retr<strong>of</strong>itted with light‐emitting diode (LED)<br />
technology;<br />
• the <strong>City</strong> recently passed a Green Building Ordinance calling for all occupiable <strong>City</strong><br />
structures to be brought up to LEED Silver standards, provided they meet a payback<br />
test;<br />
• Low‐flow, sensored faucets and fixtures have been installed at most occupied <strong>City</strong><br />
facilities;<br />
• The <strong>City</strong> has reduced its mowing frequency from once every 7‐10 days to twice per<br />
month and is experimenting with “no‐grow” or “low‐mow” grasses to reduce<br />
mowing. In addition, a number <strong>of</strong> naturalized lawn projects have been implemented<br />
on <strong>City</strong> property;<br />
• The <strong>City</strong>’s Environmental Commission and Sustainability Commission work very<br />
hard to foster policies that nurture environmental, social, and economic health and<br />
have issued critical reports on the city’s greenhouse gas emissions, environmental<br />
quality indicators, sustainability indicators and greenspace; 50<br />
• The <strong>City</strong> has been named Tree <strong>City</strong> USA for 24 consecutive years. The <strong>City</strong> nurtures<br />
more than 18,000 trees in the urban forest and thousands more in the <strong>City</strong>'s parks.<br />
These are laudable efforts. However, to mitigate the effects <strong>of</strong> peak oil, we need to do far<br />
more. Responding to peak oil, climate change, and energy uncertainty requires an across‐<br />
the‐board dedicated shift to reduced energy consumption and greater local production.<br />
In thinking through what the advent <strong>of</strong> peak oil means for the operation <strong>of</strong> government, it<br />
is important to keep in mind that the <strong>Task</strong> <strong>Force</strong> is not anticipating reduced or somehow<br />
compromised <strong>City</strong> services. To the contrary, the <strong>Task</strong> <strong>Force</strong> urges us to think through ways<br />
the <strong>City</strong> will fulfill its role <strong>of</strong> protecting community well‐being by being smart and creative<br />
about the ways we use and produce energy.<br />
50 <strong>City</strong> <strong>of</strong> <strong>Bloomington</strong> Environmental Commission & <strong>City</strong> <strong>of</strong> <strong>Bloomington</strong> Commission on Sustainability,<br />
Greenhouse Gas Inventory for the <strong>City</strong> <strong>of</strong> <strong>Bloomington</strong>, <strong>Indiana</strong>: Footprint, Projections, and Recommendations<br />
(May 2009) https://bloomington.in.gov/media/media/application/pdf/5047.pdf; <strong>City</strong> <strong>of</strong> <strong>Bloomington</strong><br />
Environmental Commission 2006 <strong>Bloomington</strong> Environmental Quality Indicator (BEQI) <strong>Report</strong>,<br />
http://bloomington.in.gov/beqi/; <strong>Bloomington</strong> Commission on Sustainability, <strong>Bloomington</strong> Sustainability<br />
Assessment <strong>Report</strong> (2008) http://bloomington.in.gov/media/media/application/pdf/4660.pdf; <strong>City</strong> <strong>of</strong><br />
<strong>Bloomington</strong> Environmental Commission, Greenspace Trends in <strong>Bloomington</strong>, <strong>Indiana</strong> 19932007,<br />
http://bloomington.in.gov/egov/docs/1196711026_93260.pdf<br />
<strong>Report</strong> <strong>of</strong> the <strong>Bloomington</strong> <strong>Peak</strong> <strong>Oil</strong> <strong>Task</strong> <strong>Force</strong><br />
38
VULNERABILITIES<br />
Of the many services the <strong>City</strong> provides, among the most critical are: the provision <strong>of</strong><br />
potable water, a sanitary sewer system, police and fire protection, and waste removal.<br />
These services are energy intensive. A decline in cheap oil exposes the following<br />
vulnerabilities:<br />
1. Direct Increase in Costs & Price Volatility<br />
As the price <strong>of</strong> oil both becomes more volatile and more expensive, so will the<br />
price <strong>of</strong> electricity, natural gas, and<br />
other energy resources. It will<br />
become more expensive for the <strong>City</strong><br />
to: treat and pump drinking water,<br />
treat its wastewater, provide fuel for<br />
law enforcement and fire protection,<br />
heat and cool municipal buildings,<br />
and pick up trash and recycling.<br />
2. Indirect Increase in Costs & Price<br />
Volatility<br />
Because energy is embedded in just about everything we do and purchase, it is<br />
expected that the <strong>City</strong> will also experience an increase in the cost <strong>of</strong> products in<br />
which oil and oil by‐products are used. Perhaps one <strong>of</strong> the most severe indirect<br />
impacts will be an increase in the cost <strong>of</strong> food as the cost <strong>of</strong> production and<br />
transportation increases.<br />
3. Everincreasing Energy Shortages and Outages<br />
As the supply <strong>of</strong> cheap oil continues to drop, we can expect greater oil scarcity<br />
and periods <strong>of</strong> blackouts and brownouts (when power is reduced). We must<br />
prepare the <strong>City</strong>’s storage, back‐up generation and primary energy generation<br />
systems for this shift. 51<br />
These vulnerabilities call for a plan that seeks to build resiliency into the <strong>City</strong><br />
infrastructure. The aim <strong>of</strong> this chapter is to map out an “energy descent” plan that meets<br />
the needs <strong>of</strong> the community efficiently and fairly. As this <strong>Report</strong> enters the community’s<br />
conversation, it is assumed – and expected – that both the <strong>City</strong> staff and residents will have<br />
even more ideas about how to plan for peak oil. The intent <strong>of</strong> this chapter is to get the<br />
conversation started.<br />
<strong>Report</strong> <strong>of</strong> the <strong>Bloomington</strong> <strong>Peak</strong> <strong>Oil</strong> <strong>Task</strong> <strong>Force</strong><br />
<strong>City</strong> Hall<br />
51 These three vulnerabilities are borrowed, in part, from those outlined by the Sebastopol Ad Hoc<br />
Citizens Advisory Group on Energy Vulnerability, Charting a Path for a New Energy Future for Sebastopol (2007).<br />
39
THIRSTY WATER: THE WATER SUPPLY<br />
Since the first cisterns were built on the Courthouse Square in 1860, the <strong>City</strong> has<br />
experienced water shortages caused by weather, lack <strong>of</strong> natural water supplies, and<br />
storage imbalances. However, present conditions pose another vulnerability: the grid.<br />
Water treatment requires electricity (a functioning grid) or back‐up electricity generation<br />
using diesel fuel. Without a steady supply <strong>of</strong> electricity or diesel fuel, the <strong>City</strong> will<br />
experience a significant reduction or suspension <strong>of</strong> water treatment services.<br />
That our current electrical grid is both aging and overloaded is well documented. Indeed,<br />
the U.S. National Power Grid received a “D+” by the American Society <strong>of</strong> Civil Engineers in<br />
2009. 52 <strong>Peak</strong> oil has immediate implications for the grid. First, in <strong>Indiana</strong>, the grid runs<br />
primarily on coal, and coal relies heavily on liquid fuels for its extraction. Secondly, the<br />
grid will be even more taxed as we start powering our cars, buses, and trains with<br />
electricity rather than oil, and start heating our homes, <strong>of</strong>fices, businesses, etc. with<br />
electricity rather than natural gas. 53 The grid might also experience more stress if people<br />
perceive electricity as bearing a significantly smaller carbon footprint than petroleum.<br />
However, fully 95 percent <strong>of</strong> <strong>Indiana</strong>’s electricity is generated by coal, while 5 percent is<br />
generated by natural gas. 54 The finite supply <strong>of</strong> <strong>Indiana</strong>’s coal is discussed in Appendix II.<br />
52 American Society <strong>of</strong> Civil Engineers, 2009 <strong>Report</strong> Card for America’s Infrastructure,<br />
http://www.infrastructurereportcard.org/sites/default/files/RC2009_full_report.pdf. It is also important to that the<br />
Society gave the U.S. Drinking Water Supply a grade <strong>of</strong> “D‐,” Wastewater a grade <strong>of</strong> “D‐,” and Dams a grade <strong>of</strong> “D.”<br />
53 See Appendix III for a discussion <strong>of</strong> the peaking <strong>of</strong> natural gas.<br />
54 Energy Information Administration. <strong>State</strong> Electricity Pr<strong>of</strong>ile: <strong>Indiana</strong><br />
http://tonto.eia.doe.gov/state/state_energy_pr<strong>of</strong>iles.cfm?sid=IN<br />
<strong>Report</strong> <strong>of</strong> the <strong>Bloomington</strong> <strong>Peak</strong> <strong>Oil</strong> <strong>Task</strong> <strong>Force</strong><br />
40
Water Supply<br />
The <strong>City</strong>’s water supply is sourced from Lake Monroe. Lake Monroe is located<br />
approximately seven miles southeast <strong>of</strong> <strong>Bloomington</strong> and has been in operation since 1966.<br />
Lake Monroe has been the <strong>City</strong>’s sole source <strong>of</strong><br />
treated water since the Griffy Lake Water<br />
Treatment Plant was retired from service in 1996.<br />
The <strong>City</strong> <strong>of</strong> <strong>Bloomington</strong> Utilities Department<br />
(CBU) provides for the treatment and distribution<br />
<strong>of</strong> the community’s water supply.<br />
Lake Monroe was constructed and is owned by<br />
the U.S. Army Corps <strong>of</strong> Engineers (USACE) and is<br />
managed by the <strong>Indiana</strong> Department <strong>of</strong> Natural Resources (IDNR). The lake is used for<br />
water supply, flood control, and recreation. Between the silt pool elevation <strong>of</strong> 515 feet (ft)<br />
above mean sea level (msl) and the flood control pool elevation <strong>of</strong> 538 ft msl, the reservoir<br />
will provide a total storage capacity <strong>of</strong> 159,900 acre feet. 55<br />
The <strong>City</strong> purchases raw water under an existing purchase agreement with IDNR for the<br />
Monroe Water Treatment Plant (WTP) for $33.00/million gallons. The <strong>City</strong> pumps an<br />
average <strong>of</strong> 16.1 million gallons <strong>of</strong> water per day. Its agreement with IDNR allows for the<br />
<strong>City</strong> to purchase water up to a limit <strong>of</strong> an annual average daily withdrawal <strong>of</strong> 24 million<br />
gallons per day. 56 The <strong>City</strong> has frequently come close to this maximum withdrawal. In<br />
2006, the <strong>City</strong> received an “Early Warning Order” from the <strong>Indiana</strong> Department <strong>of</strong><br />
Environmental Management that the <strong>City</strong>’s highest daily pumpage, as reported over the<br />
previous two years, exceeds 90 percent <strong>of</strong> the system’s 24 million gallons‐per‐day<br />
capacity. 57<br />
55 The lake has a drainage area <strong>of</strong> 432 square miles, a spillway elevation <strong>of</strong> 556.0 ft, and a maximum water<br />
elevation <strong>of</strong> 556.2 ft msl recorded on May 15, 2002.<br />
56 Black & Veatch, Water Supply Evaluation, 4‐1 (2007).<br />
<strong>Report</strong> <strong>of</strong> the <strong>Bloomington</strong> <strong>Peak</strong> <strong>Oil</strong> <strong>Task</strong> <strong>Force</strong><br />
Lake Monroe Dam and Control Tower, Source: U.S. ACE<br />
57 The Order advised that a failure to implement any proposed improvements “is cause for imposing a<br />
connection ban on your system.”<br />
41
Water Treatment<br />
Treatment <strong>of</strong> water from Lake Monroe includes rapid mixing, sedimentation, filtration, and<br />
disinfection. The facility is connected to the <strong>Bloomington</strong> water distribution system by a<br />
single 36‐inch transmission main that conveys treated water approximately seven to eight<br />
miles from the plant to the <strong>City</strong>. In the event <strong>of</strong> a complete loss <strong>of</strong> electrical power, the <strong>City</strong><br />
can produce potable water at a rate <strong>of</strong> 12 million gallons per day provided that No. 2 diesel<br />
fuel can be replaced in the tanks for the standby engine generators. As stated in a<br />
commissioned evaluation <strong>of</strong> the <strong>City</strong>’s water supply, “Any interruption in service, either at<br />
the water treatment plant, along the transmission main, or with any <strong>of</strong> the critical ancillary<br />
water treatment facilities, for more than a few hours could result in a significant reduction<br />
or total suspension <strong>of</strong> water service to CBU's customers.” 58<br />
The <strong>City</strong> maintains two back‐up diesel generators: one at the Low Service Pump Station<br />
(on the shore <strong>of</strong> Lake Monroe) and one at the Monroe Water Treatment Plant (about one<br />
half mile the Lake). Each generator has a 1,000 gallon fuel tank. The engine <strong>of</strong> each is rated<br />
to consume 57.8 gallons per hour under full load operating conditions. Therefore, 2,000<br />
gallons <strong>of</strong> fuel would be consumed in 17.3 hours if both engine generators were operating<br />
at full load conditions.<br />
The <strong>City</strong> currently maintains seven active water storage tanks and is requesting an<br />
additional tank. Under normal usage conditions, the seven active tanks provide<br />
approximately eight hours <strong>of</strong> capacity. A combined liquid fuels shortage and protracted<br />
grid failure would leave little buffer for <strong>City</strong> water users.<br />
58 Black & Veatch, Water Supply Evaluation, ES‐4 (2007).<br />
<strong>Report</strong> <strong>of</strong> the <strong>Bloomington</strong> <strong>Peak</strong> <strong>Oil</strong> <strong>Task</strong> <strong>Force</strong><br />
42
VULNERABILITIES<br />
Production <strong>of</strong> <strong>Bloomington</strong>’s water is energy intensive and produces a large quantity <strong>of</strong><br />
<strong>Bloomington</strong>’s greenhouse gas emissions. The treatment and pumping <strong>of</strong> water requires<br />
approximately one million kilowatt hours per month. This usage translates into a price tag<br />
<strong>of</strong> almost $60,000 per month. 59<br />
Grid vulnerability means two things. First, as oil becomes more costly, it is reasonable to<br />
anticipate that individuals and institutions will power their vehicles and heat their homes<br />
and other buildings with electricity. This will put increased strain on an aging grid and will<br />
trigger more frequent grid failure. Therefore, we must think through ways to provide<br />
water in light <strong>of</strong> a compromised grid. Secondly, we know that as the demand for electricity<br />
rises, so too will its price. It is only sound fiscal policy that we address ways in which we<br />
might lower the cost <strong>of</strong> treating water. Given the <strong>City</strong>’s commitment to reducing<br />
greenhouse gas emissions, any prudent remedy will not call for increased carbon<br />
emission. 60<br />
Lastly, <strong>Bloomington</strong>ians use a lot <strong>of</strong> water. Subtracting out the IU on‐campus housing<br />
population, <strong>Bloomington</strong> residents use an average <strong>of</strong> 85 gallons per capita per day. 61 In the<br />
U.S., typical domestic indoor per capita water use is 80‐100 gallons per capita per day; 62<br />
outdoor water use can increase that rate to as much as 165 gallons per day. 63 Meanwhile,<br />
the average (western, industrialized) European uses an average <strong>of</strong> 53 gallons per day. 64<br />
59 This energy is supplied by Duke Power primarily from coal combustion plants. Because <strong>of</strong> combustion inefficiencies<br />
and transmission line losses, an estimated 6,600 short tons <strong>of</strong> coal per year are burned to generate the power to treat and<br />
pump water to <strong>Bloomington</strong> area residents, resulting in carbon dioxide releases to the atmosphere <strong>of</strong> about 19,000 tons,<br />
or 1 lb. <strong>of</strong> CO2 for each 134 gallons <strong>of</strong> water treated and delivered.<br />
60 Mayor Kruzan has signed the Mayor’s Climate Protection Agreement and the <strong>City</strong> Council has endorsed ratification <strong>of</strong><br />
the Kyoto Protocol. See http://bloomington.in.gov/media/media/application/pdf/927.pdf<br />
61 Black & Veatch, Water Supply.<br />
62 U.S. E.P.A., National Performance Track, Water http://www.epa.gov/performancetrack/tools/wateruse.htm<br />
63 Christopher Kloss, U.S. E.P.A., Managing Wet Weather with Green Infrastructure: Municipal Handbook – Rainwater<br />
Harvesting Policies, EPA‐833‐F‐08‐010 (December 2008).<br />
64 Water Aid 2006.<br />
<strong>Report</strong> <strong>of</strong> the <strong>Bloomington</strong> <strong>Peak</strong> <strong>Oil</strong> <strong>Task</strong> <strong>Force</strong><br />
43
MITIGATION GOALS & STRATEGIES<br />
A commitment to smart water management involves comprehensive planning to meet the<br />
long‐term needs <strong>of</strong> the community joined with greater efficiencies and a strong<br />
conservation ethic.<br />
SHORTTERM STRATEGIES (15 years)<br />
1. Explore hybrid energy generation.<br />
While the Monroe Water Treatment plant enjoys some flexibility to scale down production,<br />
it does not have the capacity to run without power. Water production and treatment<br />
requires a continual input <strong>of</strong> power. The plant cannot be frequently completely shut down<br />
and then turned on again without negative consequences.<br />
Given the precarious state <strong>of</strong> the grid and the need for continuous power at the plant, the<br />
<strong>City</strong> should explore alternative energy options to supplement the water treatment plant’s<br />
energy supply. Specifically, the <strong>City</strong> should explore the possibility <strong>of</strong> installing a second<br />
layer <strong>of</strong> pumps powered by a combination <strong>of</strong> both solar energy and hydroelectricity from<br />
the Monroe Dam.<br />
At the request <strong>of</strong> the <strong>City</strong>’s Environmental Commission and some members <strong>of</strong> the <strong>City</strong><br />
Council, the Utilities Department sent Black and Veatch a list <strong>of</strong> general questions<br />
concerning the possible use <strong>of</strong> alternative energy sources to power the water treatment<br />
plant. In October 2008, lead engineer Donnie Ginn, P.E., responded to these questions via a<br />
memorandum. 65 Ginn’s memorandum advised that completely transitioning the facilities to<br />
either hydroelectric power or solar power is significantly constrained by space, season, and<br />
cost. For example, hydroelectric power generated at the dam would have to be transferred<br />
about 10 miles over difficult terrain to the water treatment intake facility. Furthermore,<br />
the facility could only be operated for a few months in the late spring. Meanwhile,<br />
65 Memo from Donnie Ginn <strong>of</strong> Black and Veatch to Patrick Murphy, Director <strong>of</strong> <strong>City</strong> <strong>of</strong> <strong>Bloomington</strong> Utilities<br />
Department, Monroe Water Treatment Plant Alternative Energy Sources (October 21, 2008).<br />
<strong>Report</strong> <strong>of</strong> the <strong>Bloomington</strong> <strong>Peak</strong> <strong>Oil</strong> <strong>Task</strong> <strong>Force</strong><br />
44
transitioning the entire plant over to solar power would call for clearing between 16 to 40<br />
acres <strong>of</strong> land for solar cells. 66<br />
Instead <strong>of</strong> completely shifting the treatment and intake facility over to either solar or<br />
hydroelectric power, the <strong>City</strong> should explore a hybrid configuration <strong>of</strong> both to complement<br />
(not replace) the facility’s primary source <strong>of</strong> power. Such a hybrid configuration should be<br />
designed to produce enough power to run the plant at 10‐15% treatment capacity in order<br />
to provide residents a basic level <strong>of</strong> water sufficient for drinking, cooking, and basic<br />
sanitation. Hydroelectric power could be leveraged during the <strong>Indiana</strong> spring rains, when<br />
substantial cloud cover reduces the feasibility for solar but there is a great deal <strong>of</strong> untapped<br />
energy flowing over the dam. Solar power could be leveraged during the summer months<br />
and sunny winter months. 67 Used as part <strong>of</strong> a hybrid system to complement existing<br />
power sources, solar panels would require less than an acre <strong>of</strong> cleared land (estimated).<br />
In the interest <strong>of</strong> the community’s water security, the <strong>City</strong> should more closely examine<br />
hybrid energy generation at the water treatment plant. Any study should take into<br />
consideration the amount <strong>of</strong> water needed to provide minimal drinking and cooking water<br />
to residents. Further study should include a cost‐benefit that takes into account the<br />
weaknesses <strong>of</strong> the electrical grid and the grid’s ultimate reliance on oil.<br />
66 Ibid.<br />
67 Cities receiving less solar radiation than <strong>Bloomington</strong>, such as Newark, New Jersey have successfully<br />
transitioned their water and wastewater treatment to solar power. Boulder, Colorado has a level <strong>of</strong> radiation<br />
similar to <strong>Bloomington</strong> and has transitioned its water and wastewater treatment facilities to solar power.<br />
<strong>Report</strong> <strong>of</strong> the <strong>Bloomington</strong> <strong>Peak</strong> <strong>Oil</strong> <strong>Task</strong> <strong>Force</strong><br />
45
2. Advocate a tiered pricing system whereby consumers pay a rate based on<br />
consumption.<br />
The Mayor has expressed an interest in pursuing a rate structure to encourage water<br />
conservation. 68 The proposal must be approved by the <strong>Indiana</strong> Regulatory Commission. 69<br />
A tiered‐rate structure would mean that the unit price <strong>of</strong> consumption would increase after<br />
usage exceeds a predetermined basic monthly amount. While any such rate must be non‐<br />
discriminatory (e.g., must not discriminate against larger families), linking price to use will<br />
go some distance in reducing demand – peak and otherwise. In Athens‐Clarke County,<br />
Georgia – an <strong>of</strong>t‐cited college town comparable to <strong>Bloomington</strong> – rates are based on each<br />
customer’s winter average. Officials in that community estimate that this rate structure<br />
will save approximately one million gallons <strong>of</strong> water per day in the summer when use is at<br />
its peak. 70<br />
3. Encourage rainwater capture.<br />
Outdoor water use can comprise 25% to 58% <strong>of</strong> overall domestic water demand. 71<br />
Rainwater harvesting has significant potential to reduce stormwater run<strong>of</strong>f while<br />
conserving potable water. Rainwater capture <strong>of</strong>fers a number <strong>of</strong> advantages: 72<br />
• provides an inexpensive supply <strong>of</strong> water;<br />
• reduces stormwater run<strong>of</strong>f and pollution;<br />
• reduces erosion in urban environment;<br />
• provides water that needs little treatment for irrigation or non‐potable indoor uses;<br />
• helps reduce peak summer demands; and<br />
• helps introduce demand management for drinking water systems.<br />
68 <strong>State</strong> <strong>of</strong> the <strong>City</strong> Address, 2009.<br />
69 <strong>Indiana</strong> Code § 8‐1.5‐3‐8 governs rates and charges for municipal utilities and requires that rates must be<br />
"nondiscriminatory, reasonable, and just." "Reasonable and just" charges are defined as paying for all <strong>of</strong> the<br />
necessary costs <strong>of</strong> the utility, including maintenance, operating charges, upkeep, repairs, depreciation, bond<br />
interest, and the costs <strong>of</strong> extensions and replacements.<br />
70 http://www.athensclarkecounty.com/documents/pdf/publicutilities/water_conservation_rates.pdf<br />
71 Christopher Kloss, U.S. Environmental Protection Agency, Managing Wet Weather with Green Infrastructure:<br />
Municipal Handbook – Rainwater Harvesting Policies, p.1, , EPA‐833‐F‐08‐010 (December 2008).<br />
http://www.epa.gov/npdes/pubs/gi_munichandbook_harvesting.pdf<br />
72 Texas Rainwater Harvesting Evaluation Committee, Rainwater Harvesting Potential and Guidelines for<br />
Texas, <strong>Report</strong> to the 80 th Legislature, Texas Water Development Board, Austin, TX (November 2003).<br />
<strong>Report</strong> <strong>of</strong> the <strong>Bloomington</strong> <strong>Peak</strong> <strong>Oil</strong> <strong>Task</strong> <strong>Force</strong><br />
46
The <strong>City</strong> can do much to encourage and increase<br />
rainwater capture for use on lawns and gardens.<br />
Following the lead <strong>of</strong> other communities, the <strong>City</strong><br />
should:<br />
• Provide rain barrels to community members<br />
at a reduced cost, much the way it did when it<br />
<strong>of</strong>fered compost bins at a reduced rate (in<br />
cooperation with the Center for Sustainable<br />
Living). It is estimated that a 55 gallon rain<br />
barrel can save approximately 1,300 gallons <strong>of</strong><br />
water in peak summer months; 73<br />
• Implement a rain barrel rebate program; 74<br />
• Require greywater and ro<strong>of</strong>water catchment<br />
for new development as part <strong>of</strong> the <strong>City</strong>’s<br />
Unified Development Ordinance (UDO).<br />
Currently, the UDO provides incentives for the<br />
use <strong>of</strong> greywater, but does not require it. 75<br />
The <strong>City</strong> might look to Tucson, Arizona – the<br />
first city in the US to require rainwater<br />
harvesting for landscaping use. In Tucson, effective June 1, 2010, 50% <strong>of</strong> a<br />
commercial property’s irrigation water must be supplied from rainwater. In<br />
addition to cisterns, the regulations allow berms and contoured slopes to be used to<br />
direct rainwater to trees and landscaped areas; 76<br />
• Require bio‐swales and/or permeable paving for any new development; and<br />
• The <strong>City</strong> should lead by example by installing cisterns and rain barrels to provide for<br />
its own landscaping needs.<br />
73 U.S. E.P.A., What is a Rain Barrel? http://www.epa.gov/Region3/p2/what‐is‐rainbarrel.pdf<br />
74 For example, see the cistern rebate program <strong>of</strong>fered by James, Virginia<br />
http://www.bewatersmart.org/RebatePrograms/rainbarrelrebateprogram/FAQ.html#rainbarrel<br />
75 §20.05.049, <strong>Bloomington</strong> Municipal Code. http://bloomington.in.gov/green‐building‐incentives<br />
76 http://www.ci.tucson.az.us/agdocs/20081014/oct14‐08‐564a.pdf<br />
<strong>Report</strong> <strong>of</strong> the <strong>Bloomington</strong> <strong>Peak</strong> <strong>Oil</strong> <strong>Task</strong> <strong>Force</strong><br />
Commercially sized cistern at the Chicago Center for<br />
Green Technology. Source: Abby Hall, EPA.<br />
47
4. Offer other efficiency incentives.<br />
The <strong>City</strong> should implement incentives to encourage water conservation such as:<br />
• subsidies for low‐flush toilets and low‐flow shower heads, toilet displacement<br />
devices, and faucet aerators; and<br />
• rebates for energy‐efficient appliances, such as washing machines; and<br />
(See Sustenance chapter for other possible incentives.)<br />
5. Expand storage capacity.<br />
Expanding water storage capacity may be prudent for limited‐time emergencies and should<br />
be explored. However, this is mitigation for the short term, not one for the long emergency.<br />
As spelled out in a recent water supply evaluation commissioned by the <strong>City</strong>:<br />
During short‐term maximum water use conditions, it may be possible<br />
to utilize additional storage in the distribution system. The<br />
implementation <strong>of</strong> additional storage within the distribution system<br />
should be carefully analyzed with distribution system operations and<br />
is not recommended for long periods <strong>of</strong> maximum water use. The use<br />
<strong>of</strong> additional storage may lead to water quality concerns within the<br />
distribution system under maximum and normal operating<br />
conditions. Additionally, the ability to replenish the distribution<br />
system storage would be limited by the existing treatment and<br />
pumping capacity and may not be available for effective use during<br />
long periods <strong>of</strong> maximum water use. 77<br />
6. Transition all backup generators to renewable sources <strong>of</strong> energy, such as<br />
biomass or biogas.<br />
As discussed earlier, both back‐up generators for the <strong>City</strong>’s water treatment are designed<br />
to run 17 hours on a full fuel tank <strong>of</strong> diesel. In the interest <strong>of</strong> redundancy, we should<br />
explore how these generators might be transitioned to renewable sources <strong>of</strong> energy. At<br />
minimum, the generators should be flex‐fitted to run on biodiesel. Ideally, such generators<br />
could be run on biomass or biogas.<br />
77 Black & Veatch, Water Supply Evaluation, 4‐1 (2007).<br />
<strong>Report</strong> <strong>of</strong> the <strong>Bloomington</strong> <strong>Peak</strong> <strong>Oil</strong> <strong>Task</strong> <strong>Force</strong><br />
48
7. The <strong>City</strong> should reexamine the “Summer Sewer Average”<br />
With the “Summer Sewer Average,” utilities customers’ wastewater bills during the<br />
summer months are based on their pre‐summer average water usage, rather than actual<br />
water usage. This practice encourages discretionary watering in the summer – lawn<br />
watering, car washing, etc. While an end to this average would likely foster greater<br />
conservation, the <strong>City</strong> should explore whether, in light <strong>of</strong> anticipated increased urban<br />
gardening, ending this practice would be prudent.<br />
8. Develop an Emergency Ration & Education Plan<br />
From time‐to‐time, the Utilities Department has been called upon to create contingency<br />
plans. To date, the Department has not experienced an emergency with which it has not<br />
been able to sufficiently cope. However, complete grid failure presents a different picture.<br />
Utilities currently has “What to do if” emergency guides for each physical location, but they<br />
are limited to identifying hazards and suggesting notification and evacuation scenarios.<br />
The guides are not up to date. Utilities should develop a comprehensive, system‐wide<br />
emergency ration and education plan to prepare for complete grid failure.<br />
<strong>Report</strong> <strong>of</strong> the <strong>Bloomington</strong> <strong>Peak</strong> <strong>Oil</strong> <strong>Task</strong> <strong>Force</strong><br />
49
MEDIUMTERM (5‐15 years)<br />
1. Explore the possibility <strong>of</strong> using smart meters to track water consumption.<br />
A smart water meter would identify consumption in more<br />
detail than a conventional meter and would communicate<br />
that information back via a network to CBU for monitoring<br />
and billing purposes. This would give the consumer better<br />
feedback on use and cut out the need for staff to visit<br />
individual homes to read meters. Such technology has been<br />
successfully implemented in college communities such as<br />
Ann Arbor, Michigan 78 and was recently instituted throughout Britain. 79<br />
2. The <strong>City</strong> should continue to expand its alternative energy generation so that it<br />
derives 25% <strong>of</strong> its water treatment from alternative energy by 2025.<br />
LONGTERM (1530 years)<br />
1. The <strong>City</strong> should strive to make its water treatment and processing completely<br />
grid independent.<br />
2. The <strong>City</strong> should work toward more neighborhoodbased cistern options for<br />
potable water.<br />
While harvested rainwater could be used as potable water, the required on‐site treatment<br />
and perceived public health concerns represent cultural hurdles. These hurdles will take a<br />
long time to address, but a long‐term goal is to transition to more use <strong>of</strong> neighborhood<br />
cisterns.<br />
<strong>Report</strong> <strong>of</strong> the <strong>Bloomington</strong> <strong>Peak</strong> <strong>Oil</strong> <strong>Task</strong> <strong>Force</strong><br />
Source: Associated Press<br />
78 http://blog.tdworld.com/briefingroom/2009/03/25/city‐<strong>of</strong>‐ann‐arbor‐wins‐metering‐international‐<br />
award‐with‐implementation‐<strong>of</strong>‐the‐aclara‐star‐network‐system/<br />
79 James Kanter, “Britain Announces Broad Smart‐Metering Plan,” The New York Times, May 12, 2009<br />
http://greeninc.blogs.nytimes.com/2009/05/12/britain‐announces‐broad‐smart‐meter‐<br />
plan/?scp=4&sq=peak%20oil&st=cse<br />
50
3. Explore reactivating the Lake Griffy Treatment Facility.<br />
The Lake Griffy Treatment Facility was decommissioned in 1996. In 2003, the <strong>City</strong>’s Long<br />
Range Water Capital Plan (LRWCP) examined the possibility <strong>of</strong> reviving Lake Lemon/Bean<br />
Blossom Creek and Griffy Lake as alternative sources. Subsequently, it was determined that<br />
these sources should not be considered due to higher costs associated with capital<br />
improvement projects, water quality concerns, and concerns about sufficient yields from<br />
these sources. 80<br />
At approximately 3.23 miles from the city center, Lake Griffy is significantly closer to<br />
<strong>Bloomington</strong> residents than is Lake Monroe, which is at least seven miles away. Given the<br />
proximity to the city and the need to build in more redundancy into a highly‐centralized<br />
water treatment system, this option warrants re‐examination.<br />
80 Black and Veatch, Water Supply Evaluation, 4‐1 (2007).<br />
<strong>Report</strong> <strong>of</strong> the <strong>Bloomington</strong> <strong>Peak</strong> <strong>Oil</strong> <strong>Task</strong> <strong>Force</strong><br />
51
WASTE DISPOSAL: THE DETRITUS OF CONSUMPTION<br />
Waste is a systemic and inevitable aspect <strong>of</strong> our community. Yet, our ever‐increasing<br />
consumption <strong>of</strong> goods and their easy disposal has led to a very energy‐intensive waste<br />
disposal infrastructure. Re‐thinking our consumption and disposal habits with peak oil in<br />
mind has the potential to lead to greater cost savings to the taxpayers, increased<br />
efficiencies, and greater community resilience.<br />
SOLID WASTE & RECYCLING<br />
Trash inhabits an important, but invisible, cultural space in our community. It requires<br />
setting boundaries and setting margins, both physically and symbolically. 81 Out <strong>of</strong> sight, out<br />
<strong>of</strong> mind. At certain intervals – usually weekly – we put our garbage out by the curb and a<br />
truck takes it away. However, making trash “go away” by putting it on a truck is a fuel‐<br />
intensive process.<br />
A REVIEW OF THE CURRENT SITUATION<br />
The <strong>City</strong> <strong>of</strong> <strong>Bloomington</strong> Sanitation Division collects residential solid waste, yard waste,<br />
and recyclable material from approximately 8,000 households within <strong>City</strong> limits. The <strong>City</strong><br />
collects neither trash nor recyclables from residences <strong>of</strong> more than four units.<br />
<strong>Bloomington</strong> residents pay a $2.00 fee for each 35‐gallon trash bag or container collected<br />
by the <strong>City</strong>, and a $1.00 per bag fee for yard waste. Curbside recycling, which began in<br />
1991, is free <strong>of</strong> charge. Materials eligible for recycling in <strong>Bloomington</strong> and Monroe County<br />
include paper products, glass containers, steel cans, aluminum cans, and plastic bottles.<br />
The <strong>City</strong> also collects leaves and yard waste. The <strong>City</strong>’s Sanitation Division picks up yard<br />
waste from early March to early January and takes it to Good Earth Compost and Mulch,<br />
LLC for mulching. Both the <strong>City</strong>’s Sanitation Division and Street Division provide leaf pick‐<br />
up services.<br />
81 Mary Douglas, Purity and Danger: An Analysis <strong>of</strong> the Concepts <strong>of</strong> Pollution and Taboo, Routledge, 1966.<br />
<strong>Report</strong> <strong>of</strong> the <strong>Bloomington</strong> <strong>Peak</strong> <strong>Oil</strong> <strong>Task</strong> <strong>Force</strong><br />
52
From early November to late December, residents are afforded three options to dispose <strong>of</strong><br />
their leaves:<br />
• <strong>City</strong> Sanitation crews will collect yard waste every week on your scheduled trash<br />
day in the free leaf collection bags;<br />
• Residents can drop leaves <strong>of</strong>f at any <strong>of</strong> five collection sites; and<br />
• The Street Division provides a curbside leaf pick up on a regular basis Monday<br />
through Friday.<br />
While the leaves collected by the <strong>City</strong> are taken to Good Earth for composting, the leaves<br />
collected by the Street division are taken to a decommissioned <strong>City</strong> wastewater plant<br />
contaminated by PCBs where the leaves are used for fill.<br />
The <strong>City</strong>’s Sanitation Division owns approximately 17 vehicles. In 2008, the Division<br />
consumed 1,584.84 gallons <strong>of</strong> unleaded and 24,475.79 gallons <strong>of</strong> diesel. The Sanitation<br />
Division has gone to a condensed work week <strong>of</strong> four 10‐hour work days and has cut its<br />
unleaded fuel costs by 37%. Its diesel costs have remained largely unchanged, despite<br />
increasing fuel prices.<br />
Until recently, much <strong>of</strong> the solid waste generated locally was taken to the Monroe County<br />
Landfill, which was operated by the Monroe County Solid Waste Management District.<br />
However, the landfill suspended operations during the summer <strong>of</strong> 2004 after it erupted<br />
into flames. It was subsequently closed and is under contract to remain closed until 2024.<br />
At present, the majority <strong>of</strong> the <strong>City</strong>’s solid waste is hauled to Sycamore Ridge Landfill,<br />
located in Pimento, IN (Vigo County), about 55 miles from <strong>Bloomington</strong>.<br />
In 2007, 159,968 tons <strong>of</strong> solid waste was generated in Monroe County. 82 Based on U.S.<br />
Census figures, <strong>Bloomington</strong> residents constitute about 56% <strong>of</strong> the Monroe County<br />
population. 83 Therefore, we might estimate that <strong>Bloomington</strong> residents generated about<br />
82<strong>Indiana</strong> Department <strong>of</strong> Environmental Management, 2007 Solid Waste Facilities <strong>Report</strong><br />
http://www.in.gov/idem/files/solid_waste_far07.pdf<br />
83 U.S. Census Bureau; <strong>Indiana</strong> Business Research Center<br />
<strong>Report</strong> <strong>of</strong> the <strong>Bloomington</strong> <strong>Peak</strong> <strong>Oil</strong> <strong>Task</strong> <strong>Force</strong><br />
53
89,582 tons <strong>of</strong> garbage in 2007. 84 The U.S. Environmental Protection Agency estimates that<br />
since 1960, the amount <strong>of</strong> waste each person generates has increased from 2.7 pounds per<br />
day to 4.62 pounds per day – from 985 pounds a year to 1,686 pounds per year. 85<br />
VULNERABILITIES<br />
1. The collection <strong>of</strong> waste and recyclables is essentially a trucking function,<br />
wholly reliant on liquid fuel for operation.<br />
While the <strong>City</strong>’s Sanitation Division has taken the prudent step toward reducing vehicle<br />
miles travelled and saving the taxpayers money by moving to a four‐day work week, its<br />
functioning is still wholly dependent upon liquid fuels. Given a dramatic decline in cheap<br />
fuel, the Division would have to reduce all collection services and possibly eliminate its<br />
appliance collection service and/or pass on the increased costs to residents. This might<br />
result in some residents not paying for trash disposal and instead illegally dumping their<br />
garbage in undesirable places. A fuel shortage might also result in an inability to pick up<br />
trash, resulting in illegal trash dumping and/or accumulation <strong>of</strong> trash at residences – both<br />
threats to public health.<br />
2. The transport <strong>of</strong> our community waste 55 miles away is wholly dependent on<br />
the availability <strong>of</strong> liquid fuel.<br />
In the absence <strong>of</strong> a local disposal site, the community would likely have to continue<br />
shipping its waste out <strong>of</strong> the community. Again, rising costs <strong>of</strong> such shipping due to fuel<br />
scarcity would likely be passed on to residents with the aforementioned consequences.<br />
84 Note that this figure includes trash picked up by the <strong>City</strong> from residences with four or fewer unit s, multi‐<br />
family units serviced by private haulers and trash hauled from <strong>Indiana</strong> University.<br />
85 US EPA, Municipal Solid Waste in the United <strong>State</strong>s: 2007 Facts and Figures, EPA530‐R‐08‐010, 134; See<br />
further, Elizabeth Royte, Garbage Land: On the Secret Trail <strong>of</strong> Trash, 275 (2005).<br />
<strong>Report</strong> <strong>of</strong> the <strong>Bloomington</strong> <strong>Peak</strong> <strong>Oil</strong> <strong>Task</strong> <strong>Force</strong><br />
54
3. Yard trimmings and food waste unduly burden the <strong>City</strong>’s waste collection<br />
operations.<br />
The U.S. Environmental Protection Agency (EPA) estimates that yard trimmings and food<br />
residuals together constitute 24 percent <strong>of</strong> the U.S. municipal solid waste stream. 86<br />
In 2008, the Sanitation Division collected 470 truck loads <strong>of</strong> yard waste. In 2008, the<br />
Division collected 420 truck loads <strong>of</strong> leaves. As leaves are nutrient‐rich and good for<br />
improving lawns and gardens, the <strong>City</strong>’s provision <strong>of</strong> leaf‐removal services is not only<br />
expensive and fuel intensive, it discourages a change in thinking whereby more residents<br />
think <strong>of</strong> leaves as food for the soil, rather than “waste.”<br />
While the <strong>City</strong> has in place a program for picking up yard waste, it does not provide for<br />
compostable food residuals. That's a lot <strong>of</strong> waste to send to landfills when it could become<br />
useful and environmentally beneficial compost instead. 87 Not only does the collection and<br />
transport <strong>of</strong> such material remove a lot <strong>of</strong> potential compost, but such organic matter<br />
produces significant greenhouse gas emissions when landfilled.<br />
86 U.S. E.P.A. Wastes Resource Conservation Reduce, Reuse, Recycle – Composting.<br />
http://www.epa.gov/waste/conserve/rrr/composting/basic.htm<br />
87 Ibid.<br />
<strong>Report</strong> <strong>of</strong> the <strong>Bloomington</strong> <strong>Peak</strong> <strong>Oil</strong> <strong>Task</strong> <strong>Force</strong><br />
55
MITIGATION GOALS & STRATEGIES<br />
SHORTTERM STRATEGIES (15 years)<br />
1. Residents should be encouraged to buy less stuff – especially nonlocal stuff.<br />
According to the E.P.A., “source reduction” is one <strong>of</strong> the most effective ways to reduce<br />
waste disposal and handling costs, because it avoids the costs <strong>of</strong> recycling, municipal<br />
composting, landfilling, and combustion. Source reduction also conserves resources and<br />
reduces pollution, including greenhouse gases. 88<br />
Most <strong>of</strong> what we buy is decidedly not local. More effective than recycling and reusing is just<br />
buying less stuff. Not only will limiting consumption save money, but if paired with a “buy<br />
local” prioritization <strong>of</strong> basic goods (see Economic Context), it will reduce the volume <strong>of</strong><br />
material we send to the landfill and promote economic resilience through relocalization.<br />
2. The <strong>City</strong> should provide educational outreach to the community about the<br />
benefits <strong>of</strong> composting leaves and table scraps with the goal <strong>of</strong> reducing its<br />
leaf pickup services by 50% in five years.<br />
Like other recycling efforts, the composting <strong>of</strong> yard trimmings<br />
and food scraps can help decrease the amount <strong>of</strong> solid waste that<br />
must be sent to a landfill, thereby reducing disposal costs.<br />
According to the E.P.A., food waste alone comprises about 12<br />
percent <strong>of</strong> what a typical US American throws away every day;<br />
yet, only 2 percent <strong>of</strong> that is composted. 89 Composting yields a<br />
valuable product that can be used by homeowners, farmers,<br />
landscapers, horticulturists, government agencies, and property<br />
owners as a soil amendment or mulch. Cities such as Toronto,<br />
Oakland, Seattle, and Portland have implemented city‐sponsored<br />
composting programs.<br />
88 U.S. E.P.A. Wastes Resource Conservation Reduce, Reuse, Recycle – Reduce and Reuse.<br />
http://www.epa.gov/wastes/conserve/rrr/reduce.htm<br />
89 Supra note 86.<br />
<strong>Report</strong> <strong>of</strong> the <strong>Bloomington</strong> <strong>Peak</strong> <strong>Oil</strong> <strong>Task</strong> <strong>Force</strong><br />
Shovel digging in compost.<br />
Source: U.S. EPA<br />
56
3. The <strong>City</strong> should establish a neighborhood compost collection program. It<br />
should use this compost for community gardens, especially those which<br />
benefit local hunger relief programs.<br />
As described in the Sustenance chapter, a decline in cheap oil will result in greater food<br />
insecurity, especially among economically‐vulnerable populations. Programs for growing<br />
food within the city will need to be expanded. The <strong>City</strong> should begin to identify sites for<br />
neighborhood composts.<br />
4. The <strong>City</strong> should work toward encouraging existing apartment complexes to<br />
provide recycling services to their tenants and should require any new<br />
apartment development to do so.<br />
Currently, the <strong>City</strong> picks up waste and recycling only from residences which contain four or<br />
fewer units. Buildings <strong>of</strong> five or more units may or may not provide recycling services to<br />
their tenants. The <strong>City</strong> should work toward encouraging existing apartment complexes to<br />
provide recycling and should require any new apartment development to do so.<br />
5. The <strong>City</strong> should support the establishment <strong>of</strong> a community materials recovery<br />
facility.<br />
The Monroe County Solid Waste District currently outsources the processing <strong>of</strong> paper,<br />
cardboard, aluminum, glass and plastic. Currently, these recyclables are taken to<br />
<strong>Indiana</strong>polis for processing. From 2005‐2008, the District outsourced processing for<br />
11,575 tons <strong>of</strong> paper, cardboard, aluminum and plastics. Those items were valued at more<br />
than $1.25 million, but the District only received about $275,000 in rebates. A local<br />
recovery facility would likely not only generate revenue, but would keep such processing<br />
local, obviating the need to transport the community’s recyclables 50+ miles. Should such<br />
transport become cost‐prohibitive, localizing this service makes our community more<br />
resilient. The <strong>City</strong> should work with other community stakeholders to support this effort.<br />
Similarly, as the <strong>City</strong> works to promote composting, it should consider the establishment <strong>of</strong><br />
a community organic materials recovery facility. See further the Sustenance chapter.<br />
<strong>Report</strong> <strong>of</strong> the <strong>Bloomington</strong> <strong>Peak</strong> <strong>Oil</strong> <strong>Task</strong> <strong>Force</strong><br />
57
MEDIUMTERM STRATEGIES (515 years)<br />
1. The <strong>City</strong> should establish landfill diversion targets and waste reduction goals.<br />
Based on <strong>City</strong> waste collection data, the community recycles approximately 34% <strong>of</strong> its<br />
waste. In the interest <strong>of</strong> reducing the amount <strong>of</strong> waste sent to the landfill, many other<br />
communities have established waste‐reduction targets and many have set zero waste<br />
goals. 90 <strong>Bloomington</strong> should set an ambitious goal for a Zero Waste <strong>Bloomington</strong> by 2040.<br />
To get there, the <strong>City</strong> should resolve to:<br />
• reduce per capita waste disposal by 20% by 2014;<br />
• encourage composting on residential, industrial, and commercial sites; and<br />
• require recycling and composting services for all new development.<br />
2. The <strong>City</strong> should consider ways in which it could promote the processing and<br />
use <strong>of</strong> locallygenerated recyclable material.<br />
Specifically, the <strong>City</strong> should sponsor a study to evaluate the potential for local<br />
manufacturing <strong>of</strong> products made from locally‐generated recycled materials. For example,<br />
the <strong>City</strong> <strong>of</strong> San Francisco has implemented an innovative trash‐into‐fuel program whereby<br />
fats, oils, and grease from households, restaurants, etc. are diverted away from the solid<br />
waste and wastewater streams and toward the <strong>City</strong> fleet by converting the waste to bi<strong>of</strong>uel.<br />
A similar program in <strong>Bloomington</strong> would foster energy independence by providing<br />
alternate fuel for the <strong>City</strong> fleet, while at the same time providing businesses and residents<br />
with a cheaper and cleaner option for waste disposal. 91<br />
90 Zero waste goals have been set by a number <strong>of</strong> other communities, such as San Francisco, CA; Austin, TX;<br />
Portland, OR; Oakland, CA; Seattle, WA<br />
91 See http://www.sfgreasecycle.org/thedish.shtml<br />
<strong>Report</strong> <strong>of</strong> the <strong>Bloomington</strong> <strong>Peak</strong> <strong>Oil</strong> <strong>Task</strong> <strong>Force</strong><br />
58
LONGTERM STRATEGIES (1530 years)<br />
1. Reopen the Monroe County Landfill and tap it for biogas.<br />
That the <strong>City</strong> ships almost 86,000 tons <strong>of</strong> waste 55 miles poses a serious threat in a post‐<br />
peak <strong>Bloomington</strong>. The <strong>City</strong> should work with other community stakeholders to examine<br />
the feasibility <strong>of</strong> re‐activating the Monroe County Landfill after its contractually‐required<br />
closure period ends in 2024. The Monroe County Solid Waste Management District is<br />
investigating the feasibility <strong>of</strong> a biogas‐to‐energy system at the Landfill. The <strong>City</strong> should<br />
fully support such an inquiry.<br />
If re‐opening the landfill is not feasible, the <strong>City</strong> should work with other community<br />
stakeholders to explore establishing a new, local landfill and tapping it for biogas.<br />
According to the EPA:<br />
Municipal solid waste landfills are the second largest source <strong>of</strong> human‐<br />
related methane emissions in the United <strong>State</strong>s, accounting for nearly 23<br />
percent <strong>of</strong> these emissions in 2006. At the same time, methane emissions<br />
from landfills represent a lost opportunity to capture and use a significant<br />
energy resource. 92<br />
Landfill gas should not be released and allowed to migrate into the atmosphere. It can be<br />
captured, converted, and used as an energy source. Such biogas can be used to generate<br />
energy, to directly <strong>of</strong>fset the use <strong>of</strong> another fuel (e.g., natural gas, coal, oil), for co‐<br />
generation (producing both electricity and thermal energy), and even to produce alternate<br />
fuels (delivered to the natural gas pipeline and/or converted to vehicle fuel in the form <strong>of</strong><br />
compressed natural gas or liquefied natural gas.). 93<br />
Landfill biogas‐to‐energy systems are not uncommon. As <strong>of</strong> 2008, the E.P.A. reports that<br />
there were approximately 480 such energy projects in the U.S. and 520 landfills that were<br />
good candidates. At least three landfills in <strong>Indiana</strong> are generating energy. 94<br />
92 Landfill Methane Outreach Program, http://www.epa.gov/landfill/overview.htm<br />
93 Ibid.<br />
94 Logansport, Liberty and Clark & Floyd counties. A description <strong>of</strong> the Logansport and Liberty projects at:<br />
"Two <strong>Indiana</strong> Landfills now generating electricity,” The Chicago Tribune (October 20, 2008).<br />
http://archives.chicagotribune.com/2008/oct/20/news/chi‐ap‐in‐trashtoenergy<br />
<strong>Report</strong> <strong>of</strong> the <strong>Bloomington</strong> <strong>Peak</strong> <strong>Oil</strong> <strong>Task</strong> <strong>Force</strong><br />
59
Re‐establishing a local landfill will be critical in a post‐peak community. Not only will the<br />
relocalization <strong>of</strong> our waste drastically reduce the amount <strong>of</strong> fuel used to transport the<br />
trash, but a landfill using a landfill‐to‐biogas system strengthens our community’s<br />
commitment to cleaner air, renewable energy, economic development, improved public<br />
welfare and safety, and reductions in greenhouse gases.<br />
“Together, the Logansport and Liberty landfills now generate enough electricity to power about 5,100 homes.<br />
Beasy said that the 3.1‐megawatt Oakridge plant generates the same amount <strong>of</strong> electricity each year as<br />
50,000 barrels <strong>of</strong> oil. Since going online, he said the site has produced 131 million kilowatts <strong>of</strong> electricity – or<br />
the equivalent <strong>of</strong> 267,917 barrels <strong>of</strong> oil. He said the Oakridge facility about 40 miles northeast <strong>of</strong> Lafayette<br />
uses four generator engines that churn out 3,100 kilowatts <strong>of</strong> electricity per hour.”<br />
Clark‐Floyd Landfill Methane Generation Project description via Hoosier Energy:<br />
http://www.hepn.com/clark‐floyd.asp<br />
• Hoosier Energy has constructed an electricity generation plant at the Clark-Floyd Landfill that produces<br />
two megawatts <strong>of</strong> renewable energy<br />
• At two megawatts <strong>of</strong> capacity, the $4 million landfill generation project provides enough electricity for<br />
about 1,200 typical homes. The landfill is located on a 400-acre site in Clark County.<br />
• The project received a $100,000 Alternative Power and Energy Program grant from the <strong>Indiana</strong> Office <strong>of</strong><br />
Energy and Defense Development.<br />
<strong>Report</strong> <strong>of</strong> the <strong>Bloomington</strong> <strong>Peak</strong> <strong>Oil</strong> <strong>Task</strong> <strong>Force</strong><br />
60
WASTEWATER<br />
The <strong>City</strong> operates two wastewater treatment facilities – the Dillman Road Treatment Plant<br />
and the Blucher Poole Plant. Both employ systems <strong>of</strong> aerobic digestion as part <strong>of</strong> their<br />
treatment processes. The Dillman Plant has a design capacity <strong>of</strong> 15 million gallons daily and<br />
a peak hydraulic capacity in excess <strong>of</strong> 30 million gallons daily. The Blucher Poole Plant has<br />
a design capacity <strong>of</strong> 6 million gallons per day and a peak hydraulic capacity <strong>of</strong> 12 million<br />
gallons per day.<br />
VULNERABILITIES<br />
The treatment <strong>of</strong> the <strong>City</strong>’s wastewater consumes approximately 1,141,000 KWh per<br />
month. As with water treatment, the electricity required to run these plants relies on the<br />
burning <strong>of</strong> coal. The extraction <strong>of</strong> coal relies heavily on petroleum inputs. Therefore, our<br />
wastewater treatment processes are vulnerable to volatile oil prices and an aging grid.<br />
MITIGATION GOALS & STRATEGIES<br />
SHORTTERM (15 years)<br />
1. Encourage greater water conservation<br />
The vulnerabilities inherent in the treatment <strong>of</strong> wastewater are similar to those associated<br />
with water treatment and distribution. Perhaps the most immediate and decidedly low‐<br />
tech solution to a vulnerable wastewater system is to reduce the amount <strong>of</strong> wastewater<br />
circulating through it. Conserving water and using energy‐efficient appliances will help<br />
reduce some <strong>of</strong> the pressure on the system. These mitigation strategies are mapped out in<br />
the Water Supply section above and in the Sustenance chapter.<br />
<strong>Report</strong> <strong>of</strong> the <strong>Bloomington</strong> <strong>Peak</strong> <strong>Oil</strong> <strong>Task</strong> <strong>Force</strong><br />
61
2. Transition all backup generators to renewable sources <strong>of</strong> energy, such as<br />
biomass.<br />
Currently, both treatment plants rely on diesel back‐up generators. The Dillman Plant has<br />
one generator on site that holds 1,000 gallons <strong>of</strong> fuel and will provide 8 hours <strong>of</strong> power.<br />
The Blucher Plant has one generator on site that holds 3,000 gallons <strong>of</strong> fuel and will<br />
provide 60 hours <strong>of</strong> power.<br />
As is recommended for the treatment <strong>of</strong> water, the <strong>Task</strong> <strong>Force</strong> recommends that the <strong>City</strong><br />
should explore how these generators might be transitioned to renewable sources <strong>of</strong> energy.<br />
At minimum, the generators should be flex‐fitted to run on biodiesel. Ideally, such<br />
generators could be run on biomass or biogas.<br />
3. Make better use <strong>of</strong> biosolids.<br />
At present, the Utilities Department deposits all treated sewage sludge – biosolids – at its<br />
Dillman Road Treatment biomass landfill. It is expected that the landfill will be at capacity<br />
in four to five years. If Utilities continues to landfill the sludge, it will have to send it the<br />
way <strong>of</strong> all other <strong>City</strong> solid waste – to the Sycamore Ridge Landfill, 55 miles away. However,<br />
this sewage sludge is a potential resource. In the US, approximately 50% <strong>of</strong> suitable<br />
biomass is recycled to land in the form <strong>of</strong> fertilizer. 95 The <strong>City</strong> should consider using this<br />
for fertilization <strong>of</strong> non‐food plants, such as those grown for bi<strong>of</strong>uels or feedstock. However,<br />
as is required by the EPA, it is imperative that any biomass spread on local fields be free <strong>of</strong><br />
harmful contaminants.<br />
95 Note that to apply biomass to land, the biomass must meet strict quality criteria as spell out in 40 CFR Part<br />
503, See http://www.epa.gov/OW‐OWM.html/mtb/biosolids/503pe/index.htm<br />
<strong>Report</strong> <strong>of</strong> the <strong>Bloomington</strong> <strong>Peak</strong> <strong>Oil</strong> <strong>Task</strong> <strong>Force</strong><br />
62
LONGTERM (1530 years)<br />
1. Explore sludgetobiogas energy generation<br />
Wastewater is a rich source <strong>of</strong> organic matter, nutrients, and minerals. The products <strong>of</strong><br />
such wastes are potentially valuable resources, both as energy and as reusable compounds<br />
such as phosphorus. 96 Indeed, research has demonstrated that sewage actually contains 10<br />
times the energy needed to treat it. 97 A number <strong>of</strong> widely‐tested energy recovery<br />
technologies have emerged to recover this energy.<br />
Perhaps the most common way to extract energy is the sludge‐to‐biogas (methane)<br />
process. However, such a process is reliant on anaerobic digestion. While it would likely be<br />
very costly to transition the <strong>City</strong>’s current aerobic digestion system to an anaerobic one<br />
capable <strong>of</strong> producing energy, the <strong>City</strong> should explore such a shift in the long term. Such<br />
energy could be used directly for wastewater treatment, reducing the facility’s dependency<br />
on conventional electricity. Using solids as a resource rather than a waste may help<br />
stressed public budgets as well. Wastewater solids must be processed prior to disposal, and<br />
solids handling accounts for as much as 30 percent <strong>of</strong> a wastewater treatment facility’s<br />
costs. 98<br />
Furthermore, elements like phosphorus are becoming increasingly scarce, and the recovery<br />
and renewability <strong>of</strong> these resources is becoming economically and ecologically attractive.<br />
Phosphorus recovery can reduce sludge volumes produced by up to 30 percent. In addition<br />
to exploring sludge‐to‐biogas production, the <strong>City</strong> should closely examine the feasibility <strong>of</strong><br />
phosphorus recovery.<br />
96 Phosphorus is a growth‐limiting nutrient that is discharged to the environment through municipal sewage. The impacts<br />
<strong>of</strong> phosphorus discharge include severe eutrophication <strong>of</strong> fresh water bodies. The US EPA has made clear that the future<br />
sustainable use <strong>of</strong> phosphorus must include recovery from municipal sewage and reprocessing as a fertilizer. US EPA,<br />
Phosphorus Recovery from Sewage (2005)<br />
http://cfpub.epa.gov/ncer_abstracts/index.cfm/fuseaction/display.abstractDetail/abstract/7345/report/F; See further,<br />
Woods, et al, “Phosphorus Recovery Technology Modeling and Feasibility Evaluation for Municipal<br />
Wastewater Treatment Plants,” Environmental Technology 20(7)(1999): 663‐679.<br />
97 Global Water Research Coalition, <strong>State</strong> <strong>of</strong> the Science <strong>Report</strong>: Energy and Resource Recovery from Sludge<br />
(2008) http://www.werf.org/AM/CustomSource/Downloads/uGetExecutiveSummary.cfm?File=ES‐<br />
OWSO3R07.pdf&ContentFileID=6450<br />
98 Ibid.<br />
<strong>Report</strong> <strong>of</strong> the <strong>Bloomington</strong> <strong>Peak</strong> <strong>Oil</strong> <strong>Task</strong> <strong>Force</strong><br />
63
POLICE, FIRE & OTHER EMERGENCY SERVICES<br />
Police and fire protection and other emergency services are among the most important<br />
services a government can provide. However, they are also the most vulnerable to a<br />
decline in cheap oil. <strong>Peak</strong> oil presents emergency services with twin challenges: a decline<br />
in fuel with which to respond to emergencies and potential social unrest due to fuel<br />
shortages and economic disruptions.<br />
POLICE DEPARTMENT<br />
The <strong>City</strong> <strong>of</strong> <strong>Bloomington</strong> Police Department (BPD) is a full‐service police agency, providing<br />
police protection to a city <strong>of</strong> approximately 72,000 residents and a land area <strong>of</strong><br />
approximately 20 square miles. The Police Department employs 92 sworn <strong>of</strong>ficers and 36<br />
civilian employees. The Department is a very visible one and such visibility helps keep<br />
crime low in our community.<br />
The BPD maintains 45 vehicles. Over the last three years, the<br />
Department has used an average <strong>of</strong> about 5,360 gallons <strong>of</strong> gas a<br />
month. That keeps about 12 police cars on the street patrolling and<br />
responding to calls. BPD is one <strong>of</strong> the <strong>City</strong>’s most fuel‐intensive<br />
departments. In 2008, the Department used 64,109 gallons <strong>of</strong><br />
unleaded fuel and 84 gallons <strong>of</strong> diesel – about 3,613 gallons less fuel<br />
than it used in 2007. Despite this reduction, its fuel expenditures<br />
increased from $164,040 in 2007 to $196,640 in 2008. $230,300<br />
has been budgeted for fuel in 2009.<br />
Where it can, BPD is working to use vehicles that consume less energy. The Department<br />
has added a few motorcycles, they’ve purchased a few electric Segways for downtown and<br />
trail patrol, and they employ bicycle and foot patrols where appropriate. The Department<br />
purchased a hybrid vehicle for its school liaison <strong>of</strong>ficer and has begun shutting down<br />
engines when vehicles are not being driven.<br />
<strong>Report</strong> <strong>of</strong> the <strong>Bloomington</strong> <strong>Peak</strong> <strong>Oil</strong> <strong>Task</strong> <strong>Force</strong><br />
<strong>Bloomington</strong> police Lt. Jimmy Ratcliff<br />
stands on a Segway along the BLine<br />
Trail. Property <strong>of</strong> the HeraldTimes,<br />
David Snodgress.<br />
64
FIRE DEPARTMENT<br />
The <strong>City</strong>’s Fire Department provides fire suppression, emergency medical services, and<br />
rescue services for vehicle accidents and other rescue needs. The Department provides<br />
community protection at all times.<br />
The Department employs 107 full‐time firefighters and maintains five fire stations. It has<br />
23 vehicles <strong>of</strong> which six are fire trucks. The Fire<br />
Department’s six pumpers, two aerial trucks,<br />
one brush truck, one confined space truck, and<br />
three rescue trucks all run on B20 biodiesel.<br />
The Department’s ten remaining vehicles are<br />
used for administrative purposes and run on<br />
gasoline. In 2008, the Department made<br />
approximately 3,300 runs. Approximately 37%<br />
<strong>of</strong> those were for rescue or emergency medical<br />
services. At minimum, the department estimates that it needs a minimum <strong>of</strong> 22,000 gallons<br />
<strong>of</strong> biodiesel to provide services.<br />
VULNERABILIES<br />
1. The Police Department relies on the availability <strong>of</strong> gasoline to keep our<br />
community safe and is significantly exposed to cost increases.<br />
As one <strong>of</strong> the most fuel‐consumptive departments, the Police Department is perhaps one <strong>of</strong><br />
the most vulnerable to a decline in cheap oil. At the present moment, the Department<br />
would not be able to fulfill its duties without gasoline.<br />
2. The Fire Department relies on B20 biodiesel and is largely exposed to cost<br />
increases.<br />
B20 is a fuel blend composed <strong>of</strong> 20% biodiesel and 80% petroleum diesel. 99<br />
99 National Biodiesel Board, Biodiesel Basics, http://www.biodiesel.org/resources/biodiesel_basics/.<br />
<strong>Report</strong> <strong>of</strong> the <strong>Bloomington</strong> <strong>Peak</strong> <strong>Oil</strong> <strong>Task</strong> <strong>Force</strong><br />
65
3. There is a potential for increased social problems resulting from peak oil and<br />
economic dislocation.<br />
The recent experience with escalating gas prices, the attendant increase in food prices, the<br />
mortgage crisis, and the recession have put great pressure on our community’s residents as<br />
well as social service providers. As explained in the Economic Context chapter, it is<br />
anticipated that our current period <strong>of</strong> economic distress will last for some time. It is well<br />
documented that, in times <strong>of</strong> economic hardship, illegal activity and violence tend to<br />
increase. 100 Observers point out that every recession since the late 1950s has been marked<br />
by an increase in crime, particularly property crime and robbery. 101 The Police Executive<br />
Research Forum recently conducted a survey <strong>of</strong> 233 police agencies and found that 44<br />
percent reported a rise in certain types <strong>of</strong> crime attributed to the current economic climate.<br />
The study also found that 63 percent <strong>of</strong> departments were making plans for overall cuts in<br />
their funding for the next fiscal year. 102<br />
<strong>Peak</strong> oil, exacerbated by the current economic climate, translates into more economic<br />
dislocation. It is likely that some citizens, out <strong>of</strong> both frustration and despair, will look for<br />
extra‐legal ways to sustain themselves. 103 This will put increased pressure on the Police<br />
Department to keep the city safe and on the Fire Department to provide emergency<br />
medical treatment. If social services are increasingly strained or otherwise compromised,<br />
police may be called upon to fulfill this role as well.<br />
100 Alfred Blumstein and Richard Rosenfeld, “Factors Contributing to U.S. Crime Trends,” Understanding<br />
Crime Trends: Workshop <strong>Report</strong>, Goldberger and Rosenfeld, eds, 13‐44 (National Academies Press:<br />
Washington, D.C, 2008). Lesley Williams Reid, Crime in the <strong>City</strong>: A Political and Economic Analysis <strong>of</strong> Urban<br />
Crime (LFB Scholarly Publishing LLC: New York, NY, 2003).<br />
See also, David Streitfield. “The Recession Made Them Do It,” The New York Times, May 10, 2009.<br />
http://www.nytimes.com/2009/05/10/weekinreview/10streitfeld.html?scp=14&sq=recession%20violence<br />
&st=cse<br />
101 Ross Colvin, “Economic Downturn Hits U.S. Police With Double Whammy,” Reuters, October 21, 2008<br />
http://www.reuters.com/article/newsOne/idUSTRE49K0VH20081021<br />
102 Police Executive Research Forum, Survey on Policing and Economy (2008).<br />
http://policeforum.org/upload/PERF%20Survey%20on%20Policing%20&%20Economy_908860847_22200<br />
9153254.pdf<br />
103 Energy Watch Group, Crude <strong>Oil</strong>: The Supply Outlook (2007).<br />
http://www.energywatchgroup.org/fileadmin/global/pdf/EWG_<strong>Oil</strong>report_10‐2007.pdf<br />
<strong>Report</strong> <strong>of</strong> the <strong>Bloomington</strong> <strong>Peak</strong> <strong>Oil</strong> <strong>Task</strong> <strong>Force</strong><br />
66
4. <strong>Peak</strong> oil will likely present additional fire safety concerns.<br />
It is likely that as oil becomes more and more expensive, some residents might try to hoard<br />
gasoline – a practice that presents serious safety risks. It is also expected that, as electricity<br />
and gas become more expensive, more residents will turn to heating their homes with<br />
wood and biomass. Gasoline hoarding and heating with biomass will call for more fire<br />
suppression and will require the Fire Department to engage in even more fire‐safety<br />
community awareness efforts.<br />
MITIGATION GOALS & STRATEGIES<br />
SHORTTERM (15 years)<br />
1. Priority should be granted to Police and Fire in adding new staff to the <strong>City</strong>.<br />
2. The <strong>City</strong> should develop a fuel allocation plan wherein, in the event <strong>of</strong> a fuel<br />
shortage, the Police and Fire Departments are given greatest priority.<br />
3. The <strong>City</strong> should plan for shortages and supply disruptions and transition<br />
backup generators away from diesel fuel.<br />
4. Anticipating a period <strong>of</strong> growing social problems, the Police Department<br />
should work with Neighborhood Associations to develop neighborhood<br />
patrols.<br />
5. The Police Department should continue to invest in bicycles, neighborhood<br />
electric vehicles, etc. and should consider the use <strong>of</strong> horse patrols where<br />
appropriate.<br />
6. Anticipating more fuel hoarding and nonconventional home heating<br />
practices, the Fire Department should provide community outreach on the<br />
dangers <strong>of</strong> hoarding and how to practice safe home heating using biomass.<br />
7. The Fire Department should investigate to what extent the fire trucks could be<br />
retr<strong>of</strong>itted to run on B100. B100 holds the possibility <strong>of</strong> fueling fire trucks by<br />
use <strong>of</strong> locallyderived lipids such as restaurant grease. 104<br />
104 The National Biodiesel Board advises that “high percent blends can impact fuel system components<br />
(primarily fuel hoses and fuel pump seals) that contain compounds incompatible with B100. Manufacturers<br />
recommend that natural or butyl rubbers not be allowed to come in contact with pure biodiesel or biodiesel<br />
blends higher than B20. Over the past 15 years <strong>of</strong> use, blends <strong>of</strong> B20 or lower have not exhibited problematic<br />
<strong>Report</strong> <strong>of</strong> the <strong>Bloomington</strong> <strong>Peak</strong> <strong>Oil</strong> <strong>Task</strong> <strong>Force</strong><br />
67
MEDIUMTERM (515 years)<br />
1. The Police Department should consider ways in which it might transition<br />
pursuit vehicles away from fossil fuel reliance.<br />
Most patrol cars used by the <strong>City</strong> are Ford Crown Victoria models. The <strong>City</strong> should explore<br />
pursuit cars that are not reliant on fossil fuels. While we’ve described why biodiesel is not a<br />
remedy for the advent <strong>of</strong> peak oil, we will have to look toward interim remedies that help<br />
us bridge the gap to energy independence. The BPD could reduce its reliance on petroleum<br />
by shifting in the short‐term to a biodiesel pursuit vehicle. For example, Carbon Motors<br />
<strong>of</strong>fers a full‐spec pursuit car that can run on biodiesel.<br />
2. The Police Department should replace a number <strong>of</strong> patrol cars with electric cars.<br />
There are few locations in the city where a high‐speed chase is likely to occur. As part <strong>of</strong><br />
the shift away from car culture, streets could be made unsafe for vehicular traffic above a<br />
certain speed (for example, 35 miles‐per‐hour). Traffic calming, narrower roads, more<br />
pedestrian‐friendly roads, and a denser settlement pattern will make automotive hijinks<br />
rather difficult and far less likely. Small electric patrol vehicles might be adequate when<br />
combined with a few big cruisers and coordination with the Monroe County Sheriff’s<br />
Department.<br />
3. Provide additional first responders and EMTs.<br />
As most <strong>of</strong> the Fire Department’s calls are for medical events, it may be prudent to add<br />
more first responders and EMTs staff and to purchase an energy‐efficient dual‐use<br />
fire/EMT vehicle that runs on biodiesel or another non‐fossil fuel.<br />
elastomer degradation and no changes are recommended. If a fuel system does contain these materials and<br />
users wish to fuel with blends over B20, replacement with compatible elastomers is needed.” Guidance on<br />
Blends Above B20, http://www.biodiesel.org/pdf_files/Biodiesel_Blends_Above%20_20_Final.pdf.<br />
<strong>Report</strong> <strong>of</strong> the <strong>Bloomington</strong> <strong>Peak</strong> <strong>Oil</strong> <strong>Task</strong> <strong>Force</strong><br />
68
LONGTERM (1530 years)<br />
1. Implement neighborhood police stations rather than one, centralized station.<br />
Neighborhood police stations have the potential not only to decrease the response time for<br />
emergency and non‐emergency calls, but also would enable local residents to become more<br />
involved. Cities where neighborhood‐sited police stations have been successfully<br />
implemented include Oakland, Chicago, and Boston. 105<br />
2. Electric fire engines are still largely in development. However, as they are<br />
perfected and become affordable, the <strong>City</strong> should explore this option.<br />
105 For example, with Chicago’s CAPS (Chicago's Alternative Policing Strategy) the entire Police Department<br />
is being decentralized to the neighborhood level. See, <strong>City</strong> <strong>of</strong> Chicago’s CAPS. See further, CAPS at Ten:<br />
Community Policing in Chicago An Evaluation <strong>of</strong> Chicago's Alternative Policing Strategy, a ten‐year evaluation<br />
<strong>of</strong> the program.<br />
<strong>Report</strong> <strong>of</strong> the <strong>Bloomington</strong> <strong>Peak</strong> <strong>Oil</strong> <strong>Task</strong> <strong>Force</strong><br />
69
OTHER EMERGENCY SERVICES<br />
Non‐routine emergency services are provided by the Monroe County Emergency<br />
Management Agency (MCEMA). As required by <strong>State</strong> statute, the Agency is charged with<br />
establishing and maintaining “a progressive emergency management program that<br />
promotes the mitigation <strong>of</strong>, preparation for, the response to and recovery from<br />
emergencies and disasters impacting the public, government, and business <strong>of</strong> the<br />
communities <strong>of</strong> Monroe County.” This program is mapped out in the Monroe County<br />
Comprehensive Emergency Management Plan. 106<br />
As spelled out in its “Situation and Assumptions” section, the Plan anticipates the following<br />
hazards: floods, winter storms, tornadoes, earthquakes, terrorism, and hazardous materials<br />
releases on transportation corridors or at a facility. 107 These are the hazards anticipated in<br />
emergency planning, which assumes:<br />
• The event will be localized, so that the community can rely on outside<br />
assistance within a relatively short amount <strong>of</strong> time; and<br />
• That the goal is to minimize damage and maximize recoverability to predisaster<br />
conditions as quickly as possible.<br />
VULNERABILITY<br />
With a decline in cheap oil, there will not be a tidy return to “pre‐disaster” conditions.<br />
Because our reliance on petroleum is systemic, planning for peak oil is planning for a long<br />
emergency. 108 Reliance on fossil fuel for back‐up generators for vital communications and<br />
other functions would be a long‐term vulnerability. The County Emergency Management<br />
Agency should plan for supply interruptions and shortages.<br />
106 Monroe County Comprehensive Emergency Management Plan, Basic Plan, (2003).<br />
107 Ibid, 4.<br />
108 The term “long emergency” is borrowed from the book by James Kunstler, The Long Emergency: Surviving<br />
the Converging Catastrophes <strong>of</strong> the Twentyfirst Century (Grove/Atlantic, 2005). The book explores the effects<br />
<strong>of</strong> peak oil on society. The book points out that a post‐peak world will force us all to live in more localized,<br />
self‐sufficient communities.<br />
<strong>Report</strong> <strong>of</strong> the <strong>Bloomington</strong> <strong>Peak</strong> <strong>Oil</strong> <strong>Task</strong> <strong>Force</strong><br />
70
MITIGATION GOAL<br />
SHORTTERM (15 years)<br />
1. Plan for the Long Emergency<br />
We suggest that MCEMA integrate planning for peak oil into its plan to ensure that power<br />
and fuel required for maintaining services is available without the expectation <strong>of</strong> outside<br />
assistance. In the long emergency, mitigation, response, and recovery should be powered<br />
by local renewable sources.<br />
<strong>Report</strong> <strong>of</strong> the <strong>Bloomington</strong> <strong>Peak</strong> <strong>Oil</strong> <strong>Task</strong> <strong>Force</strong><br />
71
FLEET & STREET:<br />
CARBON WEBS & ASPHALT CONNECTIONS<br />
The <strong>City</strong>’s reliance on petroleum is most immediately apparent in the operation <strong>of</strong> its fleet<br />
and the paving and maintenance <strong>of</strong> its streets. The <strong>City</strong>’s Fleet and Street Divisions have<br />
implemented laudable conservation and efficiency improvements to reduce reliance on<br />
petroleum. However, peak oil means that the provision <strong>of</strong> these services will become<br />
increasingly expensive. Congruent with the <strong>City</strong>’s commitment to reducing greenhouse gas<br />
emissions, peak oil provides the <strong>City</strong> with the opportunity to think through new ways to<br />
provide for safe streets and an efficient fleet while reducing our reliance on fossil fuels.<br />
THE MUNCIPAL FLEET<br />
The <strong>City</strong>’s fleet is composed <strong>of</strong> 466 vehicles and equipment: 235 unleaded<br />
vehicles 109 (including four hybrids), 115 diesel vehicles and one electric GEM car used by<br />
the <strong>City</strong>’s Downtown Specialist. It owns 85 pieces <strong>of</strong> diesel equipment, 20 pieces <strong>of</strong><br />
equipment using unleaded fuel, 5 electric and 5 propane pieces. 110 Since 2005, the <strong>City</strong> has<br />
abided by a biodiesel‐only purchasing policy for its 200 diesel‐powered cars and<br />
equipment. The <strong>City</strong> uses these vehicles for police and fire<br />
protection; for enforcement <strong>of</strong> the <strong>Bloomington</strong> Municipal<br />
Code (parking enforcement, zoning compliance, housing<br />
and neighborhood inspection); for maintaining parks,<br />
trails, the golf course, and other recreational facilities and<br />
programs; for street and sidewalk repair and<br />
maintenance; and for taking care <strong>of</strong> the city’s water and<br />
wastewater needs.<br />
<strong>Report</strong> <strong>of</strong> the <strong>Bloomington</strong> <strong>Peak</strong> <strong>Oil</strong> <strong>Task</strong> <strong>Force</strong><br />
The <strong>City</strong>’s allelectric GEM car<br />
109 <strong>City</strong> Fleet advises that only 25 cars are flex‐fuel capable; the rest <strong>of</strong> the fleet cannot be “retr<strong>of</strong>itted” for<br />
flex‐fuel capacity.<br />
110 The following numbers reflect all vehicles and fuel‐powered equipment attributed to each department:<br />
Police (45), Public Works (6), Engineering (11), Housing & Neighborhood Development (9), Parking<br />
Enforcement (4), Planning (2), Risk Management (2), Traffic (9), Fire (23), Fleet Maintenance (5), Street (96),<br />
Utilities (169), Parks and Recreation (85), the Animal Shelter (3), Sanitation (17), and Information &<br />
Technology Services (2).<br />
72
The <strong>City</strong> owns a total <strong>of</strong> six fuel tanks: three unleaded tanks that have a capacity <strong>of</strong> 10,000<br />
gallons each and three diesel tanks – two with a capacity <strong>of</strong> 10,000 gallons each and one<br />
with a capacity <strong>of</strong> 2,000 gallons. As these tanks can only be filled to 90% capacity, the <strong>City</strong><br />
has storage capacity for approximately 27,000 gallons <strong>of</strong> unleaded fuel and 19,800 <strong>of</strong> diesel<br />
fuel. Fleet purchases an average <strong>of</strong> 8,500 gallons <strong>of</strong> unleaded fuel and 7,500 gallons <strong>of</strong><br />
biodiesel each month. The <strong>City</strong> has contracts with three providers for unleaded fuel and<br />
two providers for biodiesel. In the event <strong>of</strong> a fuel shortage, the <strong>City</strong> is considered a<br />
“priority customer” and would receive first opportunity to claim fuel.<br />
Over the last number <strong>of</strong> years, the <strong>City</strong> has experienced an appreciable increase in the cost<br />
<strong>of</strong> fuel even though the gallons consumed have variously decreased or remained constant.<br />
From 2003 to 2008, the unleaded fuel costs to the <strong>City</strong> increased 130% while the cost <strong>of</strong><br />
diesel increased 177%. 111<br />
Year Unleaded Gallons Unleaded Cost Diesel Gallons Diesel Cost<br />
Purchased<br />
Purchased<br />
2003 169,974 $203,720.47 118,368 $129,847.67<br />
2004 170,797 $256,439.92 119,795 $167,175.36<br />
2005 159,573 $312,295.19 108,563<br />
(biodiesel)<br />
$220,910.97<br />
2006 156,831 $349,444.10 109,036<br />
(biodiesel)<br />
$255,217.04<br />
2007 154,764 $377,731.50 116,829<br />
(biodiesel)<br />
$296,984.55<br />
2008 162,590 $467,872.85 102,121<br />
(biodiesel)<br />
$359,016.52<br />
As a result <strong>of</strong> the oil spike <strong>of</strong> summer 2008, the amount budgeted for fuel in 2009 increased<br />
by almost 20%, from $679,091 to $810,791. Meanwhile, the percentage <strong>of</strong> the overall <strong>City</strong><br />
budget claimed by fuel has doubled over the last six years: in 2003, fuel constituted 0.63%<br />
<strong>of</strong> the entire <strong>City</strong> budget; in 2009 fuel comprises 1.32% <strong>of</strong> the budget.<br />
111 In 2005 the <strong>City</strong> began buying only biodiesel to power its diesel vehicles and equipment. Note that Fleet<br />
does not currently track the total number <strong>of</strong> miles driven.<br />
<strong>Report</strong> <strong>of</strong> the <strong>Bloomington</strong> <strong>Peak</strong> <strong>Oil</strong> <strong>Task</strong> <strong>Force</strong><br />
73
In an effort to save money, reduce reliance on petroleum and to reduce the <strong>City</strong>’s carbon<br />
emissions, many <strong>City</strong> departments have already implemented some forward‐thinking<br />
measures to reduce the <strong>City</strong>’s reliance on liquid fuels. For example, the <strong>City</strong> has purchased<br />
four hybrid cars and one electric car, all departments have implemented “no idle” policies,<br />
suppliers travel to the <strong>City</strong> for re‐stocking, most enforcement departments have greatly<br />
consolidated their trips (now most inspection is based on location rather than inspecting a<br />
complaint as soon as it is lodged), departments encourage carpooling, the acreage <strong>of</strong> turf<br />
mowed in <strong>City</strong> parks has been reduced, experiments with “low‐mow” or “no‐mow” grasses<br />
have been conducted, and energy‐efficient maintenance equipment has been purchased.<br />
Importantly, the <strong>City</strong> has established an internal working group, Team Process, to audit the<br />
current fleet and develop a vehicle replacement plan.<br />
<strong>Report</strong> <strong>of</strong> the <strong>Bloomington</strong> <strong>Peak</strong> <strong>Oil</strong> <strong>Task</strong> <strong>Force</strong><br />
74
VULNERABILITIES<br />
While the <strong>City</strong> staff has taken impressive measures to reduce the <strong>City</strong>’s consumption <strong>of</strong> oil,<br />
the <strong>City</strong> <strong>of</strong> <strong>Bloomington</strong> is just as vulnerable to a decline in cheap oil as its residents.<br />
1. Without mitigation, increased costs to operate <strong>City</strong> vehicles could throw the<br />
<strong>City</strong> into a deficit and would require it to reduce its services.<br />
When each department was asked how it would respond if required to cut its fuel usage by<br />
50%, all departments indicated that, without mitigation, a 50% reduction in fuel use would<br />
translate into substantial reduction in services.<br />
2. Vehicle maintenance would be compromised in the interest <strong>of</strong> emergencyonly<br />
repairs.<br />
3. For Code enforcement operations, the <strong>City</strong> can anticipate a loss <strong>of</strong> revenue.<br />
From 2006‐2008, the <strong>City</strong> received an average <strong>of</strong> $1,050,774 in fines per year. The bulk <strong>of</strong><br />
these fines derive from the enforcement <strong>of</strong> the <strong>City</strong>’s parking rules: in this time frame, the<br />
<strong>City</strong> received an average <strong>of</strong> $827,500 from the payment <strong>of</strong> parking tickets alone. As the<br />
enforcement <strong>of</strong> parking rules becomes more expensive and as residents increasingly are<br />
unable to drive nearly as much, the <strong>City</strong> will likely experience a marked decrease in this<br />
source <strong>of</strong> revenue.<br />
4. The <strong>City</strong> currently employs 692 fulltime employees and 200 temporary<br />
employees. Sustained and serious fuel shortages or price increases will<br />
impact the availability <strong>of</strong> commuting employees.<br />
<strong>Report</strong> <strong>of</strong> the <strong>Bloomington</strong> <strong>Peak</strong> <strong>Oil</strong> <strong>Task</strong> <strong>Force</strong><br />
75
MITIGATION GOALS & STRATEGIES<br />
SHORTTERM STRATEGIES (15 years)<br />
1. Establish an emergency fuel reserve to prepare for a fuel shortage.<br />
The <strong>City</strong> should shift its practices to maintain an emergency reserve <strong>of</strong> fuel (beyond that<br />
which it already maintains for daily use) in the event <strong>of</strong> a shortage and/or drastic price<br />
increase.<br />
2. Establish a measurable goal for reducing total vehicle miles driven.<br />
Toward that end, the <strong>City</strong> should start tracking total miles driven on each vehicle.<br />
3. Encourage Team Process to develop a plan for a Model <strong>City</strong> Green Fleet.<br />
As the <strong>City</strong>’s Team Process examines and audits the current <strong>City</strong> fleet and prioritizes<br />
acquisition, it should do so with an eye to discerning which vehicles might be eliminated<br />
and how we might maximize fuel efficiency in the short term. In the long term, the <strong>City</strong><br />
should transition its fleet away from reliance on fossil fuels. Some ideas Team Process<br />
might pursue include: reducing the size <strong>of</strong> the <strong>City</strong> fleet through partnerships with car<br />
sharing groups (this might be a consortium <strong>of</strong> <strong>City</strong>, County, the schools, and IU) and<br />
requiring best‐in‐class purchases, with priority given to electric and plug‐in hybrid electric<br />
vehicles as appropriate<br />
4. Encourage use <strong>of</strong> more bicycles, Segways, motorized bikes, and electric cars<br />
in code enforcement, where feasible.<br />
5. Establish a <strong>City</strong> bicycle fleet<br />
Institute a <strong>City</strong> bicycle fleet so that <strong>City</strong> employees have the option to ride a <strong>City</strong> bicycle<br />
rather than drive a <strong>City</strong> vehicle. Currently, the <strong>City</strong>’s Parking Enforcement Division owns<br />
two bicycles for use by two <strong>of</strong> its nine enforcement <strong>of</strong>ficers. Each employee using such a<br />
program would likely have to have her/his own helmet. While liability concerns may arise<br />
from such a proposal, it should be noted both that employees already <strong>of</strong>ten walk or ride<br />
their own bikes for <strong>City</strong> business where appropriate and that many other municipalities<br />
<strong>Report</strong> <strong>of</strong> the <strong>Bloomington</strong> <strong>Peak</strong> <strong>Oil</strong> <strong>Task</strong> <strong>Force</strong><br />
76
successfully maintain a bicycle fleet for employees and have addressed liability concerns. 112<br />
Establishing a <strong>City</strong> bicycle fleet would help the <strong>City</strong> prepare for peak oil while reducing the<br />
community’s greenhouse gas emission and improving employee wellness.<br />
6. Direct departments to develop fuelreduction implementation plans.<br />
All <strong>City</strong> departments are already engaging in laudable efforts to reduce their reliance on oil;<br />
however, we can do more. All <strong>City</strong> departments should outline a plan to achieve a 50%<br />
reduction in petroleum consumption by 2024.<br />
7. Carpooling incentives.<br />
While the <strong>City</strong> has established an electronic carpooling “match” system, to date it appears<br />
to be only very lightly used, if at all. The <strong>City</strong> should establish some sort <strong>of</strong> reward for those<br />
who choose to carpool, e.g, gas cards, bonuses for three or more employees in one car, free<br />
oil changes, etc.<br />
8. Pay for parking.<br />
Currently, <strong>City</strong> employees pay $2 for an annual parking permit. The <strong>City</strong> should explore a<br />
sliding scale permit system under which higher wage earners pay more to park. This<br />
should be a progressive measure, not one that burdens low‐earning employees. Money<br />
collected from this program could be used to pay for the carpooling incentives mentioned<br />
above or for other employee rewards for sustainable practices.<br />
9. The <strong>City</strong> should implement onedayaweek telecommuting options for nonmanual<br />
work employees where appropriate.<br />
As discussed in the Transportation chapter, almost half <strong>of</strong> <strong>Bloomington</strong> workers reported<br />
spending between 10 and 19 minutes getting to work daily. Between 1990 and 2000, the<br />
portion <strong>of</strong> workers with commutes less than 10 minutes declined by 4%. Excluding<br />
112 Examples <strong>of</strong> municipally-owned bicycle fleets include: San Francisco, CA; Berkeley, CA; Tucson, AZ; Houston,<br />
TX; Louisville, KY; and Minneapolis, MN.<br />
<strong>Report</strong> <strong>of</strong> the <strong>Bloomington</strong> <strong>Peak</strong> <strong>Oil</strong> <strong>Task</strong> <strong>Force</strong><br />
77
esidents who work from home, however, this group declined by 6%. Meanwhile, the<br />
portion <strong>of</strong> workers with commutes between 20 to 44 minutes increased by 10%. 113<br />
The <strong>City</strong> should seriously examine a telecommuting policy wherein employees are<br />
encouraged to work from home once a week, if appropriate to their duties. A number <strong>of</strong><br />
municipalities have already implemented such policies. 114 Not only does such a policy<br />
reduce the <strong>City</strong>’s reliance on petroleum to get employees to work, but it also decreases the<br />
<strong>City</strong>’s electricity consumption and reduces greenhouse gas emissions while improving<br />
employee morale and retention. 115<br />
10. The <strong>City</strong> should explore a fourday work week.<br />
Both the <strong>City</strong>’s Sanitation Division and the Monroe County Highway Department have<br />
moved to four‐day work weeks in an effort to save fuel. The <strong>City</strong> should identify positions<br />
for which such a configuration might make sense. If paired with some form <strong>of</strong><br />
telecommuting, this promises to substantially reduce employee drive time.<br />
11. Seek assistance with park maintenance from volunteers, neighborhood<br />
associations, etc.<br />
This would reduce the number <strong>of</strong> vehicles travelling to parks to mow and maintain<br />
facilities. The <strong>City</strong> might begin such an initiative with a few AdoptaPark trial runs to<br />
assess how such volunteer provisioning would best work.<br />
113 2000 US Census.<br />
114 Examples include San Francisco, San Diego, Portland, OR; Atlanta; Virginia Beach, VA; and Denver, CO.<br />
Indeed, US cities have experienced high growth in rates <strong>of</strong> telecommuting to work from 2006 to 2007, most likely a<br />
direct impact from rising fuel prices. Oakland had the highest telecommuting rate, at 7.6% in 2007, while six US<br />
cities—San Francisco, San Diego, Portland, OR; Atlanta; Virginia Beach and Denver‐‐had more than 5% <strong>of</strong> their total<br />
workforce being primarily home based. Karlenzig, Major US <strong>City</strong> Post<strong>Oil</strong> Preparedness Ranking Which Cities and<br />
Metro Areas are Best or Least Prepared for Price Volatility, Supply Shocks and Climate Change Regulations?<br />
http://www.commoncurrent.com/pubs/MajorUS<strong>City</strong>Post‐<strong>Oil</strong>PreparednessRanking.pdf<br />
115 Ravi S. Gajendran and Harrison, David A, “The Good, the Bad, and the Unknown about Telecommuting:<br />
Meta‐analysis <strong>of</strong> Psychological Mediators and Individual Consequences,” Journal <strong>of</strong> Applied Psychology, 92(6)<br />
(November 2007): 1524‐1541.<br />
<strong>Report</strong> <strong>of</strong> the <strong>Bloomington</strong> <strong>Peak</strong> <strong>Oil</strong> <strong>Task</strong> <strong>Force</strong><br />
78
MEDIUMTERM GOALS & STRATEGIES (515 years)<br />
1. Reduce the size <strong>of</strong> the <strong>City</strong> fleet by at least 25% though partnerships with carsharing<br />
groups.<br />
Many communities have successfully implemented such programs. For example, the <strong>City</strong> <strong>of</strong><br />
Philadelphia has a municipal fleet <strong>of</strong> approximately 6,000 vehicles and joined with the<br />
PhillyCarShare 116 , the community’s non‐pr<strong>of</strong>it car sharing service in 2004. 117 This was the<br />
first system worldwide in which government employees and local resident shared vehicles<br />
by the hour in a major effort to reduce the number <strong>of</strong> vehicles in the community. Within the<br />
space <strong>of</strong> four years, the project helped the <strong>City</strong> <strong>of</strong> Philadelphia eliminate 330 vehicles and<br />
save taxpayers almost $2 million annually. See the Transportation chapter for more details<br />
on car sharing.<br />
2. Implement a pilot GreasetoBi<strong>of</strong>uel Program whereby the <strong>City</strong> <strong>of</strong>fers local<br />
restaurants free vegetable oil collection for processing into biodiesel to fuel<br />
the <strong>City</strong> fleet.<br />
Communities such as San Francisco 118 and Seattle have started to leverage restaurant<br />
grease to fuel municipal vehicles as concern over the environmental harm <strong>of</strong> soy biodiesel<br />
mounts. 119 As discussed elsewhere, this would divert harmful fats, oil, and grease away<br />
from the <strong>City</strong>’s sewer system.<br />
LONGTERM GOAL (1530 years)<br />
1. Realize a Model <strong>City</strong> Fleet.<br />
All <strong>City</strong> vehicles, especially emergency vehicles, should be transitioned away from fossil‐<br />
fuel reliance.<br />
116 http://www.phillycarshare.org/.<br />
117 http://www.mayorsinnovation.org/pdf/PhiladelphiaFleetManagement.pdf; The <strong>City</strong>’s effort landed it as a 2006<br />
finalist for Harvard’s Innovations in Government Award<br />
http://www.innovations.harvard.edu/awards.html?id=15709<br />
118 San Francisco’s initiative can be found here: http://www.sfgreasecycle.org/thedish.shtml. Converting<br />
grease into bi<strong>of</strong>uel requires some processing including filtering, settling and decanting. If the <strong>City</strong> led the way<br />
in creating a demand for such product, it could help foster a whole new local green industry.<br />
119 In May 2009, Seattle mayor Greg Nickels directed the Seattle Fleet department to stop buying soy biodiesel<br />
after the EPA issued a report stating that ethanol production was potentially worse for the environment than<br />
gasoline. Chris Grygiel, “<strong>City</strong> <strong>of</strong> Seattle Halts Biodiesel Purchases, Looks for Greener Fuel,” Seattle Post<br />
Intelligencer, June 19, 2009.<br />
<strong>Report</strong> <strong>of</strong> the <strong>Bloomington</strong> <strong>Peak</strong> <strong>Oil</strong> <strong>Task</strong> <strong>Force</strong><br />
79
MAINTAINING CITY STREETS<br />
Everything we do relies on oil. 120<br />
– Bobby Chestnut, Street Commissioner, <strong>City</strong> <strong>of</strong> <strong>Bloomington</strong> Street Division<br />
The <strong>City</strong>’s Street Division provides maintenance and repair for <strong>Bloomington</strong>’s 237 miles <strong>of</strong><br />
streets. Its functions primarily include: street resurfacing, the repair and construction <strong>of</strong><br />
sidewalks and curbs, snow removal, street sweeping, and leaf collection. In 2006, the <strong>City</strong><br />
paved 2.5 million square feet <strong>of</strong> streets; in 2007, it paved 1.5 million square feet and in<br />
2008, it paved 906,710. In 2009, it is scheduled to pave a little over 1 million square feet.<br />
The Street Division has used a petroleum‐based asphalt for the last 35 years. This is a<br />
product with a life span <strong>of</strong> 3‐4 years. The <strong>City</strong> repaves according to a plan that calls for<br />
paving all arterial streets every ten years, all collector streets every 12 years, and all local<br />
streets every 20 years.<br />
The price <strong>of</strong> asphalt is closely connected to the price <strong>of</strong> oil. Asphalt paving materials consist<br />
<strong>of</strong> a mix <strong>of</strong> aggregate (stone), sand or gravel and crude refined bitumen, also called “liquid<br />
asphalt.” Liquid asphalt is a sticky black residual obtained from the refining <strong>of</strong> crude oil and<br />
acts as the binding agent for asphalt. Since liquid asphalt is a residual from crude oil<br />
refining, as oil prices rise, liquid asphalt prices increase. According to the Bureau <strong>of</strong> Labor<br />
Statistics, the price <strong>of</strong> liquid asphalt has increased 250% during the past five years. This<br />
price increase has led to a doubling <strong>of</strong> total asphalt paving costs. 121<br />
120 Boyd, James, “Police Agencies Cutting Gas Use a Prices Rise <strong>Bloomington</strong> Police, Monroe Sheriff’s Office<br />
Finding Ways to Save,” <strong>Bloomington</strong> Herald Times, May 28, 2008.<br />
121 http://www.bls.gov/<br />
<strong>Report</strong> <strong>of</strong> the <strong>Bloomington</strong> <strong>Peak</strong> <strong>Oil</strong> <strong>Task</strong> <strong>Force</strong><br />
80
The <strong>City</strong> has been adversely affected by<br />
this marked upswing in asphalt prices. In<br />
2006 the <strong>City</strong> paid $27.90/ton; in 2007,<br />
$33.65/ton; in 2008, $32.15/ton; and in<br />
2009, $48.25/ton. 122 In 2008, the Street<br />
Division used 20,000 tons <strong>of</strong> asphalt.<br />
<strong>Bloomington</strong> has one asphalt plant.<br />
The Street Division has worked to extend<br />
the life <strong>of</strong> existing roads and mitigate the need for repaving by using an asphalt compound<br />
sealant. The sealant extends the life <strong>of</strong> the road by 3‐5 years.<br />
VULNERABILITY<br />
While the Street Division has made impressive efforts to reduce its consumption <strong>of</strong> asphalt<br />
by recycling the asphalt on projects where the <strong>City</strong> mills existing road, the Division is<br />
nevertheless very exposed to volatile and increasing asphalt prices.<br />
MITIGATION GOALS & STRATEGIES<br />
SHORT TERM (15 Years)<br />
1. Explore mixes that require less energy to produce, can use a greater<br />
percentage <strong>of</strong> recycled asphalt and are longer lived.<br />
2. Explore the use <strong>of</strong> bioasphalt made from bitumen and other nonpetroleum<br />
based paving materials such as Road Oyl, a biobased binder that is an<br />
emulsion <strong>of</strong> half water and half pine resin and pitch. 123<br />
3. Explore the use <strong>of</strong> brick or stone pavement, where appropriate.<br />
4. Instead <strong>of</strong> a paving plan whereby every inch <strong>of</strong> every street is repaved within<br />
10, 15, or 20 years, prioritize major arterials and tend to others on an “as<br />
needed” basis. As private automobile traffic dissipates, it is unlikely that such<br />
an aggressive repaving plan will be necessary.<br />
122 Asphalt is bid out at the beginning <strong>of</strong> the year for that year’s paving season.<br />
123 http://www.gtkp.com/uploads/public/documents/Knowledge/Eco‐road%20Technologies%20Review‐<br />
a.pdf; http://www.sspco.org/naturalpavexl/naturalpave_OV.html<br />
<strong>Report</strong> <strong>of</strong> the <strong>Bloomington</strong> <strong>Peak</strong> <strong>Oil</strong> <strong>Task</strong> <strong>Force</strong><br />
81
MEDIUM TERM (515 Years)<br />
1. Reduce road width where appropriate (See Transportation chapter).<br />
LONG TERM (1530 Years)<br />
1. Lowuse roads might safely be transitioned to gravel, dirt, or other nonfossil<br />
fuel materials.<br />
<strong>Report</strong> <strong>of</strong> the <strong>Bloomington</strong> <strong>Peak</strong> <strong>Oil</strong> <strong>Task</strong> <strong>Force</strong><br />
82
CITY BUILDINGS<br />
VULNERABILITY<br />
Buildings account for 72 percent <strong>of</strong> all electricity consumption and 39 percent <strong>of</strong> all energy<br />
consumption. 124 This <strong>Report</strong> has already discussed the grid’s age and its reliance on oil. The<br />
<strong>City</strong> has done much to make its buildings more efficient – upgrading the HVAC system in<br />
<strong>City</strong> Hall to use 15% less energy, installing LED traffic lights, installing low‐flow sensored<br />
water faucets, and passing the <strong>City</strong>’s Green Building Ordinance. All these efforts are vital to<br />
reducing the <strong>City</strong>’s reliance on the grid, but we can do even more.<br />
MITIGATION GOALS & STRATEGIES<br />
SHORT TERM (15 Years)<br />
1. All backup generators for all <strong>City</strong> buildings should be transitioned away from<br />
diesel fossil fuel reliance, with the Police and Fire Departments to receive<br />
priority.<br />
2. Implement the Green Building Ordinance with a focus on energysaving,<br />
passive measures.<br />
In early 2009, the <strong>City</strong> passed a long‐awaited Green Building Ordinance requiring that all<br />
new construction and major renovation <strong>of</strong> occupiable <strong>City</strong> buildings be designed,<br />
contracted and built to achieve, at minimum, the U.S. Green Building Council’s LEED ® Silver<br />
level <strong>of</strong> certification. The ordinance also calls for retr<strong>of</strong>itting existing buildings where said<br />
building can meet a 10‐year payback period. This is an important start to fostering<br />
sustainable building standards. However, LEED standards do not always address peak oil<br />
concerns, as many <strong>of</strong> the LEED features are not particularly relevant to a building’s energy<br />
use.<br />
124 U.S. Green Building Council, Green Building Research,<br />
http://www.usgbc.org/DisplayPage.aspx?CMSPageID=1718<br />
<strong>Report</strong> <strong>of</strong> the <strong>Bloomington</strong> <strong>Peak</strong> <strong>Oil</strong> <strong>Task</strong> <strong>Force</strong><br />
83
As summarized by Pat Murphy in Plan C:<br />
[P]lacing a bike rack near the building earns one point, which is the same<br />
value earned if 5% <strong>of</strong> the building’s energy comes from renewable sources.<br />
Likewise, installing a metal grate at the entrance to reduce particle count<br />
earns one point while increasing energy efficiency, which might cost tens <strong>of</strong><br />
thousands <strong>of</strong> dollars, only earns two points. 125<br />
In implementing its Green Building Ordinance, the <strong>City</strong> should prioritize energy‐saving<br />
measures, particularly passive measures (those that require no on‐going energy use).<br />
These include insulation, efficient windows, weather stripping, natural ventilation, passive<br />
solar, and the planting <strong>of</strong> deciduous foliage on the south and west sides <strong>of</strong> buildings. Such<br />
measures not only save energy and money, but continue to work even in the event <strong>of</strong><br />
power outages or rolling black‐ and brownouts.<br />
125 Murphy, Pat. Plan C: Community Survival Strategies for <strong>Peak</strong> <strong>Oil</strong> and Climate Change (New Society<br />
Publishers: Gabriola Island, Canada, 2008).<br />
<strong>Report</strong> <strong>of</strong> the <strong>Bloomington</strong> <strong>Peak</strong> <strong>Oil</strong> <strong>Task</strong> <strong>Force</strong><br />
84
CITY REVENUE<br />
As has been documented elsewhere in this <strong>Report</strong>, high gas prices have translated into<br />
reduced demand. With demand destruction comes lower gasoline tax revenue. <strong>Indiana</strong> is<br />
one <strong>of</strong> eight states with a gas tax in addition to the federal gas tax. 126 Revenue from the gas<br />
tax, vehicle registration fees, and other sources are pooled and distributed to state entities<br />
for maintenance and construction <strong>of</strong> highways and to local entities for maintenance <strong>of</strong><br />
roads and streets.<br />
Like other <strong>Indiana</strong> communities, <strong>Bloomington</strong> experienced a steady decline in revenue<br />
from these pooled “gas tax” sources from 2004‐2008. In 2004, the <strong>City</strong> received<br />
$2,774,033 from these sources – approximately 5.92% <strong>of</strong> <strong>City</strong> revenue. In 2008, funds from<br />
these sources totaled 2,481,648 (4.49% <strong>of</strong> total revenue) – a decrease in highway and gas‐<br />
sourced funds <strong>of</strong> approximately $292,000.<br />
VULNERABILITIES<br />
When the price <strong>of</strong> gasoline begins to rise again, we can expect a further decrease in<br />
demand. As demand decreases, we expect that this revenue source will continue to shrink.<br />
Fuel prices will also influence the ability <strong>of</strong> the <strong>City</strong> to assess fines. Approximately 2<br />
percent <strong>of</strong> the <strong>City</strong>’s budget relies on fines and forfeitures. As discussed above, the bulk <strong>of</strong><br />
these fines result from violations <strong>of</strong> the <strong>City</strong>’s parking rules. In 2008, parking citations<br />
accounted for $749,592.32 <strong>of</strong> the $1,068,000 in fines and forfeitures. As gas prices rise<br />
and community members increasingly walk, bike, or take public transit, it is anticipated<br />
that parking enforcement revenue will decrease appreciably. Similarly, ins<strong>of</strong>ar as staff is<br />
limited to foot or bicycle enforcement <strong>of</strong> all <strong>of</strong> its ordinances, it is expected that fines will<br />
decrease across the board.<br />
126 Currently, <strong>Indiana</strong>’s gas tax stands at 29.2 cents/gallon.<br />
<strong>Report</strong> <strong>of</strong> the <strong>Bloomington</strong> <strong>Peak</strong> <strong>Oil</strong> <strong>Task</strong> <strong>Force</strong><br />
85
MITIGATION GOALS & STRATEGIES<br />
SHORT TERM (15 Years)<br />
1. The <strong>City</strong> should consider the anticipated loss <strong>of</strong> “gasoline tax” and “fine and<br />
forfeiture” revenue in its budgeting process.<br />
2. <strong>City</strong> should add energy vulnerability scenarios to its departmental budgeting<br />
process.<br />
3. The <strong>City</strong> should set aside added reserves in a dedicated Energy Transition and<br />
Community Sustainability Fund to assist with funding necessary infrastructure<br />
and technology transition to cover increasing energy costs and increased<br />
investment in emergency and social services. To help build this reserve, the<br />
<strong>City</strong> should use price “lows” wisely by using current and any future price<br />
reductions (which will likely only be temporary) to redirect already budgeted<br />
higher fuel expenses into a special emergency fund (See Transportation<br />
chapter).<br />
<strong>Report</strong> <strong>of</strong> the <strong>Bloomington</strong> <strong>Peak</strong> <strong>Oil</strong> <strong>Task</strong> <strong>Force</strong><br />
86
THE BUILT ENVIRONMENT<br />
Energy consumption and the built environment are closely linked. Energy use shapes the<br />
way our communities are laid out, how we get from one place to another, and how we build<br />
our homes. In the U.S., the ubiquity <strong>of</strong> the personal automobile has reshaped our everyday<br />
lives such that we can live a considerable distance from work, the grocery store, the<br />
hardware store, and other necessities <strong>of</strong> life. Similarly, cheap energy has shaped the form<br />
and function <strong>of</strong> our homes: in general, we tend to live in houses that are too big and pretty<br />
inefficient. This section examines peak oil and the built environment through three lenses:<br />
land use, transportation, and housing. A decline in cheap oil will require that we rethink<br />
how we use our land, how we get from one place to another, and how we use energy in our<br />
homes. However, a resilient built environment promises to save both energy and money<br />
while enhancing individual and collective quality <strong>of</strong> life.<br />
<strong>Report</strong> <strong>of</strong> the <strong>Bloomington</strong> <strong>Peak</strong> <strong>Oil</strong> <strong>Task</strong> <strong>Force</strong><br />
87
<strong>Report</strong> <strong>of</strong> the <strong>Bloomington</strong> <strong>Peak</strong> <strong>Oil</strong> <strong>Task</strong> <strong>Force</strong><br />
LAND USE<br />
The cities will be part <strong>of</strong> the country; I shall live 30 miles from my <strong>of</strong>fice in one direction,<br />
under a pine tree; my secretary will live 30 miles away from it too, in the other direction,<br />
under another pine tree. We shall both have our own car.<br />
We shall use up tires, wear out road surfaces and gears, consume oil and gasoline.<br />
All <strong>of</strong> which will necessitate a great deal <strong>of</strong> work … enough for all.<br />
‐‐ Le Corbusier, The Radiant <strong>City</strong> (1967)<br />
The Human Scale<br />
Historically, our communities have been shaped by the mode <strong>of</strong> travel available to us.<br />
While horse, rail, and the street car allowed us to go further and faster than ever before, for<br />
most <strong>of</strong> human history we have lived our lives on a scale that was within walking distance.<br />
That is, we were able to meet our needs <strong>of</strong> daily life by walking to the grocery, to work, the<br />
hardware store, school, and other activities. This ambit wherein we meet most <strong>of</strong> our<br />
essential daily needs can be understood as the “human scale.”<br />
The Automotive Age<br />
The human scale was completely redefined with the advent <strong>of</strong> the personal automobile.<br />
Thanks to technological advances, the personal auto became much more commonplace<br />
after WWII. After the war, just about everyone owned a car. As the personal auto became<br />
the norm, it dramatically reconfigured the geographic space we could traverse in a day:<br />
people could easily live in one place, work in another, while shopping, schooling, and<br />
conducting all <strong>of</strong> the other aspects <strong>of</strong> daily life in equally distant places. 127 In turn, the<br />
ever‐increasing distances between home and the rest <strong>of</strong> life radically reshaped land use<br />
patterns.<br />
127 Real-estate interests reacted quickly and predictably, introducing the legal concept <strong>of</strong> zoning in order to place<br />
legal restrictions on what land use activities were allowed or prohibited. Originally sold to the public on the basis<br />
that these rules were a way to ensure that no slaughterhouse, refinery, factory, or prisons would, or could, be built in<br />
their residential neighborhoods, zoning became a powerful tool by which developers could guarantee infrastructure<br />
investments in their parcels while simultaneously vastly increasing the demand for land, thereby driving up its price.<br />
88
Spatial & Economic Dispersion<br />
The result was the unprecedented spatial expansion <strong>of</strong> the typical community and a vast<br />
increase <strong>of</strong> the human scale. Over time, as suburbs exploded around city cores, they<br />
drained those cores <strong>of</strong> residents. Inner cities became little more than employment centers<br />
or depressed quarters for those unable, financially, to escape them. Meanwhile, the<br />
suburbs developed a new, and heret<strong>of</strong>ore<br />
unique, arrangement whereby zoning<br />
forced land use into specialized pods such<br />
as residential, employment, or retail.<br />
These pods were separated by large<br />
distances and connected to each other via<br />
highways and arterial roads. The city’s<br />
dense and redundant web <strong>of</strong> street grids<br />
gave way to the suburbs’ sparse set <strong>of</strong><br />
connectors.<br />
The automobile‐enabled diaspora’s effects<br />
are felt most acutely by lower‐income<br />
earners. Without access to low‐cost transportation, such as pedestrian travel or public<br />
transit, lower‐income workers are forced to either take on the expense <strong>of</strong> automotive<br />
ownership ($5,000 a year for an average automobile 128 ) or restrict their employment<br />
opportunities. Because lower‐income workers are more likely to own older and less fuel<br />
efficient vehicles, the effects <strong>of</strong> fuel prices are particularly problematic for these workers. If<br />
a worker must make a twenty mile round‐trip commute from her place <strong>of</strong> residence to her<br />
place <strong>of</strong> employment and her vehicle averages twenty miles per gallon, then paying for<br />
gasoline alone will consume a significant portion <strong>of</strong> her income. At $5,000 a year for<br />
vehicle ownership, a laborer working a typical 2,000 hours/year must earn $2.50 an hour<br />
128 According to the American Automobile Association.<br />
<strong>Report</strong> <strong>of</strong> the <strong>Bloomington</strong> <strong>Peak</strong> <strong>Oil</strong> <strong>Task</strong> <strong>Force</strong><br />
Source: http://planning.city.cleveland.oh.us/cwp/landuse.htm<br />
89
just to cover the cost <strong>of</strong> vehicle maintenance, or 35 percent <strong>of</strong> the new minimum wage <strong>of</strong><br />
$7.25 an hour. 129<br />
In areas <strong>of</strong> the community developed prior to WWII, much <strong>of</strong> the infrastructure remains at<br />
a pedestrian human scale. Streets are narrow, sidewalks are walkable, and the distances to<br />
amenities and employment can be relatively short. Unfortunately, this is not true in newer<br />
areas.<br />
Macro‐level changes in the community have<br />
stripped older neighborhoods <strong>of</strong> their inherent<br />
self‐reliance. The school consolidation craze <strong>of</strong><br />
the 1960s onwards has largely rendered the<br />
concept <strong>of</strong> the neighborhood school moot. In<br />
1967, prior to consolidation, there were 23<br />
elementary schools in Monroe County (0.38 per<br />
capita <strong>of</strong> total elementary student school<br />
population). 130 Today there are 16 elementary schools (0.25 per capita <strong>of</strong> total elementary<br />
school population) 131 and only 9% <strong>of</strong> elementary students travel to school by foot. 132<br />
Likewise the neighborhood grocery has given over to the supermarket, and everything<br />
from hardware supplies to pharmacies has decamped from the older neighborhoods to the<br />
shopping centers and strip malls on the community’s periphery.<br />
129 The new minimum wage was effective July 24, 2009.<br />
130 Based on 1960 US Census data.<br />
<strong>Report</strong> <strong>of</strong> the <strong>Bloomington</strong> <strong>Peak</strong> <strong>Oil</strong> <strong>Task</strong> <strong>Force</strong><br />
The McCalla Elementary School on E. 9 th was decommissioned as<br />
part <strong>of</strong> school consolidation in 1967<br />
131 Based on 2000 US Census data. Total elementary school population in 1967 estimated to be 6,028; total<br />
elementary school population between both Monroe County School Corporation (MCCSC) and Richland‐Bean<br />
Blossom School Corporation(R‐BB) is 6,518.<br />
132 This figure only reflects elementary students within the MCCSC; it does not include students in the more<br />
rural R‐BB. Furthermore, the number reflects students who live within “non‐transported boundaries” (1.5<br />
miles) <strong>of</strong> the school. In 2008‐2009, approximately 5,138 elementary students were enrolled in MCCSC; 493 <strong>of</strong><br />
these students lived within non‐transported boundaries <strong>of</strong> the school. It is assumed that some students walk<br />
and bike, but that parents drive some <strong>of</strong> these students to school.<br />
90
Relocalization<br />
If the emergence <strong>of</strong> the personal automobile transformed the built environment into the<br />
shape we know today, then what effect will a<br />
decline in personal automobile use have on the<br />
built environment? It will be, in a word,<br />
relocalization. Instead <strong>of</strong> dispersed settlement<br />
patterns and concentrated pockets <strong>of</strong> commerce,<br />
neighborhoods will once again become areas <strong>of</strong><br />
community wherein most residents are able to<br />
meet their everyday needs by walking, biking, or<br />
taking public transit. As one observer puts it,<br />
“[t]he End <strong>of</strong> Suburbia could become the End <strong>of</strong> the<br />
Commute rather than the death <strong>of</strong> a<br />
neighborhood.” 133 However, relocalizing the community will require us to re‐think our<br />
built environment.<br />
<strong>Report</strong> <strong>of</strong> the <strong>Bloomington</strong> <strong>Peak</strong> <strong>Oil</strong> <strong>Task</strong> <strong>Force</strong><br />
Downtown <strong>Bloomington</strong><br />
133 Pat Murphy, Plan C: Community Survival Strategies for <strong>Peak</strong> <strong>Oil</strong> and Climate Change (Gabriola Island, BC:<br />
New Society Publishers, 2008), 251.<br />
91
REVIEW OF THE CURRENT SITUATION: PAVING THE WAY<br />
Road Infrastructure and its Influence on<br />
Development<br />
The growth <strong>of</strong> an expansive road network has<br />
had a transformative effect on <strong>Bloomington</strong>’s<br />
built environment for the past two decades. An<br />
aphorism attributed to industrial designer<br />
Norman Bel Geddes, who designed General<br />
Motor’s Futurama exhibit for the 1931 World’s<br />
Fair, stated “the highway should not impress<br />
upon the city, nor should the city impress<br />
upon the highway.” The traditional practice <strong>of</strong> running connecting pikes and roads through<br />
the centers <strong>of</strong> the communities they connected was deemed to be no longer appropriate<br />
because most highway traffic would not be expected to be destined for the communities<br />
through which the highway ran. It was expected to be bypass traffic which, if routed<br />
through the community, would only add to congestion and not commerce. Therefore, it<br />
was thought best to allow it to pass by communities rather than through them.<br />
<strong>Bloomington</strong> was not immune from this bypass logic. <strong>State</strong> Road 37 used to come through<br />
<strong>Bloomington</strong> by way <strong>of</strong> Cascades Park. The park was a Depression‐era project <strong>of</strong><br />
considerable civic utility. Community leaders at the time believed that the experience <strong>of</strong><br />
entering (or leaving) <strong>Bloomington</strong> would be greatly enhanced if the road wound through a<br />
park – as it still does. However, by the 1960s Bel Geddes’ sentiment had deeply pervaded<br />
the highway engineering mindset and, when calls were made to help deal with the<br />
“congestion” on <strong>State</strong> Road 37, it was natural to look at bypassing the city as one part <strong>of</strong> a<br />
comprehensive solution. By the early 1970s the road had been divided, four‐laned, and<br />
now took a route not through the city, but far <strong>of</strong>f to its west side, through an almost entirely<br />
rural landscape.<br />
<strong>Report</strong> <strong>of</strong> the <strong>Bloomington</strong> <strong>Peak</strong> <strong>Oil</strong> <strong>Task</strong> <strong>Force</strong><br />
The SR 37/SR 46 “Exchange” constructed in anticipation <strong>of</strong> building a<br />
new terrain highway through much <strong>of</strong> Southern <strong>Indiana</strong>’s farmland and<br />
greenspace in the interest <strong>of</strong> increased commodity transport by truck.<br />
92
Simultaneously, the <strong>State</strong> <strong>of</strong> <strong>Indiana</strong> wished to increase opportunities for tourism and<br />
economic development around the recently‐completed Lake Monroe. Large numbers <strong>of</strong><br />
day‐trippers from the communities to <strong>Bloomington</strong>’s north, especially <strong>Indiana</strong>polis, were<br />
expected to use the lake for summertime recreation, and preparations for traffic<br />
management were made. These preparations included the provision <strong>of</strong> a second bypass<br />
around the city, connecting <strong>State</strong> Road 37 on the city’s north to a new highway down to the<br />
lake outside the eastern edge <strong>of</strong> the city. Neither bypass remained rural for very long. The<br />
first to sprout was the “College Mall” area, established on formerly agricultural land in<br />
1965 and connected to the city both by the new eastern bypass as well as by a widened<br />
Third Street. Immediately, the College Mall began to draw economic activity away from the<br />
city’s downtown which entered a long, but not particularly sharp decline cushioned by the<br />
presence <strong>of</strong> <strong>Indiana</strong> University’s urban campus.<br />
<strong>Report</strong> <strong>of</strong> the <strong>Bloomington</strong> <strong>Peak</strong> <strong>Oil</strong> <strong>Task</strong> <strong>Force</strong><br />
93
<strong>Report</strong> <strong>of</strong> the <strong>Bloomington</strong> <strong>Peak</strong> <strong>Oil</strong> <strong>Task</strong> <strong>Force</strong><br />
The Machine in the Garden<br />
The First Sprout: College Mall<br />
College Mall Area – 1949 College Mall Area – 1961<br />
College Mall 1967 College Mall 1972<br />
94
In the late 1980s, commercial activity began along the <strong>State</strong> Road 37 bypass to the west <strong>of</strong><br />
the city as well as the area between Second Street/Bloomfield Road. Third Street/Whitehall<br />
Pike was developed into a major retail destination for residents <strong>of</strong> both <strong>Bloomington</strong> and<br />
the surrounding counties. The result, as our Activity Nodes map (Map A) shows, is the<br />
development <strong>of</strong> the community into one consisting <strong>of</strong> three primary areas <strong>of</strong> activity.<br />
One is centered around <strong>Bloomington</strong>’s downtown core (central node), biased towards the<br />
university’s western edge. Another is centered on the College Mall area (eastern node)<br />
while the third is centered at the nexus <strong>of</strong> <strong>State</strong> Road 37 and Third Street/Whitehall Pike<br />
(western node). Significant secondary and tertiary developments are also present at both<br />
the eastern and western nodes, such as the Ivy Tech/Cook Campus development farther<br />
west and both the new retail centers north <strong>of</strong> Third Street at College Mall and the<br />
significant residential developments (including Renwick) along Sare Road.<br />
Developments within those three nodes have come at the expense <strong>of</strong> <strong>Bloomington</strong>’s<br />
neighborhoods, particularly the newer neighborhoods. In general, the newer the<br />
neighborhood the less access it has to essential amenities (such as grocery stores, retail<br />
shopping, pharmacies, schools, etc.) and the more dependent it is on the automobile to<br />
reach those amenities. Consequently, the newer a neighborhood the more likely it is to be<br />
vulnerable to fuel prices and fuel disruptions. This is both because newer neighborhoods<br />
tend to be developed farther from the city core or either <strong>of</strong> the western or eastern activity<br />
nodes and because newer neighborhoods are developed almost exclusively for residential<br />
use (although some <strong>of</strong> the very newest developments are beginning to include retail and<br />
employment functions within them again).<br />
<strong>Report</strong> <strong>of</strong> the <strong>Bloomington</strong> <strong>Peak</strong> <strong>Oil</strong> <strong>Task</strong> <strong>Force</strong><br />
95
About the Activity Nodes Project<br />
In a post‐peak world, it will be important for people to live close to services critical to<br />
everyday life. In an effort to understand just how close or far residents currently live from<br />
key services, the <strong>Task</strong> <strong>Force</strong> mapped those services and compared the location <strong>of</strong> key<br />
services (areas <strong>of</strong> “activity nodes”) against a map <strong>of</strong> population density.<br />
The following Activity Nodes map tracks the location <strong>of</strong> nine key services and the density <strong>of</strong><br />
these services within a 300‐foot by 300‐foot block: grocery stores, schools, pharmacies,<br />
post <strong>of</strong>fices, public libraries, restaurants, hardware stores, department stores and farmers’<br />
markets. The areas <strong>of</strong> the city with the highest concentration <strong>of</strong> these services (seven or<br />
more) are noted in bright pink; those with five to six locations are marked in red; those<br />
with four and three destinations are marked in dark and light orange respectively while<br />
those with one or two locations are indicated by yellow.<br />
While the current picture <strong>of</strong> activity nodes points to three distinct nodes, an ideal<br />
configuration would place people closer to the nodes or the nodes closer to the people. Map<br />
B outlines areas <strong>of</strong> population density. When we lay the services map on top <strong>of</strong> the<br />
population map to examine the ways they align, it is clear that daily necessities cluster<br />
around major thoroughfares and do not necessarily track population density (Map C).<br />
The idea <strong>of</strong> activity nodes is anticipated in the <strong>City</strong>’s 2002 Growth Policies Plan (GPP). The<br />
GPP outlines the idea <strong>of</strong> a “Neighborhood Activity Center” (NAC). A NAC is a “mixed<br />
commercial node that serves as the central focus <strong>of</strong> each neighborhood” that should be<br />
easily accessible by pedestrians and minimize auto traffic while providing “small‐scale<br />
retail and business services within the context <strong>of</strong> neighborhoods” 134 However, the GPP<br />
identified just a handful <strong>of</strong> NACs, only a few <strong>of</strong> which map onto the critical nodes identified<br />
by the <strong>Task</strong> <strong>Force</strong>. 135 For the most part, the NACs identified by the GPP do not align with<br />
critical services, nor are they located in areas <strong>of</strong> significant population density.<br />
134 GPP, 33.<br />
135 Ibid.<br />
<strong>Report</strong> <strong>of</strong> the <strong>Bloomington</strong> <strong>Peak</strong> <strong>Oil</strong> <strong>Task</strong> <strong>Force</strong><br />
96
MAP A: Activity Nodes<br />
<strong>Report</strong> <strong>of</strong> the <strong>Bloomington</strong> <strong>Peak</strong> <strong>Oil</strong> <strong>Task</strong> <strong>Force</strong> 97
MAP B: Population Density<br />
<strong>Report</strong> <strong>of</strong> the <strong>Bloomington</strong> <strong>Peak</strong> <strong>Oil</strong> <strong>Task</strong> <strong>Force</strong> 98
MAP C: Activity Nodes with Population Density Overlay<br />
<strong>Report</strong> <strong>of</strong> the <strong>Bloomington</strong> <strong>Peak</strong> <strong>Oil</strong> <strong>Task</strong> <strong>Force</strong> 99
Natural Neighborhoods<br />
One key step in re‐setting the human scale is to make the city more polycentric – to bring<br />
the basic amenities <strong>of</strong> daily living within walking distance <strong>of</strong> as many residences as<br />
possible. In effort to think through where multiple centers might fall, the <strong>Task</strong> <strong>Force</strong><br />
outlined key neighborhood geographic areas; some are defined by already‐existing<br />
neighborhood associations while others are bounded by natural and/or built constraints.<br />
The result is a city matrix <strong>of</strong> 55 “Natural Neighborhoods.” Collectively, these<br />
neighborhoods defined a basemap for the <strong>Task</strong> <strong>Force</strong> on top <strong>of</strong> which are overlaid the other<br />
maps that follow in this <strong>Report</strong>: activity nodes, walkability, population density, and<br />
proximity to bus stops.<br />
<strong>Report</strong> <strong>of</strong> the <strong>Bloomington</strong> <strong>Peak</strong> <strong>Oil</strong> <strong>Task</strong> <strong>Force</strong><br />
100
MAP D: 55 Natural Neighborhoods<br />
<strong>Report</strong> <strong>of</strong> the <strong>Bloomington</strong> <strong>Peak</strong> <strong>Oil</strong> <strong>Task</strong> <strong>Force</strong> 101
VULNERABILITIES<br />
1. When it comes to land use, the physical separation <strong>of</strong> where we live from<br />
where we carry out the activities <strong>of</strong> everyday life – work, food, school, health<br />
care, and community – is by the biggest threat posed by the end <strong>of</strong> cheap oil.<br />
As fuel prices rise and/or fuel disruptions occur with greater frequency, neighborhoods<br />
without access to necessary services will become<br />
less livable and could even be abandoned unless<br />
efforts are made to transform them into self‐<br />
sufficient communities either by adding missing<br />
amenities or by developing alternative<br />
transportation options. 136 Increasing fuel prices<br />
and other costs associated with transportation<br />
will provide incentives to develop land within the<br />
city core and in neighborhoods that provide key<br />
goods and services. Available land for housing in the city core and in core neighborhoods<br />
could include areas previously used for parking, vacant lots, and lots occupied by<br />
single‐story buildings. Because <strong>of</strong> their proximity to necessary amenities, these areas will<br />
draw residents from the city’s suburban and exurban fringes.<br />
<strong>Report</strong> <strong>of</strong> the <strong>Bloomington</strong> <strong>Peak</strong> <strong>Oil</strong> <strong>Task</strong> <strong>Force</strong><br />
[I]t is beginning to dawn on many that the<br />
21 st Century will not see the same easy<br />
access to lowcost oil that fueled the<br />
unprecedented technological advances <strong>of</strong><br />
the last century. We are either at or very<br />
near the era when the demand for oil will<br />
outstrip the ability <strong>of</strong> the earth to supply<br />
the needs <strong>of</strong> the global society.<br />
Nygren, Massie, Kern. “Army Strategy For The<br />
End Of Cheap <strong>Oil</strong>.” United <strong>State</strong>s Military<br />
Academy, West Point, NY. 2006.<br />
136 Lack <strong>of</strong> access to neighborhood services has the effect <strong>of</strong> driving down property values in those areas,<br />
making investment in them problematic at best and nonsensical at worst. In that case the <strong>City</strong> may find itself,<br />
as Youngstown, Ohio does today, in the position <strong>of</strong> having to abandon those areas to function without<br />
municipal services and shrinking the municipal boundary. Youngstown 2010.<br />
http://www.youngstown2010.com/<br />
102
MITIGATION GOALS & STRATEGIES<br />
SHORTTERM (15 years)<br />
1. Include planning for peak oil in the Growth Policies Plan (GPP).<br />
The GPP was drafted when sustainability was barely emerging and peak oil was not on the<br />
planning radar. However, now even the American Planning Association has recognized the<br />
need to plan for peak. 137 As the GPP will be due for an update in 2012, the <strong>City</strong> should<br />
include planning for peak in this guiding land use document.<br />
2. Increase the number <strong>of</strong> Activity Centers in the GPP.<br />
In the interest <strong>of</strong> both updating the GPP and preparing for a future <strong>of</strong> energy descent, it is<br />
recommended that the <strong>City</strong> greatly increase the number <strong>of</strong> Activity Centers to bring people<br />
within walking distance <strong>of</strong> essential services in all 55 Natural Neighborhoods (Map D). The<br />
goal should be to promote small, self‐contained neighborhoods with a clearly‐defined<br />
center providing essential services, ideally no further than a quarter mile from the edge.<br />
Most <strong>of</strong> the neighborhood activity centers identified in the GPP are sited on the periphery<br />
<strong>of</strong> the community and either do not feature essential services as defined by the <strong>Task</strong><br />
<strong>Force</strong>’s Activity Nodes map or are not sited in area <strong>of</strong> dense population. 138 The GPP points<br />
out that, “[i]t should be noted that while several NACs have been identified on the land use<br />
map, more could be designated in the future as further study is done and appropriate<br />
locations have been identified.” 139<br />
137 “Responding to <strong>Peak</strong> <strong>Oil</strong> and Energy Uncertainty” was a session featured at the American Planning<br />
Association’s 100 th Annual Conference, May 2008.<br />
138 While the GPP also designates areas as “Community Activity Centers” and “Regional Activity Centers,”<br />
these areas are assumed to be accessed by users who may drive personal automobiles to the centers;<br />
therefore, “walkability” is not prioritized.<br />
139 Ibid, 33.<br />
<strong>Report</strong> <strong>of</strong> the <strong>Bloomington</strong> <strong>Peak</strong> <strong>Oil</strong> <strong>Task</strong> <strong>Force</strong><br />
103
3. Include plans for peak oil in the Unified Development Ordinance.<br />
The GPP is the <strong>City</strong>’s guiding land‐use policy document. The Unified Development<br />
Ordinance (UDO) implements the GPP. In contrast to the GPP, the UDO was drafted as peak<br />
oil was entering <strong>City</strong> consciousness. Indeed,<br />
many, if not most, <strong>of</strong> the changes<br />
recommended here were already under‐way<br />
in the very recent past as a result <strong>of</strong> responses<br />
to rising fuel prices as well as suburban flight<br />
and urban redevelopment.<br />
Much <strong>of</strong> what <strong>Bloomington</strong> and Monroe<br />
County recognize as their traditional and<br />
historic neighborhoods – based on form and<br />
not use – would actually be illegal to build<br />
today in many areas. The <strong>City</strong> <strong>of</strong> <strong>Bloomington</strong> has already revised its zoning rules to place<br />
more emphasis on form, but it can, and should, do more. Specifically, the <strong>City</strong> should<br />
amend the UDO to address the following:<br />
<strong>Report</strong> <strong>of</strong> the <strong>Bloomington</strong> <strong>Peak</strong> <strong>Oil</strong> <strong>Task</strong> <strong>Force</strong><br />
The picture above was featured in a March 2008 article in The<br />
Atlantic entitled, “The Next Slum?” The article opened by<br />
asserting that, “Fundamental changes in American life may<br />
turn today’s McMansions into tomorrow’s tenements.” 1<br />
Similar structures can easily be found in <strong>Bloomington</strong><br />
subdivisions. Suzanne Dechillo, The New York Times/Redux<br />
• Remove any residual impediments to microagriculture.<br />
As is detailed in the Sustenance chapter, local food production will be a<br />
critical component <strong>of</strong> post‐peak resiliency. The <strong>City</strong> Council took an<br />
important step forward in fostering urban agriculture with its recent<br />
amendment to the UDO, but the <strong>City</strong> can do more to make land use within the<br />
city more farm friendly. Please see Sustenance chapter for detailed<br />
recommendations.<br />
• Encourage formbased rather than usebased development.<br />
Use‐based development is essentially post WWII suburban development<br />
where permitted land uses (residential, retail, employment) are the defining<br />
characteristic <strong>of</strong> the zoning code. This encourages, indeed mandates,<br />
separation <strong>of</strong> use, which in turns promotes dependence on the automobile.<br />
Instead, encourage:<br />
An even stronger commitment to compact, mixed‐use urban form;<br />
Increased residential densities in the urban core;<br />
Narrower streets;<br />
Sustainable development;<br />
Environmental integrity; and<br />
Economic and cultural vibrancy<br />
104
4. Add an Activity Nodes overlay to the UDO.<br />
In the interest <strong>of</strong> ultimately providing all neighborhoods with essential services within<br />
walking distance, the <strong>City</strong> should start with a nodal development overlay as a pilot.<br />
Standards for such an overlay should be structured to foster the essential characteristics <strong>of</strong><br />
pedestrian‐friendly, human scale development:<br />
• Design elements that support pedestrian environments and encourage<br />
transit use, walking, and bicycling;<br />
• Transit access within walking distance (generally ¼ mile) <strong>of</strong> anywhere<br />
within the node;<br />
• Mixed uses and a commercial core so that essential services are within<br />
walking distance;<br />
• Parks and other public and private open spaces within walking distance; and<br />
• A mix <strong>of</strong> housing types and residential densities.<br />
5. Implement regional planning: Toward a Unified Comprehensive Land Use and<br />
Transportation Plan.<br />
As we revise the use <strong>of</strong> the existing built environment, we must simultaneously plan for the<br />
shape <strong>of</strong> the future built environment. In a post‐peak era, we should be aiming for<br />
development patterns that lead to higher population density in areas designated as activity<br />
nodes, and that foster mixed use, walking, biking, and transit use. (See Transportation<br />
chapter). Right now, transportation planning is largely separate from land use planning<br />
and land use planning is a largely self‐contained effort: <strong>Indiana</strong> University, Monroe County,<br />
and the <strong>City</strong> <strong>of</strong> <strong>Bloomington</strong> all draft and implement their plans independent <strong>of</strong> each other.<br />
Without coordinated planning, there is little hope for a comprehensive vision to guide<br />
development as transportation fuels become more expensive and are not as readily<br />
available. However, such cooperation is precisely what is called for in the <strong>City</strong>’s GPP. The<br />
GPP directs the <strong>City</strong> to “[s]tudy the feasibility <strong>of</strong> creating a consolidated planning<br />
department for the <strong>City</strong> and County as a method <strong>of</strong> improving planning and development<br />
management .” 140<br />
140 2002 Growth Policies Plan, Implementation Measure ACC‐3, p. 22.<br />
https://bloomington.in.gov/media/media/application/pdf/49.pdf<br />
<strong>Report</strong> <strong>of</strong> the <strong>Bloomington</strong> <strong>Peak</strong> <strong>Oil</strong> <strong>Task</strong> <strong>Force</strong><br />
105
MEDIUMTERM (515 years)<br />
1. Transition the <strong>City</strong>’s zoning ordinance to a formbased code.<br />
The <strong>City</strong>’s current zoning<br />
document is something <strong>of</strong> a<br />
hybrid. While it contains<br />
some provisions focusing on<br />
the form <strong>of</strong> the built<br />
environment, much <strong>of</strong> it is<br />
predicated on allowed or<br />
prohibited uses. Within the<br />
next five to 15 years, the <strong>City</strong><br />
should replace its zoning<br />
ordinance with a form‐based<br />
code. Unlike use‐based codes,<br />
a form‐based code is a multidisciplinary approach that connects the design <strong>of</strong> circulation<br />
and public space networks to building design.<br />
A form‐based code would both outline the design <strong>of</strong> the built environment (for example<br />
building height, where buildings should be placed on a lot, density <strong>of</strong> buildings, and street<br />
outlay) and provide for a wide range <strong>of</strong> compatible, neighborhood scale uses, as was the<br />
case before automobiles and cheap oil started to pervade our lives. On West 6 th Street, for<br />
example, a neighborhood that was developed in the late 19 th /early 20 th century, several <strong>of</strong><br />
the houses now used exclusively as residences had neighborhood grocery stores on the<br />
ground floor sometime in the past, when neighborhoods still provided more <strong>of</strong> what people<br />
needed on a daily basis.<br />
<strong>Report</strong> <strong>of</strong> the <strong>Bloomington</strong> <strong>Peak</strong> <strong>Oil</strong> <strong>Task</strong> <strong>Force</strong><br />
106
2. Revisit the use <strong>of</strong> Tax Increment Financing, particularly as it relates to <strong>of</strong>ten<br />
competing and competitive uses between the <strong>City</strong> and the County.<br />
Tax Increment Financing (TIF), in which property taxes captured in a defined geographic<br />
area are used almost exclusively for improvements within the area (as opposed to accruing<br />
to a municipal or county general fund), was originally provided as a tool to spur the<br />
redevelopment <strong>of</strong> urban brownfields. 141 TIF came to <strong>Indiana</strong> in 1987 and in the years<br />
since, has greatly expanded as local governments have employed it as an alternative<br />
financing model for infrastructure and economic development.<br />
Unfortunately, this has taken the use <strong>of</strong> TIF beyond its original purpose <strong>of</strong> urban renewal<br />
and into a local government financing method <strong>of</strong> first resort. This has resulted in 70% <strong>of</strong><br />
TIF monies in <strong>Indiana</strong> being devoted to automotive‐dependent suburban retail (malls, etc.),<br />
not urban brownfield redevelopment. 142 TIF has substantially turbocharged sprawl.<br />
BEFORE: 1998 North Park Area preTIF designation: AFTER: North Park Today: denuded and bifurcated by a new<br />
Mostly greenspace road<br />
North Park: an arterial scar <strong>of</strong> land some 400-plus acres, owned by a developer whom the <strong>State</strong> <strong>of</strong> <strong>Indiana</strong><br />
paid to build the arterial highway in the first place. An open greenspace, peppered with abandoned limestone<br />
quarries and decreed by the County Redevelopment Commission as organically blighted, incapable <strong>of</strong> normal<br />
economic development without an influx <strong>of</strong> massive amounts <strong>of</strong> public subsidy.<br />
141 Johnson and Man, eds., Tax Increment Financing and Economic Development: Uses, Structures, and Impact<br />
(SUNY Press, 2001).<br />
142 Ibid.<br />
<strong>Report</strong> <strong>of</strong> the <strong>Bloomington</strong> <strong>Peak</strong> <strong>Oil</strong> <strong>Task</strong> <strong>Force</strong><br />
107
Both the <strong>City</strong> <strong>of</strong> <strong>Bloomington</strong> and Monroe County have redevelopment commissions whose<br />
power and duty is to establish TIF districts and designations as well as to control how<br />
property taxes collected within those districts are expended within the district. The<br />
Monroe County Redevelopment Commission has now established three TIF districts, all<br />
established over greenfield areas for development <strong>of</strong> medical <strong>of</strong>fices, warehousing, and<br />
suburban retail. The <strong>City</strong> has established seven TIF districts covering the immediate<br />
downtown and Whitehall Plaza as well as the RCA/Thomson Brownfield.<br />
The <strong>City</strong> and County Redevelopment Commissions are in competition to drive development<br />
to their respective TIF areas. This is largely a zero‐sum game as a firm induced to build on<br />
a county suburban greenfield is a firm not available to redevelop an urban brownfield, such<br />
as the RCA/Thomson site. In the County there are few brownfields but many remaining<br />
greenfields which the County, naturally, would like to see developed in order to grow the<br />
tax base.<br />
The situation <strong>of</strong>ten arises where the County wishes to convert a greenfield into some sort<br />
<strong>of</strong> retail, industrial, or employment use while urban brownfields remain undeveloped<br />
within <strong>Bloomington</strong>. Co‐operation between the two redevelopment commissions along<br />
with concessions between the <strong>City</strong> and County to help move in the direction <strong>of</strong> urban<br />
redevelopment as opposed to suburban greenfield development would go a long way<br />
towards slowing or even reversing the building out <strong>of</strong> suburban infrastructure. A regional<br />
(county‐wide or even multi‐county) redevelopment commission would be able to consider<br />
all parcels within the region as a whole, not just a particular political subdivision, and be<br />
able to make decisions that support the original intent <strong>of</strong> “redevelopment.”<br />
<strong>Report</strong> <strong>of</strong> the <strong>Bloomington</strong> <strong>Peak</strong> <strong>Oil</strong> <strong>Task</strong> <strong>Force</strong><br />
108
3. Explore school deconsolidation.<br />
From roughly the 1960s onward, the nation has embarked on a program <strong>of</strong> school<br />
consolidation wherein a number <strong>of</strong> traditionally neighborhood schools were consolidated<br />
in a single larger facility. The purpose <strong>of</strong> consolidation was to produce cost savings from<br />
economies <strong>of</strong> scale while also providing access to facilities and other aspects <strong>of</strong> pedagogic<br />
infrastructure that would otherwise not be available to students <strong>of</strong> smaller and more<br />
geographically dispersed schools.<br />
The promise <strong>of</strong> cost‐savings accruing from consolidation is a source <strong>of</strong> controversy. In any<br />
case, there are transportation costs associated with consolidation. With gasoline in the $2‐<br />
$3/gallon range, the Monroe County School Corporation is expending about 10% <strong>of</strong> its total<br />
budget operating its bus system, outsourcing some <strong>of</strong> that to private contractors. As fuel<br />
costs rise, the percentage <strong>of</strong> the school district’s revenue that must be diverted from<br />
education to transportation will increase. An investigation into cost savings, if any, realized<br />
by consolidation within the two major school corporations (Richland‐Bean Blossom and<br />
Monroe County Community Schools) should be conducted and those results contrasted<br />
against greater fuel and other transportation costs associated with de‐consolidation.<br />
4. Target public transit routes to help shape neighborhood development.<br />
Transit routes affect development patterns. The <strong>City</strong> should work with <strong>Bloomington</strong><br />
Transit (BT) to shape the quality and form <strong>of</strong> residential and commercial development by<br />
targeting bus routes and schedules both to foster neighborhood identity by naming routes<br />
or stops for neighborhoods. However, routes should only be expanded if and as BT<br />
achieves fuel efficiency greater than the current 29 passenger miles per gallon, which is<br />
actually worse than that <strong>of</strong> many fuel efficient private automobiles with a typical occupancy<br />
load. Better advertising, higher public awareness, and, above all, higher fuel prices will all<br />
probably result in increased transit ridership, which should, in turn, lead to better per‐<br />
rider fuel economy for the transit fleet. A discussion <strong>of</strong> public transit is more fully treated in<br />
the following chapter, Transportation.<br />
<strong>Report</strong> <strong>of</strong> the <strong>Bloomington</strong> <strong>Peak</strong> <strong>Oil</strong> <strong>Task</strong> <strong>Force</strong><br />
109
5. Build in physical separation buffers along streets and roadways.<br />
Road systems should be optimized for multi‐modal transportation options, including<br />
bicycling and pedestrian uses. Natural and artificial buffers between transportation modes<br />
Manhattan – A bike lane separated from the road by<br />
way <strong>of</strong> a 6’ buffer <strong>of</strong> parked cars.<br />
<strong>Report</strong> <strong>of</strong> the <strong>Bloomington</strong> <strong>Peak</strong> <strong>Oil</strong> <strong>Task</strong> <strong>Force</strong><br />
should be incorporated into road design<br />
wherever feasible. Examples <strong>of</strong> such<br />
buffers include parallel parking<br />
provisions along roadsides that allow<br />
vehicles to act as safety buffers between<br />
pedestrian users <strong>of</strong> sidewalks and<br />
automotive users <strong>of</strong> the roadway.<br />
Automotive buffers, in the form <strong>of</strong><br />
parked vehicles, can be used to protect<br />
bicycle lanes.<br />
<strong>Bloomington</strong> designates bicycle lanes<br />
with on‐road graphics but there are no<br />
physical barriers for traffic separation. On some <strong>of</strong> the wider roads, such as College and<br />
Walnut and Third Street east <strong>of</strong> Bryan, a narrow concrete walkway built out in the road and<br />
against which automobiles park would provide a dedicated and protected set <strong>of</strong> bicycle<br />
lanes between the walkway and the associated road shoulder or sidewalk.<br />
110
6. Discourage widening arterial streets where possible.<br />
Arterial streets are designed to provide a high degree <strong>of</strong> mobility and generally serve longer<br />
vehicle trips to, from, and within urban areas. Contemporary<br />
practice has been to emphasize the arterial roadway for<br />
connectivity between activity nodes. Arterials, because <strong>of</strong><br />
their size (particularly width) serve as barriers within a<br />
community, segregating parts <strong>of</strong> the community from other<br />
parts. They also represent single points <strong>of</strong> failure where a<br />
serious accident or congestion choke can halt travel on a<br />
large scale. While the practice <strong>of</strong> building arterials has<br />
largely been discarded by both the <strong>City</strong> and developers, the<br />
<strong>City</strong> still engages in the widening <strong>of</strong> existing arterials.<br />
Where an arterial‐style road is necessary, the roadway<br />
should be constructed in a boulevard style with a significant<br />
pedestrian‐friendly median (similar to what exists between<br />
College and Walnut where they are separated by Miller‐<br />
Showers Park). In this way, the amount <strong>of</strong> roadway that<br />
must be crossed by a pedestrian at any one time can be<br />
minimized.<br />
LONGTERM (1530 years)<br />
<strong>Report</strong> <strong>of</strong> the <strong>Bloomington</strong> <strong>Peak</strong> <strong>Oil</strong> <strong>Task</strong> <strong>Force</strong><br />
Miller‐Showers Park , a narrow strip <strong>of</strong><br />
land purchased by the <strong>City</strong> in 1929 for $1<br />
separates two <strong>of</strong> the <strong>City</strong>’s heavily‐used<br />
arterials.<br />
1. Within 30 years, the <strong>City</strong> should complete its transition <strong>of</strong> all 55 Natural<br />
Neighborhoods to activity nodes that provide for essential services and transit<br />
within walking distance.<br />
111
<strong>Report</strong> <strong>of</strong> the <strong>Bloomington</strong> <strong>Peak</strong> <strong>Oil</strong> <strong>Task</strong> <strong>Force</strong><br />
TRANSPORTATION<br />
Of all sectors <strong>of</strong> the U.S. economy, transportation is the most petroleum‐dependent and the<br />
most vulnerable to disruption resulting from declining world petroleum supplies. Ninety‐<br />
seven percent <strong>of</strong> transportation energy is reliant on fossil fuel. Of that figure, fully 95<br />
percent comes from petroleum. 143 For decades, low global petroleum prices prevailed,<br />
shaping the way people and goods move.<br />
Low oil prices fostered personal automobile ownership and a road network that allowed us<br />
to live substantial distances from where we work, shop, and go to school. Cheap oil also<br />
fostered air travel and long‐distance trade among nations. As a result, cities like<br />
<strong>Bloomington</strong> have become dependent on other regions for almost everything needed in<br />
daily life, from food, clothing, water, transportation fuel, shelter and medicines to big<br />
screen televisions, solar collectors, and wind turbines. One would be hard pressed to find<br />
any food, product, or service for sale in Monroe County, that doesn’t involve any<br />
transportation beyond the boundaries <strong>of</strong> Monroe County. Even locally‐produced and sold<br />
food usually requires the use <strong>of</strong> seeds, machines, tools, fertilizer, irrigation systems, fuel,<br />
containers, hoop houses, etc. that have been produced elsewhere and transported to<br />
Monroe County over long distances. Because <strong>of</strong> our reliance on automobiles, trucks,<br />
container ships, and airplanes for moving goods and/or people, a disruption in the supply<br />
<strong>of</strong> petroleum could affect most everyday aspects <strong>of</strong> life in <strong>Bloomington</strong> and Monroe County.<br />
However, there is much we can do reduce our vulnerability to a decline in cheap oil.<br />
The level <strong>of</strong> our community’s vulnerability is a function <strong>of</strong> how easy or hard it is for people,<br />
businesses, and institutions to respond to increasing fuel prices by reducing petroleum<br />
consumption without compromising the basic human needs <strong>of</strong> shelter, food, water, health<br />
care, and transportation. A key aspect <strong>of</strong> community resiliency will be strengthening our<br />
143 Natural gas comprises approximately 2 percent and renewable energy comprises 3 percent <strong>of</strong> energy<br />
used in the transportation sector. U.S. Department <strong>of</strong> Energy, Energy Information Administration, Annual<br />
Energy Review 2008.<br />
112
local transportation system.<br />
How vulnerable or resilient we are will be influenced by:<br />
• The quality and costs <strong>of</strong> transportation alternatives (walking, biking, public transit,<br />
rail, car shares, ride shares, group taxis, etc.);<br />
• How much we are able to reduce fuel demands pro‐actively by reducing travel<br />
demands ahead <strong>of</strong>, or in step with, higher prices and/or reduced availability <strong>of</strong> fuels;<br />
• Our ability to buffer sudden shortages in supply (where fuel is unavailable at any<br />
reasonable price); and<br />
• The availability and cost <strong>of</strong> alternative fuels, alternative fuel vehicles, and fuel‐<br />
efficient vehicles.<br />
<strong>Report</strong> <strong>of</strong> the <strong>Bloomington</strong> <strong>Peak</strong> <strong>Oil</strong> <strong>Task</strong> <strong>Force</strong><br />
113
REVIEW OF THE CURRENT SITUATION: VMT & EQUITY<br />
Automobile Dependency<br />
A key index <strong>of</strong> oil dependency is car ownership. On average, in the United <strong>State</strong>s, there are<br />
755 motor vehicles per 1,000 people (the highest in the world until recently). 144 As with<br />
the rest <strong>of</strong> the nation, residents <strong>of</strong> <strong>Bloomington</strong> and Monroe County are highly reliant upon<br />
their personal vehicles. In Monroe County, there are approximately 672 vehicles per 1,000<br />
people. 145 See Appendix IV.<br />
Vehicle Miles Travelled: Around the Earth 112 Times a Day<br />
Another indicator <strong>of</strong> our dependency is just how much we drive those cars. How much we<br />
drive is commonly measured by vehicle‐miles traveled (VMT). VMT is the total number <strong>of</strong><br />
miles driven by all residential vehicles within a certain time period in a geographic area.<br />
VMT is influenced by population, the number <strong>of</strong> vehicles per household, the number <strong>of</strong> car<br />
trips per day, and the distances traveled.<br />
In 2003, Monroe County residents drove an estimated 2.8 million miles per day. 146 This<br />
distance is the equivalent <strong>of</strong>:<br />
• Driving one car from the US<br />
east coast to the west coast<br />
933 times in one day.<br />
• Driving one car around the<br />
Earth at the equator 112<br />
times in one day.<br />
• Driving one car from the<br />
Earth to the Moon 12 times<br />
in one day.<br />
144 Organization for Economic Co‐operation and Development. See, William Pentland, “The World’s Top Car‐<br />
Owning Countries,” Forbes, July 30, 2008.<br />
145 Based on 2000 U.S. Census figures.<br />
146 <strong>Bloomington</strong> Environmental Commission, <strong>Bloomington</strong> Environmental Quality Indicators <strong>Report</strong>,<br />
http://bloomington.in.gov/documents/viewDocument.php?document_id=2987<br />
<strong>Report</strong> <strong>of</strong> the <strong>Bloomington</strong> <strong>Peak</strong> <strong>Oil</strong> <strong>Task</strong> <strong>Force</strong><br />
114
The 2.8 million miles we drive each day translate into 22.8 miles per capita for Monroe<br />
County residents. While Monroe County VMT is lower than many other communities in<br />
<strong>Indiana</strong>, the figure is substantially higher than for comparable college communities such as<br />
Washtenaw County, MI (Ann Arbor) whose 11 VMT is roughly half that <strong>of</strong> Monroe County.<br />
According to the 2000 U.S. Census, approximately 67 percent <strong>of</strong> <strong>Bloomington</strong> workers<br />
commuted to work in single‐occupancy vehicles, 14.5 percent walked to work, 9.2<br />
carpooled, 2.8 percent used public transportation, and 2.7 percent used bicycles. 147 These<br />
figures indicate a very heavy dependence on automobile transportation.<br />
Commuting Into and Out <strong>of</strong> Monroe County<br />
Monroe County is a net “importer” <strong>of</strong> workers. In 2007, a total <strong>of</strong> 84,468 people (both<br />
residents and commuters) worked in Monroe County. Of those, 15,859 (almost 19 percent)<br />
commuted into Monroe County from neighboring counties. These commuters<br />
predominantly reside in Owen, Green, and Lawrence Counties. 5,952 residents <strong>of</strong> Monroe<br />
County work in other counties. 148<br />
147 2000 U.S. Census.<br />
148 STATS <strong>Indiana</strong>, STATS <strong>Indiana</strong> Annual Commuting Trends Pr<strong>of</strong>ile Based on <strong>Indiana</strong> IT40 Returns for Tax<br />
Year 2007 http://www.stats.indiana.edu/commtframe.html<br />
<strong>Report</strong> <strong>of</strong> the <strong>Bloomington</strong> <strong>Peak</strong> <strong>Oil</strong> <strong>Task</strong> <strong>Force</strong><br />
115
<strong>Oil</strong> & Equity: The Impact <strong>of</strong> Fuel Costs on Households Budgets<br />
People with lower incomes and those travelling great distances are the most vulnerable to<br />
a decline in cheap oil. Subtracting out the large student population, the poverty rate <strong>of</strong><br />
Monroe County hovers somewhere around 26 percent. 149 The poverty rate for the nation<br />
as a whole is 12.5 percent while <strong>Indiana</strong>’s rate is 12.3 percent.<br />
In an effort to better understand what increased fuel prices mean for different income<br />
brackets, it is instructive to look at average fuel efficiencies and fuel expenditures as<br />
percentages <strong>of</strong> different income levels. Assuming that Monroe County residents drive<br />
approximately 22.8 miles per person per day at an average efficiency <strong>of</strong> 20.3 miles per<br />
gallon (MPG), 150 the following illustrates the per capita costs <strong>of</strong> ever‐increasing fuel prices.<br />
Impact on Income: Increasing Fuel Prices at Average MPG & Average VMT<br />
Price per Gallon $2.00 $3.00 $4.00 $5.00 $10<br />
Costs per mile @ 20.3 average<br />
MPG $0.10 $0.15 $0.20 $0.25 $0.49<br />
Costs per capita per day @<br />
22.8 miles per capita per day $2.25 $3.42 $4.56 $5.70 $11.17<br />
Costs per person per year $819.90 $1,248.30 $1,664.40 $2,080.50 $4,077.78<br />
Fuel expenses as % yearly per<br />
capita income $27,935 151 2.94% 4.47% 5.96% 7.45% 14.60%<br />
Fuel expenses as % yearly per<br />
capita income $15,000 5.47% 8.32% 11.10% 13.87% 27.19%<br />
Fuel expenses as % yearly per<br />
capita income $6,000 152 13.67% 20.81% 27.74% 34.68% 67.96%<br />
149 Identifying a poverty rate from residents in Monroe County is challenging, due to our significant student<br />
population. The US Census puts the rate at 41.6 percent – a somewhat inflated rate. According to Todd Lare,<br />
Executive Director <strong>of</strong> the South Central Community Action Program, even if you lowered the 41.6 percent<br />
figure by 15 percent to account for the student population, it would leave more than a 26 percent poverty<br />
figure among non‐university residents. Dann Denny, “40% <strong>of</strong> <strong>City</strong> in Poverty: US Census Bureau says Poverty<br />
Increased Nearly 7% From 2006 to 2007,” Herald‐Times On‐line, September 13, 2008.<br />
150 This is based on the US EPA’s computer model – MOBILE 6.2 ‐‐ for estimating emissions from highway<br />
vehicles. http://www.epa.gov/oms/climate/420f05004.htm.<br />
151 Monroe County 2006 personal per capita income.<br />
152 Poverty level for household <strong>of</strong> three.<br />
<strong>Report</strong> <strong>of</strong> the <strong>Bloomington</strong> <strong>Peak</strong> <strong>Oil</strong> <strong>Task</strong> <strong>Force</strong><br />
116
The above table serves as a starting point to conduct a benchmark analysis. The goal <strong>of</strong> the<br />
analysis is to determine how much fuel use would have to be cut by reducing VMT, or how<br />
much fuel efficiency would have to increase with rising gas prices, to keep the percentage <strong>of</strong><br />
fuel expenses to income the same as in the table above at a gas price <strong>of</strong> $2.00 per gallon. As<br />
illustrated above, at $2.00 per gallon and 22.8 VMT, fuel constitutes roughly the following<br />
proportion <strong>of</strong> per capita income: 2.9 percent <strong>of</strong> $27,035/year; 5.47 <strong>of</strong> $15,000/year, and<br />
13.7 percent <strong>of</strong> $6,000/year. The results are as follows:<br />
• $5/gallon. At an average gas mileage <strong>of</strong> 20.3 MPG, and a gas price <strong>of</strong> $5 per gallon,<br />
average miles driven would have to go down from 22.8 to 10 miles per capita per<br />
day for the percentage <strong>of</strong> fuel expenditures to income to stay the same as they were<br />
at $2.00 per gallon. That is a reduction in fuel use by 50.7 percent.<br />
• $10/gallon. With an average gas mileage <strong>of</strong> 20.3 miles per gallon, and a gas price <strong>of</strong><br />
$10 per gallon, average miles would have to go down from 22.8 to 4.5 miles per<br />
capita per day, for the percentage <strong>of</strong> fuel expenditures to income to stay the same as<br />
they are at $2.00 per gallon. That is a reduction in fuel use by 78 percent.<br />
• Maintaining Average VMT & Increased Economies. Assuming residents do not<br />
cut back on driving and continue to average 22.8 miles per capita per day, at a price<br />
<strong>of</strong> $5 per gallon, fuel economy would have to increase to 50 miles per gallon on<br />
average for the percentage <strong>of</strong> fuel expenditures to income to stay the same as they<br />
are at $2.00 per gallon and an average fuel efficiency <strong>of</strong> 20.3 miles per gallon. At a<br />
fuel price <strong>of</strong> $10 per gallon, fuel economy would have to double again, to 100 miles<br />
per gallon, for fuel expenditures to stay at the same percentages <strong>of</strong> income as they<br />
are at $2.00 per gallon. Increasing the fuel economy for the whole vehicle fleet from<br />
20.3 miles per gallon to 50 miles per gallon is ‐‐ at the current state <strong>of</strong> technology,<br />
and based on the fact that it takes time to phase out and replace the existing vehicle<br />
stock ‐‐ close to utopian within the next 5‐10 years.<br />
Therefore, the most likely scenario is that people with lower incomes will have to respond<br />
with drastic cuts in vehicle miles travelled, since they cannot increase substantially the<br />
percentage <strong>of</strong> fuel expenditures as part <strong>of</strong> their income. People with higher incomes may<br />
not cut down on trips as drastically, and take the edge <strong>of</strong>f high fuel costs by buying more<br />
fuel‐efficient new cars.<br />
<strong>Report</strong> <strong>of</strong> the <strong>Bloomington</strong> <strong>Peak</strong> <strong>Oil</strong> <strong>Task</strong> <strong>Force</strong><br />
117
Fuel as Percentage <strong>of</strong> Income<br />
100.00%<br />
80.00%<br />
60 .0 0%<br />
40 .0 0%<br />
20.00%<br />
0.00%<br />
VULNERABILITIES: TRAVELASUSUAL<br />
1. Around the world 112 times a day. We rely on quick, easy, ondemand<br />
transport to take us considerable distances everyday.<br />
2. Increasing fuel prices disproportionately burden lowerincome residents.<br />
3. Commuters in and out <strong>of</strong> Monroe County are more exposed to increasing fuel<br />
prices.<br />
<strong>Report</strong> <strong>of</strong> the <strong>Bloomington</strong> <strong>Peak</strong> <strong>Oil</strong> <strong>Task</strong> <strong>Force</strong><br />
Gasoline As Percentage <strong>of</strong> Income<br />
27,935 $15,000 $6,000<br />
Annual Income<br />
As illustrated above, lowincome workers will suffer disproportionately from an increase in fuel prices<br />
118<br />
$2/gal<br />
$3/gal<br />
$4/gal<br />
$5/gal<br />
$10/gal
REVIEW OF CURRENT SITUATION:<br />
WALKING AND BIKING<br />
The <strong>City</strong> <strong>of</strong> <strong>Bloomington</strong> has made a considerable effort to develop a network <strong>of</strong> safe,<br />
convenient, and attractive bicycle and pedestrian facilities with guidance provided by the<br />
<strong>Bloomington</strong> Bicycle and Pedestrian Transportation and Greenways System Plan. 153 Indeed,<br />
the <strong>City</strong> is one <strong>of</strong> 108 communities across the country to be recognized as a "Bicycle<br />
Friendly Community" by the League <strong>of</strong> American Bicyclists for "longstanding commitments<br />
to providing safe accommodation and facilities for bicyclists, and<br />
for their efforts to encourage bicycle travel for transportation<br />
and recreation." Similarly, Monroe County has developed an<br />
alternative transportation plan whose aim is “making<br />
alternative transportation a way <strong>of</strong> life for many Monroe<br />
County residents.” Furthermore, in January 2009, the<br />
<strong>Bloomington</strong>/Monroe County Metropolitan Planning Organization<br />
(MPO) adopted a Complete Streets Policy. The guidelines outlined in the policy ensure that<br />
local roadways which are federally funded safely accommodate all users <strong>of</strong> a corridor,<br />
including pedestrians, bicyclists, users <strong>of</strong> mass transit, and motorists.<br />
Whether increasing fuel prices can be <strong>of</strong>fset by turning to walking and biking depends on<br />
many factors, including the distance residents need to travel and the safety <strong>of</strong> the bicycle or<br />
pedestrian route. If the typical <strong>Bloomington</strong> resident has an average 19‐minute commute<br />
by car, how feasible is it for the typical resident to bike to work? What about biking or<br />
walking to other necessary destinations such as the grocery store, school, the doctor’s<br />
<strong>of</strong>fice, etc.?<br />
153 <strong>Bloomington</strong> Bicycle and Pedestrian Transportation and Greenways System Plan (March 2008),<br />
http://bloomington.in.gov/media/media/application/pdf/57.pdf<br />
<strong>Report</strong> <strong>of</strong> the <strong>Bloomington</strong> <strong>Peak</strong> <strong>Oil</strong> <strong>Task</strong> <strong>Force</strong><br />
119
The Distance Factor<br />
The greater the distances people travel in their cars to get to work and other destinations,<br />
the more vulnerable those residents are to a decline in cheap oil. A car driving at an<br />
average speed <strong>of</strong> 20 miles per hour travels about 3.3 miles in 10 minutes. At a pace <strong>of</strong> three<br />
miles per hour, it would take a person on foot over an hour to cover the same distance. It<br />
would take a non‐athlete biker rider about 22 minutes. The following graph shows average<br />
work commute times for <strong>Bloomington</strong> residents in 2000.<br />
Percentage <strong>of</strong> Workers<br />
60.00%<br />
50.00%<br />
40.00%<br />
30.00%<br />
20.00%<br />
10.00%<br />
0.00%<br />
Less than<br />
10 minutes<br />
<strong>Bloomington</strong> Commute Time 2000 Census<br />
<strong>Report</strong> <strong>of</strong> the <strong>Bloomington</strong> <strong>Peak</strong> <strong>Oil</strong> <strong>Task</strong> <strong>Force</strong><br />
10‐19 20‐29 30‐44 45‐59 60 or more<br />
Commute Time<br />
In 2000, about 32 percent <strong>of</strong> all commutes by <strong>Bloomington</strong> residents took less than ten<br />
minutes, and about 50 percent took 10‐19 minutes. Using the average speeds for walking<br />
and biking above, a driver who drives within the city and needs less than 10 minutes to get<br />
to work might be able to substitute walking or biking, although walking would require a<br />
considerable adjustment in time management. A nine minute car ride could be replaced by<br />
a roughly 45 minute walk or a bike ride <strong>of</strong> 20 minutes or less.<br />
To put this into perspective, new urbanist planners assume ¼ mile to be a comfortable<br />
walking distance to grocery stores and other necessities <strong>of</strong> life. This translates into a five‐<br />
minute walk. If a commuter currently enjoys a five‐mile 16‐minute commute by car,<br />
walking the same distance would take over an hour and a half, while biking would take<br />
120
about 35 minutes.<br />
In other words, if around 67 percent <strong>of</strong> <strong>Bloomington</strong> residents currently drive alone to<br />
work and the average commute time for most <strong>of</strong> these drivers is 19 minutes, then a shift to<br />
other modes <strong>of</strong> transportation will require a change in habits. For Monroe County residents<br />
commuting into <strong>Bloomington</strong>, walking<br />
is almost certainly out <strong>of</strong> the question<br />
and biking would be a challenge. The<br />
greater the distance, the lower the<br />
likelihood that people will turn to<br />
bicycles or walking as ways to get to<br />
work, or anywhere else.<br />
Land Use Patterns<br />
Source: The Associated Press<br />
As discussed in the previous chapter, settlement patterns <strong>of</strong> the past have really been<br />
shaped by cheap fuel and with little regard to non‐car transportation. Most new housing<br />
developments are separated from other land uses such as schools, shopping centers,<br />
workplaces, day care centers, garden supply stores, hardware stores, theaters, and<br />
workplaces. In <strong>Bloomington</strong>, the distances between these destinations are easy and fast to<br />
overcome by car and, given the low fuel prices that prevailed for decades, it was also<br />
inexpensive. However, for most people, the current land use patterns are major<br />
impediments to biking and walking. In some instances, residential areas are physically<br />
adjacent to shopping areas and other land uses, but no direct road connections exist<br />
between them, for fear that traffic might spill into the neighborhood.<br />
Taking into consideration all the different things that people are accustomed to doing on a<br />
daily basis and considering that residents <strong>of</strong>ten make multiple trips in different directions<br />
to reach different destinations, walking and biking are just not feasible alternatives –<br />
especially if trips involve young children, or the elderly who may move around more<br />
slowly.<br />
<strong>Report</strong> <strong>of</strong> the <strong>Bloomington</strong> <strong>Peak</strong> <strong>Oil</strong> <strong>Task</strong> <strong>Force</strong><br />
121
Pedestrian Friendliness<br />
Just how “walkable” is <strong>Bloomington</strong>? In effort to determine this, the <strong>Task</strong> <strong>Force</strong> calculated<br />
the “WalkScore” <strong>of</strong> each <strong>of</strong> the pre‐defined 55 Natural<br />
Neighborhoods (Map D, p. 101). 154 WalkScore measures<br />
the walkability <strong>of</strong> an address. The WalkScore system<br />
awards points based on proximity <strong>of</strong> an address to<br />
destinations. Walkability falls out into the following<br />
categories:<br />
• 90–100 = Walkers' Paradise: Most errands can<br />
be accomplished on foot and many people get by<br />
without owning a car.<br />
• 70–89 = Very Walkable: It's possible to get by<br />
without owning a car.<br />
• 50–69 = Somewhat Walkable: Some stores and<br />
amenities are within walking distance, but many<br />
everyday trips still require a bike, public<br />
transportation, or car.<br />
• 25–49 = CarDependent: Only a few<br />
destinations are within easy walking range. For most errands, driving or public<br />
transportation is a must.<br />
• 0–24 = CarDependent (Driving Only): Virtually no neighborhood destinations<br />
within walking range. You can walk from your house to your car!<br />
If the closest amenity in a category is within .25 miles (or .4 km), WalkScore assigns the<br />
maximum number <strong>of</strong> points. The number <strong>of</strong> points declines as the distance approaches 1<br />
mile (or 1.6 km) ‐‐ no points are awarded for amenities further than 1 mile.<br />
Unfortunately, our “walkability” analysis <strong>of</strong> the city reveals that no neighborhood is<br />
considered a “Walker’s Paradise” and only seven are considered “Very Walkable.”<br />
It should be noted that when WalkScore maps proximity to a designation, it does so<br />
without regard to the nature <strong>of</strong> the destination. All destinations are granted equal weight:<br />
154 www.walkscore.com<br />
<strong>Report</strong> <strong>of</strong> the <strong>Bloomington</strong> <strong>Peak</strong> <strong>Oil</strong> <strong>Task</strong> <strong>Force</strong><br />
122
grocery stores, taverns, c<strong>of</strong>fee shops, and nail salons are considered equally valuable<br />
destinations as grocery stores and doctors’ <strong>of</strong>fices. The <strong>Task</strong> <strong>Force</strong> attempted to take a<br />
more refined look at the activity <strong>of</strong> each neighborhood, by mapping only essential services.<br />
Please refer to the Land Use chapter <strong>of</strong> this <strong>Report</strong> for an analysis <strong>of</strong> the Activity Nodes map<br />
(Map A). While WalkScore does not prioritize destinations, it is nevertheless an important<br />
tool in understanding the pedestrian friendliness <strong>of</strong> the city’s neighborhoods.<br />
<strong>Report</strong> <strong>of</strong> the <strong>Bloomington</strong> <strong>Peak</strong> <strong>Oil</strong> <strong>Task</strong> <strong>Force</strong><br />
123
MAP E: WalkScore Analysis <strong>of</strong> 55 Natural Neighborhoods<br />
<strong>Report</strong> <strong>of</strong> the <strong>Bloomington</strong> <strong>Peak</strong> <strong>Oil</strong> <strong>Task</strong> <strong>Force</strong> 124
Cyclist using bike lane on Washington Street<br />
<strong>Report</strong> <strong>of</strong> the <strong>Bloomington</strong> <strong>Peak</strong> <strong>Oil</strong> <strong>Task</strong> <strong>Force</strong><br />
Perhaps the biggest hurdle to biking in and<br />
around <strong>Bloomington</strong> is the lack <strong>of</strong> facilities on<br />
arterials. The <strong>Bloomington</strong> Growth Policies Plan<br />
(GPP) gives priority to biking by suggesting all<br />
primary arterials, secondary arterials, and<br />
primary collectors within the <strong>City</strong> be constructed<br />
with four‐foot bike lanes in both directions.<br />
However, as pointed out in the<br />
<strong>Bloomington</strong>/Monroe County Metropolitan<br />
Planning Organization’s 2030 LongRange Transportation Plan:<br />
Many existing primary and secondary arterials were constructed prior to this<br />
new emphasis on alternative transportation, and thus lack adequate<br />
alternative transportation facilities….The obstacles are arguably greatest for<br />
bicyclists on these roads due to the lack <strong>of</strong> multi‐use paths/bike lanes,<br />
narrow travel lane widths, and vehicular speeds which create uncomfortable<br />
and potentially unsafe riding situations. 155<br />
<strong>Peak</strong> oil provides us with an additional rationale for working toward retr<strong>of</strong>itting<br />
these arterials with safer facilities for bicycles and pedestrians.<br />
VULNERABILITIES: BICYCLE & PEDESTRIAN<br />
The most critical vulnerabilities <strong>of</strong> our bicycle and pedestrian infrastructure include the<br />
following:<br />
1. Most destinations are located far from residences.<br />
2. Major arterial streets in the city lack adequate bicycle facilities.<br />
155 <strong>Bloomington</strong>/Monroe County Metropolitan Planning Organization, 2030 LongRange Transportation Plan, 68.<br />
125
THE CURRENT SITUATION: PUBLIC TRANSPORTATION<br />
Public transportation in our community is primarily provided by three bus services:<br />
<strong>Bloomington</strong> Transit Corporation, <strong>Indiana</strong> University Bus System and Rural Transit.<br />
Neither the city nor the county have any form <strong>of</strong> passenger rail connection to surrounding<br />
communities.<br />
<strong>Bloomington</strong> Transit and <strong>Indiana</strong> University Campus Bus System<br />
<strong>Bloomington</strong> Transit (BT) operates nine routes within the corporate boundaries <strong>of</strong> the <strong>City</strong><br />
<strong>of</strong> <strong>Bloomington</strong>. The regular BT fare for non‐IU students is $1; monthly passes are<br />
available at $30; and semi‐annual passes are $150. There are free transfers to other BT and<br />
Rural Transit routes. <strong>Bloomington</strong> Transit operates two routes<br />
on Sundays. Reduced service is <strong>of</strong>fered on Saturdays. All fleet<br />
buses are equipped with bike racks and wheelchair ramps or<br />
lifts. <strong>Bloomington</strong> Transit also operates BT Access, a<br />
transportation service for passengers with disabilities who<br />
cannot use the "fixed route" bus system.<br />
Between 2006 and 2008, BT ridership increased by 20 percent. 156 This increase resulted<br />
partly from an increase in the IU student population and partly from an increase in gasoline<br />
prices. The growth in ridership demonstrates that behavior in <strong>Bloomington</strong> tracks national<br />
trends. According to the American Public Transportation Association, on average there<br />
was an increase in bus use across the nation by 3.9 percent, “but in communities with a<br />
population <strong>of</strong> less than 100,000, bus services saw an increase <strong>of</strong> 9.3 percent in 2008.” 157<br />
<strong>Bloomington</strong> had the highest per capita ridership <strong>of</strong> any city in <strong>Indiana</strong> with over 40<br />
passengers per capita using transit in 2008. 158<br />
156 2,363,526 in 2006; 2,570,117 in 2007; 2,829,950 in 2008 (via Lew May, BT General Manager).<br />
157 American Public Transportation Association, Transit News, March 9, 2009.<br />
http://www.apta.com/media/releases/090309_ridership.cfm<br />
158 In 2008, <strong>Bloomington</strong> Transit had 3 million riders. <strong>Bloomington</strong> has a population <strong>of</strong> approximately<br />
70,000. <strong>Indiana</strong> Department <strong>of</strong> Transportation.<br />
<strong>Report</strong> <strong>of</strong> the <strong>Bloomington</strong> <strong>Peak</strong> <strong>Oil</strong> <strong>Task</strong> <strong>Force</strong><br />
126
The <strong>Indiana</strong> University Campus Bus System travels to all points on campus, to downtown<br />
<strong>Bloomington</strong>, and to the College Mall. The service is available every day <strong>of</strong> the week, with<br />
reduced service during breaks and on holidays. The service is a fare‐free system, and<br />
includes BT buses. BT initiated its free‐to‐students initiative in 1999 and saw a marked<br />
increase in student ridership. Currently, students comprise approximately two <strong>of</strong> every<br />
three BT riders. 159<br />
Rural Transit<br />
Rural Transit is a bus service administered by the Area 10 Agency on Aging. The service is<br />
available for everyone ‐‐ regardless <strong>of</strong> age ‐‐ in Monroe, Owen, and Lawrence Counties. To<br />
travel within one county, adults pay $.75. Two‐county fare is $1.50 for adults. Senior<br />
citizens are asked to donate the full fare amount. Monthly passes are available. One‐county<br />
monthly passes are $15.00 while two‐county monthly passes are $18.00. Transfers to and<br />
Source: http://transitionnetwork.org/Primer/TransitionInitiativesPrimer.pdf<br />
<strong>Report</strong> <strong>of</strong> the <strong>Bloomington</strong> <strong>Peak</strong> <strong>Oil</strong> <strong>Task</strong> <strong>Force</strong><br />
from <strong>Bloomington</strong> Transit and the <strong>Indiana</strong><br />
University Campus Bus Service are free.<br />
This transfer agreement is key as Rural<br />
Transit provides an important connection<br />
for trips originating in <strong>Bloomington</strong><br />
bound for destinations outside city limits.<br />
<strong>Indiana</strong>polis Airport Shuttles<br />
<strong>Bloomington</strong> Shuttle and Star <strong>of</strong> <strong>Indiana</strong><br />
are private companies that provide<br />
shuttle services to the <strong>Indiana</strong>polis<br />
airport. <strong>Bloomington</strong> Shuttle picks up and<br />
drops <strong>of</strong>f passengers at four locations<br />
within <strong>Bloomington</strong>. The Star picks up and drops <strong>of</strong>f passengers at several IU campus<br />
locations.<br />
159 This free‐fare system is financed by a universal transportation fee charged to IU students. Notably, The<br />
<strong>City</strong> <strong>of</strong> <strong>Bloomington</strong> and Monroe County governments both provide BT bus pass access to all their employees.<br />
127
Hoosier Bus<br />
Hoosier Bus is <strong>Indiana</strong> University's express bus service from IU to the Chicago area for key<br />
holidays, semester breaks, and select weekend trips. Ft. Wayne and South Bend routes are<br />
in the planning stages.<br />
No Transit Service to Downtown <strong>Indiana</strong>polis, or Other Neighboring Cities<br />
There is currently no regular bus service, private or public, that connects <strong>Bloomington</strong> with<br />
downtown <strong>Indiana</strong>polis, or any other larger city in the region. The <strong>Bloomington</strong> downtown<br />
Greyhound station was closed several years ago. To reach the <strong>Indiana</strong>polis passenger train<br />
and Greyhound stations, a traveler without a car would have to take the shuttle to the<br />
<strong>Indiana</strong>polis Airport, and then a bus from the airport to downtown <strong>Indiana</strong>polis.<br />
<strong>Report</strong> <strong>of</strong> the <strong>Bloomington</strong> <strong>Peak</strong> <strong>Oil</strong> <strong>Task</strong> <strong>Force</strong><br />
128
VULNERABILITIES: PUBLIC TRANSIT<br />
Currently, public transit comprises a small slice <strong>of</strong> the transportation pie. Only a small<br />
portion <strong>of</strong> the population makes use <strong>of</strong> it. As discussed earlier, only 2.8 percent <strong>of</strong> all work<br />
commutes are on public transit. 160 Similarly, a study conducted by the <strong>Indiana</strong> Department<br />
<strong>of</strong> Transportation in 2008 found that public transportation serves just 1.4 percent <strong>of</strong> all<br />
<strong>Bloomington</strong>’s travel demands. 161<br />
1. Fuel prices will be volatile and will increase.<br />
While transit is <strong>of</strong>ten seen as an alternative to driving when gas prices are high, it is<br />
important to remember that transit itself is vulnerable to increased fuel costs and<br />
decreased revenue. According to a recent article in The New York Times, “more people used<br />
transit in 2008 than in any year since 1956,” but at the same time, many “transit systems<br />
across the country are raising fares and cutting service as the tax revenue they rely on<br />
plummets during the recession.” 162 This constitutes a problem, considering that extreme<br />
swings in fuel prices are expected to continue as petroleum supplies diminish worldwide.<br />
As discussed earlier, high fuel prices are predicted to drive demand destruction and stifle<br />
economic activity, leading to recessions and wild price fluctuations.<br />
In 2008, as fuel prices soared, BT was forced to reduce the frequency <strong>of</strong> its service on some<br />
campus routes. This was because IU was not able to increase its contributions to BT to keep<br />
up with fuel costs. IU is only able to commit to a reimbursement schedule on a biannual<br />
basis, due to its state‐mandated budgeting process. BT could not receive additional funding<br />
from IU in a non‐budget year. The IU campus bus system itself also reduced service due to<br />
the same budgeting process dilemma.<br />
160 2000 U.S. Census<br />
161 This compares to a “transit share” <strong>of</strong> 0.4 percent in the <strong>Indiana</strong>polis metro area. Overall, in <strong>Indiana</strong>, the<br />
current urban transit mode share for <strong>Indiana</strong> is 0.46 percent <strong>of</strong> all trips. <strong>Indiana</strong> Department <strong>of</strong><br />
Transportation, December 2008, Executive Summary, <strong>Indiana</strong> Mass Transit Studies PL 203‐2007.<br />
162 Michael Cooper, “Transit Use Hit Five‐Decade High in 2008 as Gas Prices Rose,” The New York Times,<br />
March 9, 2009. http://www.nytimes.com/2009/03/09/us/09transit.html?_r=1<br />
<strong>Report</strong> <strong>of</strong> the <strong>Bloomington</strong> <strong>Peak</strong> <strong>Oil</strong> <strong>Task</strong> <strong>Force</strong><br />
129
BT owns 42 conventional diesel buses and 2 diesel‐electric buses. In 2008, BT consumed<br />
283,699.5 gallons <strong>of</strong> diesel. Based on rapidly‐increasing fuel costs in 2008, BT proposed an<br />
84 percent increase in the fuel/oil line item for it 2009 budget – from $702,000 in 2008 to<br />
$1,296,108 in 2009. During this time, BT’s total operating expenses increased from<br />
$5,724,498 to $6,603,059 ‐‐ a difference <strong>of</strong> $878,561.<br />
<strong>Bloomington</strong> Transit Fuel Cost Increases, 20082009<br />
Year Fuel Costs Operating Budget<br />
Fuel Costs as % <strong>of</strong><br />
Total Budget<br />
2008 $702,000 $5,724,498 12.26%<br />
2009 $1,296,108 $6,603,059 19.63%<br />
% Increase 85% 15%<br />
Source: <strong>Bloomington</strong> Transit<br />
2. <strong>Bloomington</strong> Transit has an inadequate fuel reserve.<br />
BT is also vulnerable to acute fuel shortages, as it stores only a four‐day supply (20,000<br />
gallons) <strong>of</strong> fuel. Even the shortest <strong>of</strong> supply disruptions could shut down the public bus<br />
system, right at a time when the need for public transit would be the greatest.<br />
BT has already taken steps to reduce its dependency on petroleum. In addition to 42<br />
conventional diesel buses, BT has 2 diesel‐electric hybrid buses in its fleet and will add four<br />
more by the end <strong>of</strong> 2009. At the time this <strong>Report</strong> was issued, BT was seeking federal funds<br />
to buy an additional five diesel‐electric hybrids. Hybrid buses average about 25 percent<br />
better mileage than conventional diesel buses <strong>of</strong> the same size.<br />
A peculiar federal funding formula essentially makes transit dependent on the federal gas<br />
tax. Gas tax revenue will decline as gasoline use declines. For that reason, we will need to<br />
invest much more substantially in public transit from local funds to make it a realistic<br />
alternative to personal automobile use.<br />
<strong>Report</strong> <strong>of</strong> the <strong>Bloomington</strong> <strong>Peak</strong> <strong>Oil</strong> <strong>Task</strong> <strong>Force</strong><br />
130
3. Transit is still not convenient for many.<br />
As fuel prices skyrocketed in 2008, people in cities with a well‐developed public transit<br />
system left their cars at home and switched to public transit. 163 However, switching to<br />
transit will <strong>of</strong>ten come at the expense <strong>of</strong> time.<br />
In <strong>Bloomington</strong>, while it is likely not too difficult for most people close to the city<br />
center to find a bus stop within short walking distance, once a patron is on the bus,<br />
she may be faced with a long ride to get to a destination as the bus probably does not take<br />
the direct route one would follow when driving. To get to a destination, a patron may have<br />
to transfer to another bus line at the downtown hub. In short, for many, the switch to<br />
public transit will be difficult because <strong>of</strong> the time it takes to use the system. If people<br />
continue to drive for this reason, they may experience increased financial hardship.<br />
However, with adjustments, transit can be made a viable transportation alterative for more<br />
residents. BT has an impressive number <strong>of</strong> bus stops – 500. Not only is the number<br />
impressive, but most bus stops are within a walkable distance (.25 mile) <strong>of</strong> most residents<br />
(See Map F, following page 164 ). To make BT a more viable and attractive alternative to the<br />
automobile, it would have to <strong>of</strong>fer more frequent service, including weekends and late at<br />
night as well as add routes to previously under‐served areas. This would require a<br />
considerable increase in funding for BT. Unless funding is secured in anticipation <strong>of</strong> future<br />
episodes <strong>of</strong> dramatic fuel price spikes, we may be faced again with a situation where, as in<br />
2008, bus service actually has to be cut, when it should be expanded.<br />
163 American Public Transportation Association, Transit News, March 9, 2009.<br />
http://www.apta.com/media/releases/090309_ridership.cfm<br />
164 Please note this map should also include Basswood Drive, Whitehall Crossing Shopping enter and S.<br />
Walnut from Winslow all the way down to Rhoer Road as stops within walking distance.<br />
<strong>Report</strong> <strong>of</strong> the <strong>Bloomington</strong> <strong>Peak</strong> <strong>Oil</strong> <strong>Task</strong> <strong>Force</strong><br />
131
MAP F: Walkability <strong>of</strong> <strong>Bloomington</strong> Transit Bus Stops<br />
<strong>Report</strong> <strong>of</strong> the <strong>Bloomington</strong> <strong>Peak</strong> <strong>Oil</strong> <strong>Task</strong> <strong>Force</strong> 132
4. Funding is inadequate.<br />
The fact that securing funding for transit improvements will be critical is confirmed by<br />
INDOT’s 2008 Mass Transit Study. 165 The study states that “Local bus systems are<br />
undersized in <strong>Indiana</strong>’s cities, and thus currently serve a primarily transit‐dependent<br />
population.” 166 To attract additional riders, the study suggests that “service expansion<br />
should focus on building fleet sizes and adding more frequent service in the existing service<br />
areas, with limited expansion to new destinations that are focused on access to<br />
employment (i.e. Express Bus). Low‐frequency service is currently a barrier to higher<br />
utilization <strong>of</strong> the system, especially by choice riders.” 167<br />
What is <strong>of</strong> special interest for this <strong>Report</strong> and the assessment <strong>of</strong> vulnerabilities is that the<br />
INDOT Mass Transit Study also states that the current mix <strong>of</strong> transportation funding<br />
available to improve transit systems does not generate sufficient revenue to accommodate<br />
the recommended transit investments that are necessary to meet current unmet demands,<br />
much less the likely increases in demand as a result <strong>of</strong> peak oil. The pattern outlined in the<br />
INDOT study makes it clear that the national trend <strong>of</strong> driving less translates into reduced<br />
federal fuel tax revenues, which means fewer federal tax dollars are available for transit<br />
and highway programs in the <strong>State</strong> <strong>of</strong> <strong>Indiana</strong>.<br />
Investing in our public transit infrastructure to make it easier for people to use the system<br />
will result in greater ridership. Greater ridership will translate into greater funding to<br />
make up for the shortfall lost to decreased revenue from the federal gasoline tax.<br />
165 <strong>Indiana</strong> Department <strong>of</strong> Transportation, Executive Summary, <strong>Indiana</strong> Mass Transit Studies PL 203‐2007,<br />
(December 2008), E‐6.<br />
166 “Transit‐dependent” refers to people who cannot drive because they are poor, sick, too old to drive, or<br />
disabled.<br />
167 Ibid.<br />
<strong>Report</strong> <strong>of</strong> the <strong>Bloomington</strong> <strong>Peak</strong> <strong>Oil</strong> <strong>Task</strong> <strong>Force</strong><br />
133
5. Intercity rail is not available.<br />
Intercity passenger rail is currently not available, even though there is some interest in<br />
developing a <strong>Bloomington</strong>‐<strong>Indiana</strong>polis rail or commuter bus connection at the state<br />
level. 168 Having intercity rail or a commuter bus system fueled by renewable fuels would be<br />
a great benefit for <strong>Bloomington</strong> and Monroe County, and would be a necessary complement<br />
to a well‐developed local transit system. Together, these modes would significantly help<br />
reduce our collective reliance on the personal automobile.<br />
6. Ride shares and car pools are not prevalent.<br />
People commuting to <strong>Indiana</strong>polis to work or study <strong>of</strong>ten informally arrange for ride<br />
shares to cut down on driving time and to save fuel. Ridesharing in <strong>Indiana</strong> is becoming a<br />
bit more organized thanks to on‐line tools whereby <strong>Bloomington</strong>ians and others can<br />
arrange car pools for daily commuting, cross‐country travel, or short occasional trips for<br />
shopping or for going to the doctor or to the airport. 169<br />
7. Monroe County Community School Corporation is highly dependent upon<br />
petroleum.<br />
Like other major regional institutions, the Monroe County Community School Corporation<br />
(MCCSC) is highly reliant on petroleum and is vulnerable to a decline in cheap oil. In 2007,<br />
MCCSC consumed 189,000 gallons <strong>of</strong> liquid fuel. That is about 1,050 gallons per day for the<br />
180 days that school is in session. MCCSC has a storage capacity <strong>of</strong> 24,000 gallons ‐ 12,000<br />
gallons <strong>of</strong> unleaded and 12,000 gallons <strong>of</strong> diesel. All the school buses run on diesel; while<br />
the maintenance vehicles run on gasoline.<br />
MCCSC buses run about 11,000 miles per day, and get between 6 and 10 miles per gallon.<br />
This means that fuel use for buses is somewhere between 1,100 and 1,800 gallons per day.<br />
With a 12,000 gallon tank for diesel, this means that MCCSC has only between 6.5 days and<br />
168 See, <strong>Indiana</strong> Department <strong>of</strong> Transportation, Final <strong>Report</strong>: Central <strong>Indiana</strong> Commuter Rail Feasibility Study,<br />
August 2008.<br />
169 See for example http://www.erideshare.com/statecity/IN.htm and http://www.carpoolworld.com/ for<br />
details<br />
<strong>Report</strong> <strong>of</strong> the <strong>Bloomington</strong> <strong>Peak</strong> <strong>Oil</strong> <strong>Task</strong> <strong>Force</strong><br />
134
11 days worth <strong>of</strong> supplies when all tanks are filled 100 percent. Depending on the<br />
frequency <strong>of</strong> fuel deliveries, actual reserves on hand at any one time could be far less.<br />
Like <strong>Bloomington</strong> Transit and the IU Campus Bus System, MCCSC struggled with finding<br />
ways to cover increasing fuel costs in 2008. Indeed, by September 2008, the school<br />
corporation found itself with a $150,000 shortfall in its transportation budget. MCCSC<br />
tried to meet this shortfall by consolidating programs, transferring money from its school<br />
bus replacement fund and charging student athletes with a transportation fee.<br />
<strong>Report</strong> <strong>of</strong> the <strong>Bloomington</strong> <strong>Peak</strong> <strong>Oil</strong> <strong>Task</strong> <strong>Force</strong><br />
135
MITIGATION GOALS & STRATEGIES<br />
In the summer <strong>of</strong> 2008, households, businesses and public entities responded to higher fuel<br />
prices in very predictable and pragmatic ways: they cut unnecessary trips, sought ways to<br />
increase fuel efficiency and switched to public transportation options, if available. In this<br />
period, the number <strong>of</strong> miles traveled by residential vehicles in the U.S. fell by 3.6 percent. 170<br />
Such a reduced reliance on the car is good practice for preparing for a permanent decline in<br />
the availability <strong>of</strong> cheap oil, but to really prepare for peak, we need to invest in a less<br />
petroleum‐dependent infrastructure and we need to move towards broader cultural<br />
acceptance <strong>of</strong> walking, biking and public transit and other alternatives to the single‐<br />
occupancy vehicle.<br />
In planning for this transition, it is important to realize that within the coming 10‐15 years,<br />
it is unlikely that we will see the drastic across‐the‐board increases in vehicle fuel<br />
efficiency that will be needed to fully compensate for the effects <strong>of</strong> price increases or<br />
reduced availability <strong>of</strong> fuels. Nor are alternative fuels likely to be available at the scale and<br />
at the price to which people have been accustomed.<br />
Therefore, as petroleum supplies diminish and prices increase, we can anticipate that:<br />
• Higher fuel prices will consume greater proportions <strong>of</strong> public and private<br />
budgets;<br />
• The distance that raw materials, goods and people travel to reach their<br />
endpoint must be reduced;<br />
• Where long‐distance transport <strong>of</strong> raw materials, goods and people is critical, much<br />
more efficient modes <strong>of</strong> transportation must be identified; and<br />
• To reduce the risks from fuel shortages, we need to convert our vehicles to<br />
alternative fuels, or make sure we invest in fuel storage.<br />
170 U.S. Department <strong>of</strong> Energy, “U.S. Transit Use Up, Driving Down in 2008,” Energy Efficiency and Renewable<br />
Energy News, March 11, 2009, http://apps1.eere.energy.gov/news/news_detail.cfm/news_id=12283<br />
<strong>Report</strong> <strong>of</strong> the <strong>Bloomington</strong> <strong>Peak</strong> <strong>Oil</strong> <strong>Task</strong> <strong>Force</strong><br />
136
In proposing the measures below, our premise is that the best way to mitigate the social<br />
and economic disruptions from declining petroleum supplies is to proactively embrace,<br />
plan, prepare for and support the necessary restructuring and adaptations in local public<br />
and private transportation systems. Therefore, most <strong>of</strong> the mitigation measures proposed<br />
below are focused on implementing strategies in the very near term with the aim <strong>of</strong><br />
realizing a substantive reduction in oil reliance in the long term.<br />
SHORTTERM (15 Years)<br />
1. Use “lows” in fuel price swings wisely: reduce consumption, establish an<br />
emergency fuel fund.<br />
It is unclear how long the current recession will last and how long fuel prices will remain<br />
relatively low. It may be years until the world economy – and fuel prices – rebound, or it<br />
may happen rather quickly. Several public entities responded to the price spikes in 2007<br />
and 2008 by increasing fuel budgets for 2009. Then fuel prices declined. These are the<br />
price swings symptomatic <strong>of</strong> oil price volatility we can expect in the future. Public and<br />
private entities, including the <strong>City</strong> <strong>of</strong> <strong>Bloomington</strong>, <strong>City</strong> <strong>of</strong> <strong>Bloomington</strong> Utilities,<br />
<strong>Bloomington</strong> Transit, <strong>Indiana</strong> University, Monroe County, the Monroe County School<br />
system, as well as households, businesses, churches and other institutions, can benefit by<br />
planning for future increases in fuel prices now.<br />
In anticipation <strong>of</strong> price volatility, public and private entities should use current and future<br />
temporary reductions in fuel prices to redirect already budgeted higher fuel expenses into:<br />
a) investments that promise lower fuel consumption in the future; or<br />
b) special emergency funds that can help buffer spiraling fuel costs in the<br />
future.<br />
Over time, these funds should become less and less important. They are only helpful as long<br />
as needed reductions in travel demands are not yet accomplished, and/or there is a<br />
continuing need for fossil fuels. Basically, this amounts to planning upcoming budgets as if<br />
fuel prices were to remain chronically high and directing any surplus funds during times <strong>of</strong><br />
low prices into projects that reduce fossil fuel demand in the long run, or into emergency<br />
funds to buffer price spikes.<br />
<strong>Report</strong> <strong>of</strong> the <strong>Bloomington</strong> <strong>Peak</strong> <strong>Oil</strong> <strong>Task</strong> <strong>Force</strong><br />
137
2. Develop a community cooperative rideshare system.<br />
One <strong>of</strong> the greatest transportation vulnerabilities stems from current land use and<br />
commuting patterns. About 19 percent <strong>of</strong> the Monroe County workforce commutes from<br />
surrounding counties. Even within the county, there are pockets <strong>of</strong> low‐density exurban<br />
settlement that are distant from activity nodes and for which it is costly to provide public<br />
transit.<br />
In the short‐term, one <strong>of</strong> the easiest and most effective ways to<br />
drastically increase fuel efficiency is not the purchase <strong>of</strong> more fuel‐<br />
efficient vehicles, but decreasing fuel use per passenger mile by<br />
maximizing the capacity <strong>of</strong> our community’s existing vehicles. Over the<br />
next five years, the community’s biggest employers – <strong>Indiana</strong> University,<br />
the <strong>City</strong> <strong>of</strong> <strong>Bloomington</strong>, Monroe County, <strong>Bloomington</strong> Hospital, schools, and other<br />
organizations – should work cooperatively to establish an electronic carpooling match<br />
system whereby employees <strong>of</strong> any <strong>of</strong> these institutions can identify ride share<br />
opportunities with the employees <strong>of</strong> any <strong>of</strong> the other entities. By combining all the<br />
workplaces, the pool <strong>of</strong> people seeking and <strong>of</strong>fering ride shares is increased, making it<br />
more likely that people who commute from other counties and whose residences are<br />
distributed over a large area will find someone else close by with whom they are able to<br />
share the commute.<br />
Having a well‐designed ride‐sharing system like this in place would provide much needed<br />
insurance against sudden price spikes and fuel shortages. The higher prices rise, the more<br />
attractive it would be to participate in the system. The benefits to each participant would<br />
be immediate and major disruptions from people not being able to afford the trip to work<br />
could be avoided.<br />
<strong>Report</strong> <strong>of</strong> the <strong>Bloomington</strong> <strong>Peak</strong> <strong>Oil</strong> <strong>Task</strong> <strong>Force</strong><br />
138
3. Implement a carsharing program.<br />
A natural complement to a ride share program is a car<br />
share program. Car sharing is an urban car rental<br />
service whereby customers who sign up as members<br />
can reserve a rental car for periods <strong>of</strong> time as short as<br />
one hour. Patrons pick up the car at a designated<br />
place in their neighborhood and return it to the same<br />
spot. Car sharing allows people who only<br />
occasionally need a car, to get rid <strong>of</strong> their car. To take<br />
advantage <strong>of</strong> such a program, participants become<br />
members <strong>of</strong> a car sharing coop or program. Rates are<br />
affordable and include fuel, maintenance, insurance<br />
and parking <strong>of</strong> the vehicle at its home site.<br />
Car sharing allows for those commuting via ride<br />
share, transit, bike or foot to have short‐term access<br />
to a car when needed. Car sharing is widely<br />
recognized to be a key component <strong>of</strong> an integrated<br />
mobility‐management system and enjoys wide‐<br />
spread use in cities such as: Seattle, Chicago,<br />
Portland, Long Beach, Los Angeles, Denver, San Diego,<br />
Toronto, Boston, New York, and Washington, DC. In<br />
these cities, for‐pr<strong>of</strong>it or non‐pr<strong>of</strong>it organizations<br />
maintain the car sharing fleet and reservation<br />
website. Recently, the <strong>City</strong> <strong>of</strong> Baltimore, Maryland<br />
issued a request for proposals to establish a car share<br />
program for its residents. 171<br />
<strong>Report</strong> <strong>of</strong> the <strong>Bloomington</strong> <strong>Peak</strong> <strong>Oil</strong> <strong>Task</strong> <strong>Force</strong><br />
Car sharing: A Brief Review<br />
Car sharing in the U.S. has gained<br />
increasing popularity ever since the<br />
first program began in Portland in<br />
1998. A car sharing system has a<br />
relatively small fleet <strong>of</strong> vehicles<br />
available at designated stations<br />
exclusively for use by members <strong>of</strong><br />
the program. Members reserve<br />
vehicles on an hourly basis, and may<br />
do so online or by phone.<br />
Car sharing allows individuals to<br />
gain the benefits <strong>of</strong> a private vehicle<br />
without having to own one. In some<br />
cases, car sharing can make having a<br />
car-free home feasible.<br />
Car sharing improves mobility,<br />
reduces vehicle miles travelled,<br />
reduces greenhouse gas emissions,<br />
reduces traffic congestion and<br />
parking problems, increases<br />
alternative transportation options,<br />
<strong>of</strong>fers savings for members; and<br />
expands access to cars to individuals<br />
who do not own a vehicle.<br />
Municipalities can play a role in<br />
helping to promote car sharing.<br />
Seattle has parking stalls designated<br />
specifically for car sharing vehicles.<br />
Austin provides parking spaces for<br />
car sharing vehicles and exempts<br />
them from parking meter charges.<br />
San Francisco requires dedicated<br />
parking for car sharing vehicles for<br />
all new residential projects with 50<br />
units or more.<br />
Compiled by: Sarah Germann<br />
171 http://www.cmtalliance.org/news_files/carsharerfp/Car%20Share%20RFP%202009.pdf<br />
139
The <strong>City</strong> should establish or encourage the establishment <strong>of</strong> a city‐wide car sharing<br />
program. Car sharing reduces the need for personal vehicle ownership and the demand for<br />
parking. It also stands to save residents money and would allow local businesses and non‐<br />
pr<strong>of</strong>its to economize on their fleets.<br />
4. Land use: make the best <strong>of</strong> the existing built environment.<br />
The goal <strong>of</strong> post‐peak land use planning with regard to transportation is bringing daily<br />
necessities closer to where people live, so that biking, walking and transit become more<br />
feasible and automobile trips become shorter. This can be done by facilitating changes in<br />
land use toward increased density and mixed use. Since the built environment changes<br />
rather slowly, the priority within the first five years is to make the best <strong>of</strong> what we have, by<br />
starting the process <strong>of</strong> changing how existing structures can be used.<br />
As outlined in the previous chapter on Land Use, one obvious improvement would be to<br />
encourage even more mixed uses in our zoning laws, making it possible for small<br />
businesses to locate closer to where their customers live, thus reducing the need for<br />
automobile trips and facilitating walking, biking, and public transit. Another improvement<br />
would be to allow more flexibility for home owners to divide up an existing building into<br />
smaller units, to add wings, or to add granny flats, in order to create additional dwelling<br />
units. 172 These measures increase population density, and may meet a growing need for<br />
fairly inexpensive housing close to activity nodes, as more people want to live closer to<br />
where they work and shop. Besides facilitating walking and biking, increasing density is a<br />
very important aspect <strong>of</strong> making public transportation cost‐effective and attractive for both<br />
riders and providers. To start that process, community involvement and support are<br />
necessary. Ideally, the process <strong>of</strong> allowing a more flexible use <strong>of</strong> the existing built<br />
environment should be propelled from the “bottom up.”<br />
172 Permitting granny flats in residential districts has been a source <strong>of</strong> much local controversy. Please see the<br />
Housing chapter for further discussion <strong>of</strong> granny flats.<br />
<strong>Report</strong> <strong>of</strong> the <strong>Bloomington</strong> <strong>Peak</strong> <strong>Oil</strong> <strong>Task</strong> <strong>Force</strong><br />
140
To that end, we recommend that:<br />
• The <strong>City</strong>, in cooperation with other local entities like Transition <strong>Bloomington</strong>, the<br />
<strong>City</strong> <strong>of</strong> <strong>Bloomington</strong> Commission on Sustainability, the Center for Sustainable Living,<br />
and others, encourage, promote, and support Transition training for all 55 Natural<br />
Neighborhoods (Map D, p. 101) within the next five years. As discussed in the<br />
Economic Context chapter <strong>of</strong> this <strong>Report</strong>, the Transition Movement, motivated by the<br />
twin challenges <strong>of</strong> climate change and peak oil, aims to organize citizens at<br />
neighborhood and community levels around sustainable living.<br />
• The <strong>City</strong> staff stay in contact with neighborhoods as they engage in Transition<br />
projects and assist them in formulating changes to land use regulations that help<br />
them achieve their Transition goals.<br />
• The <strong>City</strong> promptly implement changes as they are proposed by neighborhoods,<br />
amending existing codes where needed.<br />
• If neighborhoods differ greatly with respect to the changes they are willing to<br />
undertake, the <strong>City</strong> Council should consider neighborhood‐specific codes (or<br />
neighborhood‐specific waivers <strong>of</strong> current codes) so as to not impede progress in<br />
neighborhoods that are willing to be more bold than others. Those neighborhoods<br />
could become models for others, and pave the way for more widespread<br />
acceptance <strong>of</strong> changes in local codes. (See also the Land Use chapter’s<br />
recommendation for a pilot nodal overlay to the UDO).<br />
5. Work toward a Unified Comprehensive Land Use and Transportation Plan<br />
As we revise the use <strong>of</strong> the existing built environment, we must simultaneously plan for the<br />
shape <strong>of</strong> the future built environment. In a post‐peak era, we should be aiming for<br />
development patterns that lead to higher population density in areas designated as activity<br />
nodes, and that foster mixed use, walking, biking and transit use. (See Land Use chapter).<br />
Right now, transportation planning is largely separate from land use planning and IU,<br />
Monroe County and the <strong>City</strong> <strong>of</strong> <strong>Bloomington</strong> all draft and implement their plans<br />
independent <strong>of</strong> each other. Within the next five years, the <strong>City</strong>, County and IU should work<br />
with each other and with neighborhood‐based Transition groups to establish a coordinated<br />
planning process that will result in a county‐wide, unified and comprehensive Land Use and<br />
Transportation Plan.<br />
<strong>Report</strong> <strong>of</strong> the <strong>Bloomington</strong> <strong>Peak</strong> <strong>Oil</strong> <strong>Task</strong> <strong>Force</strong><br />
141
6. Update the LongRange Transportation Plan with an eye to peak oil.<br />
As the <strong>Bloomington</strong>/Monroe County Metropolitan Planning Organization prepares to<br />
update its LongRange Transportation Plan, it should do so informed by the phenomenon <strong>of</strong><br />
peak oil and the likelihood that reliance on the personal automobile will decrease while<br />
reliance <strong>of</strong> public transit, walking and biking will increase.<br />
7. Increase connectivity for bicyclists.<br />
Build out bicycle boulevards<br />
As discussed above, the <strong>City</strong> <strong>of</strong> <strong>Bloomington</strong> has<br />
made a consistent effort to foster a robust bicycle and<br />
pedestrian infrastructure. <strong>Bloomington</strong>’s 2008<br />
Bicycle and Pedestrian Transportation and Greenways<br />
System Plan makes this commitment even stronger.<br />
The Plan stresses the importance <strong>of</strong> connectivity – <strong>of</strong><br />
making it possible for bicyclists to reach destinations<br />
Bicycle Boulevard street markings in<br />
on a network <strong>of</strong> routes that provide safe and fast<br />
Berkeley, California<br />
travel. The Plan gives high priority to the concept <strong>of</strong> “bicycle boulevards.” Loosely<br />
modeled on Berkeley California’s bicycle boulevards, <strong>Bloomington</strong>’s bicycle boulevard<br />
program is intended to provide accommodations for bicyclists on existing roads, the<br />
purpose <strong>of</strong> which is a “high degree <strong>of</strong> free‐flow bicycle travel, access to major destinations,<br />
comfortable bicycling conditions, and minimal conflicts with motorists and pedestrians.”<br />
Bicycle boulevards should provide significant east‐west and/or north‐south connectivity<br />
along lengthy corridors and connect people to places <strong>of</strong> work, residence, shopping,<br />
studying and play. The 2008 Plan outlines the intent to build a number <strong>of</strong> bicycle<br />
boulevards within the city and assigns these a “high priority,” but does not attach a timeline<br />
to the construction <strong>of</strong> the boulevards. The <strong>City</strong> should aim for constructing all <strong>of</strong> the<br />
bicycle boulevards identified in the Plan within the next five years.<br />
<strong>Report</strong> <strong>of</strong> the <strong>Bloomington</strong> <strong>Peak</strong> <strong>Oil</strong> <strong>Task</strong> <strong>Force</strong><br />
142
Amend the Bicycle, Pedestrian and Greenways Plan to significantly increase the<br />
number <strong>of</strong> planned “lengthy corridors.”<br />
At present, the Plan only includes two substantial east‐west bicycle boulevards: the 6 th /7 th<br />
Street/Longview Avenue Bicycle Boulevard and the Allen Street/Covenanter Drive Bicycle<br />
Boulevard. While these boulevards are critical, alone they are insufficient to foster the<br />
kind <strong>of</strong> east‐west connectivity that is truly needed for bicycle riders in a post‐peak<br />
environment. The <strong>City</strong> should add more east‐west connective corridors by exploring<br />
options such as closing <strong>of</strong>f lanes or closing streets for automobile thru traffic and opening<br />
these streets up for bicycles, skateboards, pedestrians and other low‐speed traffic. Usually<br />
bicycle boulevards do not completely exclude cars, but limit them in some ways.<br />
Boulevards are most appropriate on roads which have slower speeds and less vehicular<br />
traffic. They are generally open to emergency vehicles.<br />
We encourage the <strong>City</strong> to pursue this option boldly. The post peak‐oil economy may strap<br />
<strong>City</strong> budgets <strong>of</strong> the means to pursue investments into more costly bicycle and pedestrian<br />
facilities, including multi‐use trails separate from roadways or separate side‐paths along<br />
arterials dedicated to bicycles. The <strong>City</strong> should therefore put the highest priority on<br />
conversion <strong>of</strong> existing streets (or lanes) to bicycle traffic, even along now busy arterials,<br />
keeping in mind that in a post‐peak future, automobile travel is likely to shrink, making this<br />
kind <strong>of</strong> conversion more feasible.<br />
In transitioning any road to accommodate bicycle traffic, the <strong>City</strong> should aim to narrow the<br />
lanes for car traffic as much as possible, ideally to nine feet in width. Such narrowing will<br />
help slow traffic speeds and make drivers more aware <strong>of</strong> bicyclists and pedestrians in<br />
addition to allowing a wider space for bicycle lanes. 173<br />
173 Dan Burden and Peter Lagerwey, Road Diets: Fixing the Big Roads, 1999, Walkable Communities,<br />
http://www.walkable.org/<br />
<strong>Report</strong> <strong>of</strong> the <strong>Bloomington</strong> <strong>Peak</strong> <strong>Oil</strong> <strong>Task</strong> <strong>Force</strong><br />
143
Make bike riding on major arterials safer<br />
While the <strong>City</strong> has made great efforts to improve bicycle transportation and bicycle safety,<br />
it should accelerate its effort to foster safe bicycle riding on major arterials and highways<br />
such as: Old <strong>State</strong> Road 37, North Dunn Street, West 2 nd and West 3 rd , as identified in the<br />
<strong>City</strong>’s Bicycle, Pedestrian and Greenways Plan and incorporated into the MPO’s 2030 Long<br />
Range Transportation Plan. It is imperative that local governments aggressively pursue<br />
funding to build these projects as soon as possible.<br />
8. Make bus transportation faster and more attractive<br />
Bus Lanes<br />
Likewise, dedicating a network <strong>of</strong> existing streets and lanes as bus lanes makes bus service<br />
faster and more reliable. The <strong>City</strong> and BT should start exploring the cost and feasibility <strong>of</strong><br />
several fast east‐west and north‐south routes in which buses have priority. In the long<br />
term, such bus lanes would ideally serve a considerable number <strong>of</strong> neighborhoods. In the<br />
short term, the <strong>City</strong> should work with BT to secure funding for at least one east‐west and<br />
one north‐south connection.<br />
More bus line intersection<br />
Another key improvement to transit is providing more opportunities for people to switch<br />
between bus lines. More convenient and faster connections will cut down on travel time<br />
and provide a better substitute for automobile travel. Planning for more sites <strong>of</strong><br />
intersection should commence now and be realized over the next 15 years. Possible ways<br />
<strong>of</strong> accomplishing this are one or more circular routes that intersect with the existing<br />
routes, or development <strong>of</strong> a system <strong>of</strong> routes that roughly follow a grid pattern.<br />
9. Seek cooperation for trip consolidation.<br />
The <strong>City</strong> <strong>of</strong> <strong>Bloomington</strong> should foster a spirit <strong>of</strong> cooperation between different private and<br />
public entities in seeking out and identifying opportunities for trip consolidations and for<br />
reductions in travel demands. For example: Meter reading for water, electricity, and gas<br />
could be coordinated, and all these readings done on one trip, instead <strong>of</strong> three separate<br />
ones.<br />
<strong>Report</strong> <strong>of</strong> the <strong>Bloomington</strong> <strong>Peak</strong> <strong>Oil</strong> <strong>Task</strong> <strong>Force</strong><br />
144
10. Seek cooperation for “bus sharing.”<br />
In effort to increase the efficiency <strong>of</strong> bus operations by increasing the number <strong>of</strong> riders per<br />
bus, BT should build on the IU‐BT cooperative precedent and explore cooperation with<br />
Monroe County School Corporation. School buses sit idle most <strong>of</strong> the day, at night, and<br />
several months during the year. Therefore, opportunities to reduce the school bus fleet and<br />
to increase the use <strong>of</strong> BT buses by having some children picked up and taken to school by<br />
BT should be explored. During school pick‐up and drop‐<strong>of</strong>f times, BT buses may be<br />
scheduled to make more frequent stops in certain neighborhoods to pick up children. Also,<br />
during <strong>of</strong>f‐peak times BT buses could be used for school trips. During summers, there may<br />
be opportunities to <strong>of</strong>fer unused capacity for long‐distance bus trips to the public. Using<br />
idle buses (during daily and seasonal <strong>of</strong>f‐peak times) for transportation <strong>of</strong> goods, rather<br />
than people, should be explored as well. The money saved from running and maintaining a<br />
smaller fleet <strong>of</strong> buses, and from running busses more efficiently, could then be used to<br />
further increase levels <strong>of</strong> service, or to be able to more quickly replace existing buses with<br />
alternative fuel buses that are less vulnerable to fuel price spikes.<br />
The <strong>Task</strong> <strong>Force</strong> recognizes that this proposal comes with constraints. First, the Federal<br />
Transit Administration (FTA) prohibits federally‐funded transit systems from providing<br />
exclusive school bus service and places constraints on competition with freight carriers.<br />
Secondly, some parents may have concerns about mixing students with the general<br />
population on public transit buses. However, the community can begin the process <strong>of</strong><br />
moving some public school students (middle and high school students) onto existing public<br />
transit routes where existing routes provide good connections to/from schools. If this<br />
incremental measure can be proven successful, it will help efforts to expand the use <strong>of</strong><br />
public transportation for school transportation.<br />
<strong>Report</strong> <strong>of</strong> the <strong>Bloomington</strong> <strong>Peak</strong> <strong>Oil</strong> <strong>Task</strong> <strong>Force</strong><br />
145
11. Seek greater public investment in the transit system.<br />
Only a public transit network that is easily accessible and <strong>of</strong>fers high levels <strong>of</strong> service with<br />
regard to speed, frequency, and quality <strong>of</strong> service can truly be considered a viable option<br />
for people who can no longer afford automobile travel as fuel prices increase. A robust<br />
transit system includes service at night and during weekends, dedicated bus lanes, bus<br />
shelters, and good pedestrian access to bus stops. If the transit system requires a lot <strong>of</strong> time<br />
to negotiate and is not available when people need it, its usefulness as a transportation<br />
alternative will be very limited. The lack <strong>of</strong> robust, viable transportation alternatives will<br />
result in more severe local economic disruptions.<br />
Gas tax<br />
About 20 percent <strong>of</strong> BT’s annual operating budget is comprised <strong>of</strong> federal dollars – largely<br />
funds from the gas tax. Since 1993, approximately 18.4 cents <strong>of</strong> every gallon <strong>of</strong> gasoline is<br />
levied by the federal government to pay for roads, bridges and transit. The link between<br />
transit and the gas tax is problematic in at least two ways. First, the gas tax heavily favors<br />
the construction <strong>of</strong> roads and bridges over transit as fully 80 percent <strong>of</strong> the tax is devoted<br />
to roads and only 20 percent is dedicated to public transit. Therefore, the current system<br />
favors road building over transit and actually encourages suburbanization and a low<br />
population density that makes it difficult for BT to serve these areas. In a post‐peak future,<br />
we know this is a problematic approach. Secondly, the tax itself is unstable. Decreased<br />
demand for gasoline, as we experienced in the summer <strong>of</strong> 2008, causes gasoline revenue to<br />
drop appreciably and transit suffers.<br />
Funding<br />
As INDOT recommended in its recent analysis <strong>of</strong> transit in <strong>Indiana</strong>, to reach levels <strong>of</strong><br />
service necessary to realize even modest increases in ridership, an increase in funding<br />
must come from the local or regional level. 174 Local funding is critical considering that a<br />
post‐peak environment will occasion both 1) increased demand for transit and 2)<br />
decreased state and federal funding.<br />
174 <strong>Indiana</strong> Department <strong>of</strong> Transportation, Executive Summary, <strong>Indiana</strong> Mass Transit Studies PL 203‐2007<br />
(December 2008).<br />
<strong>Report</strong> <strong>of</strong> the <strong>Bloomington</strong> <strong>Peak</strong> <strong>Oil</strong> <strong>Task</strong> <strong>Force</strong><br />
146
For years, transit has been woefully underfunded at all levels <strong>of</strong> government. The<br />
community, state and nation need to invest much more heavily in our public transportation<br />
systems. This might mean new taxes or shifting existing tax funds from other programs to<br />
our public transportation system. The <strong>City</strong> should be visionary here and work with BT to<br />
advocate for a greater public investment to improve and expand transit services and to<br />
transition buses to non‐petroleum sources <strong>of</strong> fuel.<br />
12. Explore the option <strong>of</strong> a “no fare” <strong>Bloomington</strong> Transit system<br />
The IU Campus Bus system currently operates as a “no fee” system. Other communities in<br />
<strong>Indiana</strong>, such as Marion, are operating public transit free <strong>of</strong> charge. BT should explore the<br />
possibility <strong>of</strong> implementing a “no fare” system. On special days when BT does not charge a<br />
fare to ride the bus, it experiences a 15 percent increase in ridership. <strong>Bloomington</strong>’s<br />
Growth Policies Plan prioritizes increasing transit ridership and calls for the <strong>City</strong> to<br />
“[c]oordinate with <strong>Bloomington</strong> Transit to study the feasibility <strong>of</strong> allowing universal transit<br />
access for all citizens <strong>of</strong> <strong>Bloomington</strong>.” 175<br />
However, fares currently bring in around $400,000‐$500,000 per year and cover 20‐25<br />
percent <strong>of</strong> BT’s transit costs. As the loss <strong>of</strong> fare revenue would be significant, it might very<br />
well mean that some transit service would be cut. The <strong>City</strong> and Monroe County should<br />
work with BT to closely examine such feasibility and should help identify sources <strong>of</strong><br />
revenue needed to invest in the BT infrastructure to help meet increased demand<br />
occasioned by a free fare system.<br />
175 GPP, Implementation Measure, MT‐5, 15.<br />
<strong>Report</strong> <strong>of</strong> the <strong>Bloomington</strong> <strong>Peak</strong> <strong>Oil</strong> <strong>Task</strong> <strong>Force</strong><br />
147
13. Fully unify the BT and campus bus systems.<br />
A unified transit system wherein IU and BT are joined <strong>of</strong>fers the potential to increase<br />
funding from the <strong>State</strong> <strong>of</strong> <strong>Indiana</strong> significantly. Indeed, as much as $2 million could be<br />
acquired if the <strong>Indiana</strong> Department <strong>of</strong> Transportation approved such unification. $2<br />
million would help provide a higher level <strong>of</strong> service to the community. The <strong>City</strong> should<br />
work with BT and IU to fully support such a merger.<br />
14. Explore methane digesters to produce biogas for transportation<br />
Organic, locally‐generated waste, such as food waste, is a<br />
potential rich store <strong>of</strong> energy that could be used to fuel<br />
transit buses. This waste is a source <strong>of</strong> methane – a<br />
primary component <strong>of</strong> natural gas. BT stores a<br />
maximum four‐day supply <strong>of</strong> fuel, and MCCSC stores a<br />
maximum <strong>of</strong> somewhere between 6.5 and 11 days <strong>of</strong><br />
fuel under the best <strong>of</strong> circumstances, which assumes that the storage tanks are full when<br />
the crisis hits. Locally‐produced gas that fuels transit buses and school buses would greatly<br />
reduce the risks to this community from interruptions in supply <strong>of</strong> transportation fuels.<br />
A United Nations publication states, “[a]t present biogas is the most immediately practicable<br />
means for powering a conventional internal combustion engine from biomass.” 176<br />
According to a publication by the <strong>Oil</strong> Depletion Analysis Centre and the Post Carbon<br />
Institute, the great potential <strong>of</strong> biogas as a transportation fuel has already been<br />
demonstrated and acknowledged in many different countries:<br />
<strong>Report</strong> <strong>of</strong> the <strong>Bloomington</strong> <strong>Peak</strong> <strong>Oil</strong> <strong>Task</strong> <strong>Force</strong><br />
A large biogas digester in Japan. Source: Sustainable<br />
Cities Blog, http://blog.cunysustainablecities.org<br />
In the city <strong>of</strong> Lille in northern France, 120 <strong>of</strong> the city’s 400 buses run on biogas<br />
made from locally sourced food waste, with one new gas‐power bus<br />
commissioned every week. By 2012 all buses will run on a mix <strong>of</strong> one‐third<br />
natural gas, two‐thirds biogas. The biogas is produced by an anaerobic digester at<br />
the bus terminus, which fuels not only the buses but also the lorries that collect<br />
the waste. This means there is a high degree <strong>of</strong> insulation to short term<br />
interruptions in the oil supply. 177<br />
176 Food and Agricultural Organization <strong>of</strong> the United Nations, http://www.fao.org/docrep/010/ah810e/AH810E13.htm<br />
177 <strong>Oil</strong> Depletion Analysis Centre and the Post Carbon Institute, Preparing for <strong>Peak</strong> <strong>Oil</strong>: Local Authorities and the Energy<br />
Crisis, http://www.odac‐info.org/sites/odac.postcarbon.org/files/Preparing_for_<strong>Peak</strong>_<strong>Oil</strong>.pdf<br />
148
According to this report, a study into the potential <strong>of</strong> biogas for Britain found that “Britain<br />
produces some 30 million dry tonnes <strong>of</strong> food waste and agricultural manure per year, and<br />
this could produce over six million tonnes <strong>of</strong> oil equivalent in biomethane. That equates to<br />
about 16 percent <strong>of</strong> total transport fuel demand, while public transport consumes less than<br />
five percent. In other words, Britain could fuel a public transport network three times<br />
bigger than today’s on food and agricultural waste alone.” 178<br />
However, the <strong>Task</strong> <strong>Force</strong> recognizes that any new technology exacts a cost. Any new fuel<br />
brings with it the requirement for substantial investment in infrastructure, the possible<br />
necessity to relocate maintenance/fueling facilities, costs to equip new buses with engines<br />
appropriate to the fuel, and cost to train personnel on maintaining alternative fuel<br />
propulsion systems. Furthermore, sometimes alternative fuels are not as reliable and<br />
technologies to use alternative fuels are <strong>of</strong>ten much less mature. As a result, buses relying<br />
on alternative fuels may break down more frequently, and service may, at times, be<br />
unreliable.<br />
The <strong>City</strong> should work with BT to fully research the costs and benefits <strong>of</strong> bio‐digesters. If<br />
research reveals that bio‐digesters would work in our community, fuels generated should<br />
be used for BT, the <strong>City</strong> and MCCSC vehicles and placed in locations appropriate for fueling<br />
the respective fleets, as well as for fueling the vehicles that collect organic materials.<br />
Remaining supplies should be <strong>of</strong>fered to Monroe County or other users. The fertilizer that<br />
is generated as a by‐product <strong>of</strong> such digesters would be useful for local gardeners and<br />
farmers.<br />
178 Ibid.<br />
<strong>Report</strong> <strong>of</strong> the <strong>Bloomington</strong> <strong>Peak</strong> <strong>Oil</strong> <strong>Task</strong> <strong>Force</strong><br />
149
15. Establish public or private longdistance bus service between <strong>Bloomington</strong><br />
and <strong>Indiana</strong>polis; encourage the establishment <strong>of</strong> commuter rail.<br />
At present, no public transit connections exist between <strong>Bloomington</strong> and train and bus<br />
stations located in downtown <strong>Indiana</strong>polis. The only way to get downtown <strong>Indiana</strong>polis<br />
from <strong>Bloomington</strong> without a car is to take one <strong>of</strong> the two shuttle services from<br />
<strong>Bloomington</strong> to the <strong>Indiana</strong>polis airport and then to take public transit from the airport to<br />
one <strong>of</strong> the downtown sites. The lack <strong>of</strong> a <strong>Bloomington</strong>‐<strong>Indiana</strong>polis transit connection<br />
makes it difficult to connect up with trains and buses leaving from <strong>Indiana</strong>polis to Chicago,<br />
Cincinnati, Louisville, and other popular regional destinations. It also makes it very difficult<br />
for <strong>Bloomington</strong> residents commuting to downtown <strong>Indiana</strong>polis to transition to the<br />
<strong>Indiana</strong>polis transit system. We strongly encourage the current shuttle services and other<br />
companies to explore the possibility <strong>of</strong> <strong>of</strong>fering similar services to several spots in the<br />
downtown <strong>Indiana</strong>polis area within the next five years that would meet the needs <strong>of</strong> both<br />
commuters and occasional travelers.<br />
We further encourage the <strong>City</strong> and the County to stay in active dialog with the state to<br />
ensure that Monroe County is part <strong>of</strong> any commuter rail system planned by the state.<br />
Currently, the <strong>Indiana</strong> Department <strong>of</strong> Transportation is considering a rail or bus route<br />
between <strong>Indiana</strong>polis and <strong>Bloomington</strong>. 179<br />
179 INDOT, Final <strong>Report</strong> Central <strong>Indiana</strong> Commuter Rail Feasibility Study, August 2008.<br />
<strong>Report</strong> <strong>of</strong> the <strong>Bloomington</strong> <strong>Peak</strong> <strong>Oil</strong> <strong>Task</strong> <strong>Force</strong><br />
150
MEDIUMTERM (5 15 Years)<br />
1. Increase connectivity and safety for bicyclists<br />
Within the next five to 15 years, there should be at least four east‐west and four north‐<br />
south bike boulevards fully operable and fully extending to the boundaries <strong>of</strong> the city. All<br />
major arterials should be outfitted with sidepaths or bike boulevards.<br />
2. Improve levels <strong>of</strong> service for BT<br />
Within the next five to 15 years, plans developed in the first five years should start to be<br />
implemented with regard to larger number <strong>of</strong> dedicated bus lanes, and creation <strong>of</strong> multiple<br />
points where riders can switch bus lines. If the efforts <strong>of</strong> the first five years to develop<br />
additional funding sources and cooperate with MCCSC are successful, levels <strong>of</strong> service<br />
should be steadily increased during the following years by increasing frequency <strong>of</strong> service,<br />
adding new lines, expanding service on Saturdays and Sundays and later into the night,<br />
providing bus shelters and easy access to bus stops.<br />
3. Expand the use <strong>of</strong> methane digesters to produce biogas for transportation.<br />
The <strong>City</strong> should continue to expand its collection <strong>of</strong> organic wastes for biogas production,<br />
and expand the production <strong>of</strong> biogas accordingly.<br />
<strong>Report</strong> <strong>of</strong> the <strong>Bloomington</strong> <strong>Peak</strong> <strong>Oil</strong> <strong>Task</strong> <strong>Force</strong><br />
151
LONGTERM (1530 years)<br />
1. Shrink road width and automobile road infrastructure.<br />
As fuel supplies dwindle and vehicle miles travelled contract, and as carpooling, transit use,<br />
car sharing, walking and biking expand, there should then be considerably fewer numbers<br />
<strong>of</strong> vehicles on the road. After 15 years, the <strong>City</strong> may consider shrinking its road<br />
infrastructure dedicated to automobiles by reducing road widths and making multi‐lane<br />
roads into two‐lane roads. This would help the <strong>City</strong> reduce road maintenance operations,<br />
and would free up funds that probably will be sorely needed for other purposes.<br />
2. Continue the expansion <strong>of</strong> public transit through compact urban form and<br />
intracity connections.<br />
Fifteen years down the road, population density should have increased in areas where<br />
essential services like grocery stores, schools, pharmacies, post <strong>of</strong>fices, public libraries,<br />
restaurants, hardware stores, department stores and farmers’ markets are located. This<br />
will allow BT to run bus lines more efficiently, since more people are likely to board at each<br />
stop, and buses will be fuller. This will put BT into a positive feedback loop, where<br />
increased ridership encourages increased levels <strong>of</strong> service, and vice versa. We recommend<br />
that BT continue its path <strong>of</strong> carefully‐planned improvements in the levels <strong>of</strong> service,<br />
attracting more and more riders. Once the local transit system is well developed, the<br />
feedback loop will be further enhanced by having transit connections with other cities<br />
besides <strong>Indiana</strong>polis. We recommend the <strong>City</strong> work toward establishing those connections.<br />
<strong>Report</strong> <strong>of</strong> the <strong>Bloomington</strong> <strong>Peak</strong> <strong>Oil</strong> <strong>Task</strong> <strong>Force</strong><br />
152
<strong>Report</strong> <strong>of</strong> the <strong>Bloomington</strong> <strong>Peak</strong> <strong>Oil</strong> <strong>Task</strong> <strong>Force</strong><br />
HOUSING<br />
“<strong>Peak</strong> oil and climate change require a revolutionary change to all aspects <strong>of</strong><br />
our lives. The energy used and CO2 generated by the automobile or from food<br />
production is much less than the energy consumed by US buildings.<br />
Furthermore, building energy consumption has been continually increasing in<br />
spite <strong>of</strong> improvements in building efficiency.”<br />
– Pat Murphy 180<br />
<strong>Oil</strong> and housing are closely linked. Although oil is not directly used by most homes in the<br />
U.S., the energy required to heat and cool our homes derives from energy sources reliant on<br />
oil for their production and delivery. In <strong>Indiana</strong>, fully 95% <strong>of</strong> our electricity is powered by<br />
coal. Coal requires oil for mining and transport. Therefore, as the price <strong>of</strong> oil rises, so too<br />
will the price <strong>of</strong> electricity.<br />
Add to this picture the likelihood that, as the price <strong>of</strong> electricity increases, more people will<br />
look to other sources <strong>of</strong> energy such as natural gas to heat and cool their homes. As more<br />
people rely on natural gas, the price <strong>of</strong> natural gas will increase. As detailed in Appendices<br />
II and III, both coal and natural gas production are projected to peak around 2030. All <strong>of</strong><br />
these effects gear up into what is referred to as “peak energy.” In light <strong>of</strong> peak energy, we<br />
must start to imagine alternative ways to heat and cool our homes in ways that conserve<br />
energy and save money.<br />
180<br />
Pat Murphy, Plan C: Community Survival Strategies for <strong>Peak</strong> <strong>Oil</strong> and Climate Change (New Society Publishers:<br />
Garbriola, Island, BC, 2008), 143<br />
153
REVIEW OF THE CURRENT SITUATION<br />
Housing Units<br />
As <strong>of</strong> the last U.S. Census, <strong>Bloomington</strong> had 26,468 housing units. 17,127 (65%) <strong>of</strong> these<br />
units were renter‐occupied and 9,341 (35%) were owner‐occupied. 181 As defined by the<br />
Census, a housing unit is “a house, an apartment, a mobile home, a group <strong>of</strong> rooms, or a<br />
single room that is occupied (or if vacant, is intended for occupancy) as separate living<br />
quarters.” 182 “Housing unit” does not necessarily mean a “house.” There are 7,952 single‐<br />
family owner‐occupied homes. The average household size in <strong>Bloomington</strong> is 2.09 people.<br />
Efficiency<br />
Most <strong>of</strong> the housing in <strong>Bloomington</strong> was built in an era <strong>of</strong> cheap energy. As a result, much <strong>of</strong><br />
our housing stock tends to be inefficient. 183 The Energy Information Association reports<br />
that the least energy‐efficient homes are those constructed between 1959‐1989. The<br />
lowest energy users were generally constructed before 1959, with post‐1989 construction<br />
coming in a close second. 184 Approximately 46% <strong>of</strong> the city’s total housing units were built<br />
between 1960 and 1990. See table and Map G below.<br />
181 2000 U.S. Census<br />
Age <strong>of</strong> <strong>Bloomington</strong> Housing Units 185<br />
Year Structure Built Number Percent<br />
March 2000 to present 186 4,256 13<br />
1995 to March 2000 3,621 11.1<br />
1990 to 1994 2,661 8.2<br />
1980 to 1989 4,501 13.8<br />
1970 to 1979 5,833 17.8<br />
1960 to 1969 4,799 14.7<br />
1940 to 1959 4,152 12.7<br />
1939 or earlier 2,792 8.6<br />
Total 32,615<br />
182 U.S. Census Bureau, Housing Units, http://quickfacts.census.gov/qfd/meta/long_HSG010207.htm<br />
183 Murphy, 145.<br />
184 U.S. Energy Information Administration, The 2005 Residential Energy Consumption Survey,<br />
http://www.eia.doe.gov/emeu/recs/contents.html<br />
185 U.S. Census Bureau, figures <strong>of</strong> May 2008<br />
186 Estimated; note that projections after 2000 are unreliable. The 2000‐present figure is predicated on the 1990‐2000<br />
annual rate <strong>of</strong> increase <strong>of</strong> 2.61%.<br />
<strong>Report</strong> <strong>of</strong> the <strong>Bloomington</strong> <strong>Peak</strong> <strong>Oil</strong> <strong>Task</strong> <strong>Force</strong><br />
154
MAP G: <strong>Bloomington</strong> Housing Units -- Median Year Built<br />
<strong>Report</strong> <strong>of</strong> the <strong>Bloomington</strong> <strong>Peak</strong> <strong>Oil</strong> <strong>Task</strong> <strong>Force</strong> 155
Number <strong>of</strong> People per Square Foot<br />
While homes have become more energy efficient per square foot the effect <strong>of</strong> these<br />
efficiencies has been counteracted by the size <strong>of</strong> our homes. Over time, the size <strong>of</strong> our<br />
homes has increased, while the number <strong>of</strong> people living in those homes has decreased. In<br />
2000 the national average household size was 2.59 people. As shown below, this is<br />
significantly less than the average <strong>of</strong> 3.67 in 1940, while over that same time period the<br />
number <strong>of</strong> average square feet per house, and per person, has increased:<br />
Number <strong>of</strong> Persons<br />
4<br />
3<br />
2<br />
1<br />
0<br />
0<br />
1940 1950 1960 1970 1980 1990 2000<br />
Change in Household Size, House Size and Square Feet Per Person 1940 to 2000<br />
Persons per household Square feet per person Square feet per house<br />
Adapted from Plan C: Community Survival Strategies for <strong>Peak</strong> <strong>Oil</strong> and Climate Change 187<br />
<strong>Bloomington</strong> tracks – indeed exceeds – national trends. In 2000, the average <strong>Bloomington</strong><br />
household has shrunk while the average size <strong>of</strong> a single‐family residence has increased. In<br />
2000, the average household size in <strong>Bloomington</strong> was 2.09 people – 0.50 fewer people than<br />
the national average. 188 From 2000 to 2009, homes built in Monroe County averaged 2,547<br />
square feet, 189 almost 400 square feet larger than the U.S. average.<br />
187 Murphy, 146.<br />
188 U.S. Census 2000. <strong>Bloomington</strong>’s small household size is very likely due to its large student population.<br />
189 Personal communication, Monroe County Building Department.<br />
<strong>Report</strong> <strong>of</strong> the <strong>Bloomington</strong> <strong>Peak</strong> <strong>Oil</strong> <strong>Task</strong> <strong>Force</strong><br />
2500<br />
2000<br />
1500<br />
1000<br />
500<br />
Square feet<br />
156
Home Heating Fuel<br />
In both <strong>Bloomington</strong> and Monroe County, most heating fuel is either utility, bottled, tank, or<br />
liquefied petroleum gas or electricity. In 2006, natural gas accounted for 59.71% <strong>of</strong> total<br />
energy consumed in the <strong>Bloomington</strong> residential sector, while coal accounted for the<br />
remaining 40.29%. The total amount <strong>of</strong> coal consumed (95% <strong>of</strong> electricity production) was<br />
equivalent to 292,424,591 kWh. Also that year, the equivalent <strong>of</strong> 433,462,717 kWh <strong>of</strong><br />
natural gas was consumed (heating plus 5% <strong>of</strong> electricity generation). 190 As mentioned<br />
previously, both the price <strong>of</strong> electricity and natural gas are expected to increase as the price<br />
<strong>of</strong> oil becomes more volatile and more expensive.<br />
Energy Consumption Distribution<br />
In addition to looking at sources <strong>of</strong> our residential energy use, it is important to look at how<br />
we use that energy. According to the U.S. Department <strong>of</strong> Energy, in residential buildings,<br />
space heating and cooling, lighting, and water heating account for 66% <strong>of</strong> the total energy<br />
consumption.<br />
ENERGY CONSUMPTION<br />
IN RESIDENTIAL BUILDINGS<br />
End Use Residential<br />
Buildings<br />
Space Heating 31%<br />
Lighting 11%<br />
Space Cooling 12%<br />
Water Heating 12%<br />
Refrigeration 8%<br />
Electronics 7%<br />
Cooking 5%<br />
Wet Clean 5%<br />
Computers 1%<br />
Other 9%<br />
Adapted from U.S. Department <strong>of</strong> Energy, 2007 Energy Data Book.<br />
Any efforts to reduce energy consumption must start with a close examination <strong>of</strong> space and<br />
water heating, cooling and lighting.<br />
190 <strong>City</strong> <strong>of</strong> <strong>Bloomington</strong> Environmental Commission & <strong>City</strong> <strong>of</strong> <strong>Bloomington</strong> Commission on Sustainability,<br />
Greenhouse Gas Inventory for the <strong>City</strong> <strong>of</strong> <strong>Bloomington</strong>, <strong>Indiana</strong>: Footprint, Projections, and Recommendations<br />
(May 2009) https://bloomington.in.gov/media/media/application/pdf/5047.pdf<br />
<strong>Report</strong> <strong>of</strong> the <strong>Bloomington</strong> <strong>Peak</strong> <strong>Oil</strong> <strong>Task</strong> <strong>Force</strong> 157
Local Incentives<br />
The community has taken progressive measures toward fostering energy‐efficient housing.<br />
• Owneroccupied rehabilitation program. This home rehabilitation loan is funded<br />
by federal tax dollars and administered by the <strong>City</strong> <strong>of</strong> <strong>Bloomington</strong>’s Housing and<br />
Neighborhood Development Department (HAND). An amount <strong>of</strong> up to $38,500 is<br />
available to eligible homeowners for the rehabilitation <strong>of</strong> their homes. This money<br />
can be used to address energy efficiencies.<br />
• Purchaserehabilitation program. This HAND program provides funds for energy<br />
efficiency improvements to income‐eligible families purchasing a home.<br />
• EverGreen Village. This 12‐unit subdivision was developed by HAND and<br />
incorporates many energy‐efficient plans. These plans include a storm water design<br />
system that incorporates a restored creek and naturalized rain gardens and homes<br />
built using LEED standards. These energy efficient designs coupled with solar<br />
energy production make these<br />
green homes very efficient and<br />
cost‐effective. 191<br />
• Furnace insulation program.<br />
HAND has plans for furnace<br />
insulation and draft assessment<br />
programs for both owner‐occupied<br />
and rental housing units.<br />
• Conditional loans to developers.<br />
Through HAND, loans are provided<br />
to developers for construction or<br />
rehabilitation <strong>of</strong> affordable<br />
owner‐occupied homes.<br />
• Direct assistance to homebuyers. HAND also provides direct assistance to<br />
homeowners to purchase or rehabilitate homes.<br />
• South Central Community Action Program (CAP) Weatherization Program.<br />
CAP’s Weatherization Program assists low‐income households in reducing their<br />
energy consumption. Certified technicians use energy audits and diagnostic<br />
equipment to enable households to stay comfortable year round and save money. 192<br />
191 See http://bloomington.in.gov/evergreen for more information.<br />
192 See http://www.sccap.monroe.in.us/ for more information.<br />
One <strong>of</strong> the 12 units in the <strong>City</strong>’s EverGreen development.<br />
<strong>Report</strong> <strong>of</strong> the <strong>Bloomington</strong> <strong>Peak</strong> <strong>Oil</strong> <strong>Task</strong> <strong>Force</strong> 158
• Change a Light, Change the World. In 2007, the <strong>City</strong> partnered with local grocery<br />
cooperative Bloomingfoods for the Change a Light, Change the World Campaign and<br />
has distributed over 40,000 compact fluorescent light bulbs with an estimated<br />
savings <strong>of</strong> $2.0 million over the life <strong>of</strong> these bulbs.<br />
• Energy efficiency seminars. The <strong>City</strong> <strong>of</strong> <strong>Bloomington</strong> Commission on<br />
Sustainability, along with EnergyPros and Earth Care, host regular seminars<br />
focusing on home construction and remodeling for energy conservation.<br />
• Development “green” incentives. The <strong>City</strong>’s Unified Development Ordinance<br />
<strong>of</strong>fers a number <strong>of</strong> “green” incentives to residential and other developers to<br />
encourage conservation and greater efficiency. To date, few developers have utilized<br />
such incentives. The incentives include:<br />
Energy and resource efficiency. Features that meet the energy and<br />
resource efficiency goal include green ro<strong>of</strong>s, improved building performance<br />
rating, the use <strong>of</strong> non‐polluting and/or renewable on‐site energy sources, recycling<br />
and/or salvaging at least 50 percent <strong>of</strong> non‐hazardous construction and<br />
demolition debris, or utilizing building materials and products sourced within a<br />
500‐mile radius.<br />
Landscape and site design. Qualifying designs include the use <strong>of</strong> at least 25<br />
percent permeable pavement, utilization <strong>of</strong> natural vegetation and other<br />
techniques to convey and filter storm water, employment <strong>of</strong> systems to recycle at<br />
least 50 percent <strong>of</strong> greywater and storm water, retention <strong>of</strong> 90 percent <strong>of</strong> area tree<br />
canopy, and/or conservation <strong>of</strong> land with a slope <strong>of</strong> 12 percent or greater.<br />
Public policy. Public policy commitments include incorporating mixed use<br />
development, providing 100 percent <strong>of</strong> the required long term bicycle parking<br />
spaces, decreasing automobile parking while increasing bicycle parking, and<br />
providing subsidized <strong>Bloomington</strong> Transit passes or a private van or shuttle.<br />
Public transportation. Qualifying projects are located near a transit stop,<br />
activity center, downtown, public school or park, or multiuse trail. 193<br />
• <strong>State</strong> incentives. The <strong>State</strong> <strong>of</strong> <strong>Indiana</strong> <strong>of</strong>fers a number <strong>of</strong> incentives to homeowners<br />
for efficiency improvements. These incentives are detailed in the Opportunities for<br />
Citizen Action chapter <strong>of</strong> this <strong>Report</strong>.<br />
While the above‐listed incentives are a good start, peak energy will require us to do much<br />
more to prepare for ever‐increasing costs <strong>of</strong> electricity and natural gas.<br />
193 Unified Development Ordinance, §20.05.049.<br />
http://bloomington.in.gov/documents/viewDocument.php?document_id=267<br />
<strong>Report</strong> <strong>of</strong> the <strong>Bloomington</strong> <strong>Peak</strong> <strong>Oil</strong> <strong>Task</strong> <strong>Force</strong> 159
VULNERABILITIES<br />
1. Potential for power grid failure in peak oil scenarios.<br />
“<strong>Peak</strong> energy” – oil, coal and gas shortages – will translate into the potential for grid failure.<br />
As Clifford Wirth points out in <strong>Peak</strong> <strong>Oil</strong>: Alternatives, Renewables, and Impacts, “The power<br />
grid for most <strong>of</strong> North America will fail due to a lack <strong>of</strong> spare parts and maintenance for the<br />
257,000 kilometers <strong>of</strong> electric power transmission lines, hundreds <strong>of</strong> thousands <strong>of</strong> pylons<br />
(which are transported on the highways), and hundreds <strong>of</strong> power generating plants and<br />
substations, as well as from shortages in the supply <strong>of</strong> coal, natural gas, or oil used in<br />
generating electric power. Power failures could also result from the residential use <strong>of</strong><br />
electric stoves and space heaters when there are shortages <strong>of</strong> oil and natural gas for home<br />
heating. This would overload the power grid, causing its failure.” 194 In the event <strong>of</strong> long‐<br />
term grid failure, “homes across the U.S. will lack heating and air conditioning. Even if<br />
homes are retr<strong>of</strong>itted with wood stoves, local biomass is insufficient to provide for home<br />
heating, and it will not be possible to cut, split, and move wood in sufficient quantities.” 195<br />
Given the coal‐sourced nature <strong>of</strong> electricity in <strong>Indiana</strong> and the expected increased pressure<br />
on the grid, we must anticipate that the electric power grid will become greatly<br />
compromised and could experience a number <strong>of</strong> failures. 196<br />
194 Clifford Wirth, <strong>Peak</strong> <strong>Oil</strong>: Alternatives, Renewables, and Impacts, July 2008, 46‐47<br />
195 Wirth, 48<br />
196 From report from the UK Industry <strong>Task</strong> <strong>Force</strong> on <strong>Peak</strong> <strong>Oil</strong> & Energy Security, The <strong>Oil</strong> Crunch: Securing the<br />
UK's Energy Future (October 2008). http://peakoil.solarcentury.com/wp‐content/uploads/2008/10/oil‐report‐<br />
final.pdf<br />
<strong>Report</strong> <strong>of</strong> the <strong>Bloomington</strong> <strong>Peak</strong> <strong>Oil</strong> <strong>Task</strong> <strong>Force</strong> 160
2. Housing will occupy an everincreasing proportion <strong>of</strong> personal income.<br />
The Transportation chapter illustrated the way in which increasing oil prices will consume<br />
more and more <strong>of</strong> personal income. The story is the same with housing. Absent efficiency<br />
improvements, heating, maintenance, and monthly housing<br />
costs will consume a larger share <strong>of</strong> household budgets and<br />
may push people toward lower‐quality housing choices at<br />
the same time that auto transportation costs increase<br />
dramatically.<br />
3. Big houses and low occupancy translates into<br />
great inefficiency.<br />
As described above, <strong>Bloomington</strong> residents, like most<br />
Americans, tend to live in large spaces with few occupants.<br />
As fuel becomes scarcer and electricity prices rise, it will<br />
become increasingly difficult to heat and cool these large spaces. Many families will likely<br />
face tough choices such as downsizing to a more moderately‐sized space, doubling up<br />
households, closing <strong>of</strong>f unused rooms and/or remodeling underutilized areas to create<br />
living space for additional household members who can contribute to the cost <strong>of</strong> utilities<br />
and maintenance. It is likely that large and inefficient homes will not hold their worth and<br />
those who have their net worth tied up in such houses may be disproportionately affected.<br />
4. No incentives for landlords to make rental units energy efficient.<br />
For the most part, when renters assume the cost <strong>of</strong> their utility bills, landlords don’t have<br />
much financial incentive to make their rentals more energy efficient. This is known as a<br />
“split incentive.” Owners don’t make efficiency investments because it’s the renters who<br />
pay the energy bills. And renters don’t make investments in property they don’t own. The<br />
result is housing that wastes energy and costs more than it should. Since fully 65% <strong>of</strong> all<br />
housing units in <strong>Bloomington</strong> are renter‐occupied, renters living in inefficient units will<br />
face considerable hardship due to peak oil.<br />
Source: Natural Resources Defense Council<br />
<strong>Report</strong> <strong>of</strong> the <strong>Bloomington</strong> <strong>Peak</strong> <strong>Oil</strong> <strong>Task</strong> <strong>Force</strong> 161
5. Restrictive covenants on use <strong>of</strong> clotheslines.<br />
According to the U.S. Department <strong>of</strong> Energy, 5.8 percent <strong>of</strong> residential electricity use goes<br />
towards the use <strong>of</strong> clothes dryers. 197 Many residents<br />
are subject not only to state and local laws regarding<br />
their property, but also to the rules attached to their<br />
property by way <strong>of</strong> covenants and rules <strong>of</strong><br />
homeowners’ associations. Several <strong>Bloomington</strong><br />
neighborhoods have such covenants against the<br />
placement or use <strong>of</strong> clotheslines. Whether or not such<br />
rules are enforced by the neighborhood, now is the<br />
time to change the stigma against clotheslines.<br />
6. Lack <strong>of</strong> retr<strong>of</strong>itting expertise in community.<br />
If the residents <strong>of</strong> <strong>Bloomington</strong> and Monroe County<br />
were persuaded to make the sorts <strong>of</strong> deep changes in<br />
their homes and habits that seem to be necessary for survival in a post‐petroleum world, it<br />
is questionable whether there are enough people in the community with the knowledge<br />
and skills to help us figure out what to do. Many services are currently <strong>of</strong>fered in this area,<br />
such as home energy audits, site assessments for renewable energy, landscaping design,<br />
and basic home improvements. 198 However, once a homeowner has completed the basics <strong>of</strong><br />
sealing air leaks, insulating, and replacing windows, there are few who know how to assess<br />
a particular site and advise how to take it to the next level to address questions such as:<br />
Should I install a southfacing window? Build a water storage tank? Add thickness to the<br />
walls? Plant a shade tree?<br />
197 U.S. DOE, Energy Information Administration, U.S. Household Electricity <strong>Report</strong>,<br />
http://www.eia.doe.gov/emeu/reps/enduse/er01_us.html.<br />
While clotheslines save energy and money, some<br />
local neighborhoods ban the use <strong>of</strong> a clothesline.<br />
Source: Michael Jastremski, Wikimedia Commons<br />
198 A list <strong>of</strong> local green building experts is provided by the <strong>City</strong>’s Environmental Commission at:<br />
http://bloomington.in.gov/green‐building‐local‐resources<br />
<strong>Report</strong> <strong>of</strong> the <strong>Bloomington</strong> <strong>Peak</strong> <strong>Oil</strong> <strong>Task</strong> <strong>Force</strong> 162
MITIGATION GOALS & STRATEGIES<br />
SHORTTERM (15 Years)<br />
1. Conserve energy.<br />
The first step in reducing vulnerability to power grid<br />
failure is to conserve. It’s estimated that 50% <strong>of</strong><br />
household electricity use in the U.S. is simply wasted;<br />
we can make huge improvements merely by identifying the points <strong>of</strong> waste and eliminating<br />
them. 199 As Greg Pahl observes:<br />
conservation is the least expensive strategy we have available and the least<br />
harmful to the environment. . . .[R]eductions can be achieved through a<br />
combination <strong>of</strong> initiatives, including the use <strong>of</strong> energy‐efficient building<br />
materials, appliances, and other technologies, coupled with imaginative<br />
thinking about living better with less. 200<br />
Tips for energy conservation are widely‐available and include those <strong>of</strong>fered by the <strong>City</strong>’s<br />
Environmental Commission on its <strong>Bloomington</strong> Environmental Quality Indicators (BEQI)<br />
webpage, “Energy‐Saving Tips.” 201 Residents can reduce energy costs by 10‐50% by<br />
implementing relatively simple energy‐savings measures. (Please see Opportunities for<br />
Citizen Action.)<br />
199 Grant Smith, Executive Director <strong>of</strong> Citizens Action Coalition, personal communication, November 15, 2008.<br />
200 Greg Pahl, The CitizenPowered Energy Handbook: Community Solutions to a Global Crisis (Chelsea Green<br />
River Publishing Company: White River Junction, VT, 2007), 29.<br />
201 <strong>Bloomington</strong> Environmental Commission, <strong>Bloomington</strong> Environmental Quality Indicators <strong>Report</strong>,<br />
http://bloomington.in.gov/documents/viewDocument.php?document_id=2987<br />
Source: U.S. EPA<br />
<strong>Report</strong> <strong>of</strong> the <strong>Bloomington</strong> <strong>Peak</strong> <strong>Oil</strong> <strong>Task</strong> <strong>Force</strong> 163
2. The community should explore the possibility <strong>of</strong> local power generation from<br />
renewable sources.<br />
As <strong>of</strong> 2008, there were 72 cities in <strong>Indiana</strong> which had municipally‐generated power<br />
utilities. 202 Generating energy from renewable sources such as the landfill or wastewater<br />
treatment facilities is discussed in the Municipal Services chapter. Local power generation<br />
obtained from renewable sources will become critical when power from conventional<br />
(centralized, coal‐based) sources becomes problematic. Local power generation also has<br />
the added benefit <strong>of</strong> diversifying the local economy and creating jobs.<br />
3. Establish a revolving fund in HAND to <strong>of</strong>fer loans to homeowners for<br />
installation <strong>of</strong> renewable energy.<br />
As the grid becomes ever‐more taxed and unreliable, household production <strong>of</strong> energy will<br />
afford residents a degree <strong>of</strong> energy security. HAND’s current home rehabilitation programs<br />
are federally funded and do not include the installation <strong>of</strong> renewable energy such as solar<br />
panels. The <strong>City</strong> should establish a revolving fund to be administered by HAND for<br />
providing low‐interest loans to income‐eligible residents to install renewable energy<br />
systems. 203<br />
4. New residential construction should both: a) meet strict energy requirements<br />
and b) tend toward a smaller size.<br />
All new homes should be both more energy efficient and smaller. Passive solar homes,<br />
smaller homes, and granny flats should be encouraged.<br />
202 <strong>Indiana</strong> Municipal Electric Association, http://www.imea.com.<br />
203 For example, the Berkeley <strong>City</strong> Council has enacted a plan in which homeowners can apply for a municipal<br />
loan <strong>of</strong> up to $22,000 to help pay for the upfront costs <strong>of</strong> installing a solar energy system.<br />
http://solar.calfinder.com/blog/news/berkeley‐finalizes‐solar‐lending‐program/<br />
<strong>Report</strong> <strong>of</strong> the <strong>Bloomington</strong> <strong>Peak</strong> <strong>Oil</strong> <strong>Task</strong> <strong>Force</strong> 164
Passive solar houses<br />
In addition to being oriented properly to take advantage <strong>of</strong> the sun, passive solar houses<br />
are well‐insulated and feature an airtight building envelope. 204 The walls are 19‐inches<br />
thick, compared to the standard 3.5‐inch thickness <strong>of</strong> typical US homes. These houses are<br />
built with<br />
extremely high<br />
performance<br />
objectives: to<br />
reduce energy use<br />
90% in new<br />
construction and<br />
80% in existing<br />
buildings. 205 A<br />
passive solar<br />
house is designed to<br />
make use <strong>of</strong> the<br />
sun’s energy for heat and light, but unlike active solar heating systems, passive design<br />
doesn't involve the use <strong>of</strong> mechanical and electrical devices, such as pumps, fans, or<br />
electrical controls to move the solar heat. 206<br />
204 U.S. Department <strong>of</strong> Energy, Passive Solar Home Design,<br />
http://www.energysavers.gov/your_home/designing_remodeling/index.cfm/mytopic=10250<br />
205 Murphy, 155<br />
206 Supra note 202.<br />
Source: U.S. DOE, http://www.eere.energy.gov/de/passive_solar_design.html<br />
<strong>Report</strong> <strong>of</strong> the <strong>Bloomington</strong> <strong>Peak</strong> <strong>Oil</strong> <strong>Task</strong> <strong>Force</strong> 165
Granny flats<br />
In <strong>Bloomington</strong>, there has been vocal opposition to granny<br />
flats or accessory dwelling units (ADUs). 207 An ADU is a self‐<br />
contained apartment in an owner‐occupied, single‐family<br />
home or on a lot that is either attached to the principal<br />
dwelling or in a separate structure on the same property.<br />
The flat might be a suite above a rear detached garage, above<br />
the main floor <strong>of</strong> a house or detached from the principal dwelling like a garden flat.<br />
While some residents have concerns about such structures, ADUs have been shown to<br />
increase the community’s supply <strong>of</strong> affordable housing and enhance the social stability and<br />
mix <strong>of</strong> neighborhoods with little or no negative impact on the physical character <strong>of</strong> the<br />
neighborhood. 208 ADUs also help to maximize use <strong>of</strong> existing public infrastructure and<br />
reduce the pressure on open space and farmlands from sprawling development. As there is<br />
considerable community concern regarding allowing granny flats, the <strong>City</strong> should engage in<br />
greater public awareness regarding the benefits <strong>of</strong> granny flats.<br />
Micro houses<br />
Micro houses are extremely small houses with a<br />
maximum area <strong>of</strong> 500 square feet. 209 While these<br />
houses may not be suited for everyone, as household<br />
energy prices rise, more residents might find smaller<br />
houses more attractive. It should be noted that, for<br />
safety purposes, the <strong>Indiana</strong> Residential Code requires<br />
that every dwelling unit shall have at least one<br />
habitable room that shall have not less than 120 square feet. 210<br />
207 Brady Gilliham, “<strong>City</strong> Plan Commission Votes Down Granny Flats,” Herald Times, May 5, 2009, p. A6.<br />
208 <strong>State</strong> <strong>of</strong> Massachusetts, Smart Growth/Smart Energy, Accessory Dwelling Units,<br />
http://www.mass.gov/envir/smart_growth_toolkit/pages/mod‐adu.html.<br />
Source: U.S. EPA<br />
209 See, Building Home and Garden, Micro Homes, http://www.buildinghomegarden.com/micro‐homes.html<br />
210 R 304.1, the <strong>Indiana</strong> Residential Code is modeled on the International Residential Code<br />
Source: Tumbleweed tiny house, Justin Thomas,<br />
www.treehugger.com<br />
<strong>Report</strong> <strong>of</strong> the <strong>Bloomington</strong> <strong>Peak</strong> <strong>Oil</strong> <strong>Task</strong> <strong>Force</strong> 166
5. Establish a plan for retr<strong>of</strong>itting 5% <strong>of</strong> existing city housing stock per year.<br />
While it is important that new homes are as efficient as possible, it saves even more energy<br />
to ensure that existing homes are as energy efficient as possible. This could be<br />
accomplished by major efforts such as reducing home size, thickening the building’s<br />
envelope, and moving heating and ductwork within conditioned space. 211 However, it<br />
would also be accomplished by relatively simple measures such as installing more efficient<br />
light bulbs, addressing leaks, putting up heavier drapes, and switching out appliances. The<br />
<strong>City</strong> should work with community partners to outline a plan to retr<strong>of</strong>it 5% <strong>of</strong> the existing<br />
owneroccupied and rental housing stock each year, starting at least by 2014, if not<br />
earlier.<br />
6. Establish an Alternative Technology Advisory Committee.<br />
Since many ideas for energy efficiency will involve uncommon techniques or materials, it<br />
may be helpful for the <strong>City</strong> and County to work together to follow the lead <strong>of</strong> Portland in<br />
establishing an Alternative Technology Advisory Committee. This committee is made up <strong>of</strong><br />
experts in sustainable technologies and emerging construction techniques who help<br />
building <strong>of</strong>ficials evaluate new technologies. A builder wishing to use an emerging,<br />
sustainable technology may submit an application to the committee along with any<br />
available test data, case studies, or relevant information that shows how the technology can<br />
meet the building code. The committee evaluates and advises staff regarding innovative<br />
designs and construction methods. 212<br />
211 Murphy, 157.<br />
212 See http://www.portlandonline.com/bds/index.cfm?c=48661 .<br />
<strong>Report</strong> <strong>of</strong> the <strong>Bloomington</strong> <strong>Peak</strong> <strong>Oil</strong> <strong>Task</strong> <strong>Force</strong> 167
7. Actively work to grow building efficiency expertise in the community.<br />
With the current economic conditions unfavorable to home construction, there are likely to<br />
be many people with knowledge <strong>of</strong> buildings who might be interested in training to<br />
become home performance specialists. Home assessment training is typically a week‐long<br />
intensive program, costing $1,200 ‐ $2,500. The <strong>City</strong> and other community stakeholders<br />
should explore whether it might be possible to help subsidize the cost <strong>of</strong> some <strong>of</strong> this<br />
training for local residents. In return, trainees could promise to conduct a certain number<br />
<strong>of</strong> free or reduced‐rate home assessments for low‐income residents and/or non‐pr<strong>of</strong>it<br />
organizations, once they are certified 213 .<br />
8. Promote green mortgages.<br />
The <strong>City</strong> should work with local banks to promote Energy Efficient (EEM) and Energy<br />
Improvement Mortgages (EIM). EEMs are mortgages that credit a home’s energy efficiency<br />
in the mortgages themselves, while EIMs allow borrowers to include the cost <strong>of</strong> energy‐<br />
efficiency improvements to an existing home in the mortgage without increasing the down<br />
payment. EIMs allow the borrower to use the money saved in utility bills to finance energy<br />
improvements. 214<br />
9. Implement incentives to make rental units more energy efficient.<br />
In an effort to address the “split incentive” dilemma, the <strong>City</strong> should think through ways it<br />
might encourage landlords to make rentals more efficient. A number <strong>of</strong> local governments<br />
have implemented programs either to provide reimbursements to landlords who<br />
weatherize their rental units or to allow tenants to allot a portion <strong>of</strong> their rent to efficiency<br />
improvements.<br />
213 Such training is <strong>of</strong>fered by organizations such as <strong>Indiana</strong>polis‐based Energy Efficient Homes Midwest,<br />
http://www.eehmidwest.com/Energy_Efficient_Homes_Midwest/Home.html; North Carolina’s Southface, ,<br />
http://www.southface.org/web/programs&events/courses&training/sf_courses‐trainings.htm and the<br />
Tennessee company, Building Performance Institute, Inc., http://www.bpi.org/content/home/index.php .<br />
214 See Energy Star, What is an Energy Efficient Mortgage?<br />
http://www.energystar.gov/index.cfm?c=bldrs_lenders_raters.energy_efficient_mortgage<br />
<strong>Report</strong> <strong>of</strong> the <strong>Bloomington</strong> <strong>Peak</strong> <strong>Oil</strong> <strong>Task</strong> <strong>Force</strong> 168
In helping the <strong>City</strong> devise incentives, the following examples may prove instructive:<br />
• Chicago’s “Repair and Deduct” program<br />
The “Repair and Deduct” program allows tenants to deduct half <strong>of</strong> one<br />
month’s rent annually to spend on improvements <strong>of</strong> their choice. 215<br />
• The New York Energy $mart Multifamily Performance Program<br />
This program targets the operational efficiencies <strong>of</strong> multi‐family buildings by<br />
engaging a partner network made up <strong>of</strong> engineers, energy consultants, and<br />
other industry pr<strong>of</strong>essionals. Eligible buildings are required to benchmark<br />
their energy performance compared to a set <strong>of</strong> similar buildings. Depending<br />
on their relative rank, they are assigned a performance target to achieve.<br />
If the building meets its target, the owner is eligible for funding. The goals <strong>of</strong><br />
this program include: saving thousands <strong>of</strong> dollars a year on energy costs,<br />
improving the value <strong>of</strong> the building and providing tenants with a comfortable<br />
and affordable living environment. 216<br />
• Minnesota Rental Energy Loan Fund Program<br />
This program provides low‐interest five‐year loans to landlords to improve<br />
the efficiency <strong>of</strong> their rentals. The program is not restricted to low‐income<br />
owners and covers a wide range <strong>of</strong> efficiency improvements for a property.<br />
Borrowers must have at least one‐third interest in the property, or be<br />
purchasing it through a mortgage or contract for deed. 217<br />
215 Chicago Residential Landlord and Tenant Ordinance, 5‐12‐110(c); See also Chicago Metropolitan Tenants<br />
Organization, Chicago Tenants Rights Pamphlets (English #2 <strong>of</strong> 3);<br />
http://www.tenant.net/Other_Areas/Illinois/mto/english2.html#Rent%20Withholding%20%20and%20Re<br />
pair%20and%20Deduct<br />
216 New York <strong>State</strong> Energy Research and Development Authority,<br />
http://getenergysmart.org/MultiFamilyHomes/ExistingBuilding/BuildingOwner.aspx<br />
217 Center for Energy and the Environment,<br />
http://www.mncee.org/programs_residential/rental_rehab_financing/rental_energy_loan_fund/index.php<br />
<strong>Report</strong> <strong>of</strong> the <strong>Bloomington</strong> <strong>Peak</strong> <strong>Oil</strong> <strong>Task</strong> <strong>Force</strong> 169
10. Educate and motivate citizens to change habits.<br />
As Pat Murphy points out, “Changing habits is as important as changing infrastructure.” 218<br />
In addition to making citizens aware <strong>of</strong> energy‐techniques, such as those outlined in the<br />
Opportunities for Citizen Action section <strong>of</strong> this <strong>Report</strong>, below are several strategies that may<br />
be useful in helping people understand the need to make changes and learn how to make<br />
them.<br />
• Launch an “Efficiency Pioneers” Program<br />
The <strong>City</strong> should create an Efficiency Pioneers program. Participants in the<br />
program would undergo a home energy audit subsidized by the <strong>City</strong> in order<br />
to discover best ways to drastically reduce utility use. Participating<br />
households would hold regular open‐house or neighborhood events<br />
showcasing their efforts. All efficiency modifications should be well<br />
documented and publicized. Part <strong>of</strong> the cost <strong>of</strong> the program might be<br />
underwritten by area businesses (home assessors, lumber yards, building<br />
suppliers, architects, and contractors).<br />
• The <strong>City</strong> should sponsor an energy conservation competition.<br />
218 Murphy, 162‐3.<br />
Community stakeholders such as <strong>Indiana</strong> University and the Southern<br />
<strong>Indiana</strong> Renewable Energy Network (SIREN) have conducted or initiated<br />
energy conservation competitions with great success. 219 The <strong>City</strong> should<br />
expand this effort by sponsoring an energy conservation competition for the<br />
citizens <strong>of</strong> <strong>Bloomington</strong>. The goals <strong>of</strong> the competition would be to<br />
demonstrate how easy it is to reduce consumption and to create permanent<br />
community habits.<br />
Throughout the competition, the <strong>City</strong> should publicize the effort widely. The<br />
<strong>City</strong> could partner with efficiency experts to sponsor efficiency workshops<br />
and webinars. Newspaper feature stories, film festivals and an energy<br />
efficiency display in the atrium <strong>of</strong> <strong>City</strong> Hall could be part <strong>of</strong> the outreach<br />
effort.<br />
Winners could be awarded a solar panel or some other component <strong>of</strong> a<br />
renewable energy system, reinforcing the concept that renewable energy<br />
makes sense only after reducing energy use as much as possible.<br />
219 IU’s effort is known as a yearly “Energy Challenge” while SIREN’s effort is known as an “Energy<br />
Showdown.”<br />
<strong>Report</strong> <strong>of</strong> the <strong>Bloomington</strong> <strong>Peak</strong> <strong>Oil</strong> <strong>Task</strong> <strong>Force</strong> 170
• “Energy savings accounts”<br />
Ideally, people would implement the easiest and least expensive<br />
conservation strategies first, and then apply the money saved toward more<br />
expensive projects. However, it is easy for money not spent on utility bills to<br />
be spent somewhere else, so that the larger projects always stay just out <strong>of</strong><br />
reach. “Energy savings accounts” would circumvent that problem with the<br />
help <strong>of</strong> local banks.<br />
A customer would set up an energy savings account with her or his local<br />
bank. A baseline utility use would be established, along with a direct<br />
payment program. Each month, the customer would pay her or his baseline<br />
utility rate to the bank, which would then pay the actual amount owed to the<br />
utilities. The difference, presumably saved by conservation and other<br />
changes, goes into the customer’s energy savings account, where it is saved<br />
for future home efficiency improvements, renewable energy projects, and so<br />
on. (If utility use increased, some provision would need to be in place for the<br />
customer to pay the additional amount.) Perhaps it would be possible to<br />
negotiate a special interest rate or a matching funds program for those who<br />
participate.<br />
MEDIUMTERM (515 Years)<br />
1. Approximately half <strong>of</strong> the <strong>City</strong>’s housing stock should be retr<strong>of</strong>itted for energy<br />
efficiency within the next 15 years (by 2024).<br />
LONGTERM (1530 Years)<br />
1. Close to 100% <strong>of</strong> the <strong>City</strong>’s housing stock should be retr<strong>of</strong>itted for energy<br />
efficiency within the next 30 years (by 2039).<br />
<strong>Report</strong> <strong>of</strong> the <strong>Bloomington</strong> <strong>Peak</strong> <strong>Oil</strong> <strong>Task</strong> <strong>Force</strong> 171
SUSTENANCE:<br />
FOOD, WATER, WASTE & HEALTH CARE<br />
“Sustenance” can be understood as the maintenance and nurturance <strong>of</strong> health and life. The<br />
elements <strong>of</strong> sustenance include: food, water, waste handling, and health care. At present,<br />
these elements are centrally provided by private companies, government, and publicly‐<br />
owned corporations and are entirely dependent on petroleum. In a medical model,<br />
<strong>Bloomington</strong> is on “life‐support,” with the well‐being <strong>of</strong> its residents largely dependent on a<br />
source <strong>of</strong> energy that is widely expected to contract within the next five to 15 years.<br />
To prepare for this contraction, sustenance for <strong>Bloomington</strong>'s citizens in a low‐energy<br />
future must derive significantly from the resources <strong>of</strong> the household and from forests and<br />
farms within the city and its surrounding region. The distance most food travels from field<br />
to table will shrink dramatically. The distribution <strong>of</strong> food for sale must also move closer to<br />
consumers who can be expected to travel less by car and more on foot, bicycle, and public<br />
transit in the future. The process <strong>of</strong> providing for our own daily needs while reducing our<br />
reliance on fossil fuels is the essence <strong>of</strong> building community resilience.<br />
We expect that it will take decades to achieve levels <strong>of</strong> self‐reliance comparable to those<br />
enjoyed by <strong>Indiana</strong> communities a century ago, so we must outline and prioritize those<br />
actions which will address our greatest vulnerabilities first. The path to community self‐<br />
reliance will require the recovery <strong>of</strong> old skills, the propagation <strong>of</strong> new skills, and the<br />
reorganization <strong>of</strong> public and private infrastructure within the <strong>Bloomington</strong> community.<br />
Public agencies have an important role to play in catalyzing and nurturing this<br />
transformation.<br />
<strong>Report</strong> <strong>of</strong> the <strong>Bloomington</strong> <strong>Peak</strong> <strong>Oil</strong> <strong>Task</strong> <strong>Force</strong> 172
FOOD<br />
Eating <strong>Oil</strong><br />
Over the last 100 years, the way we feed ourselves has changed radically. Chiefly from the<br />
use <strong>of</strong> pesticides, herbicides, fertilizers, and mechanization, agricultural production over<br />
the last century has more that tripled. However, the modern food system is both highly<br />
centralized and almost entirely dependent on oil. It relies on oil both for production and for<br />
transportation from farm to table. Indeed, little more than 2 percent <strong>of</strong> the food we eat<br />
comes from local sources. Our food travels thousands <strong>of</strong> miles on average, most <strong>of</strong> it is<br />
carried by diesel‐powered trucks. 220 As <strong>Bloomington</strong> consumers, we complete deliveries to<br />
the kitchen by commuting from our homes to half a dozen shopping hubs at major traffic<br />
junctures to the north, south, east, and west <strong>of</strong> the city center.<br />
This system <strong>of</strong> production and<br />
consumption is a very energy<br />
intensive one. Approximately 7.3<br />
calories <strong>of</strong> fossil energy go into<br />
harvesting and serving up one<br />
calorie <strong>of</strong> solar‐derived food<br />
energy. 221 Of this total, 1.6 calories<br />
go into farm operations, transport<br />
requires 1.0 calorie, processing<br />
and packaging require 1.7<br />
calories, retail sales and food<br />
Source: Woodrow Wilson International Center for Scholars<br />
service 0.8 calories, and household level storage and preparation 2.3 calories. Most<br />
Americans are literally eating oil and gas (and not a little coal).<br />
220 It is fair to assume that <strong>Bloomington</strong> foodmiles do not differ that much from the national average. Produce<br />
in the U.S. travels, on average, 1300 ‐ 2000 miles from farm to consumer.<br />
221 Richard Heinberg and Michael Bomford, The Food and Farming Transition: Toward a PostCarbon Food<br />
System, Post Carbon Institute, 2009. http://www.postcarbon.org/food<br />
<strong>Report</strong> <strong>of</strong> the <strong>Bloomington</strong> <strong>Peak</strong> <strong>Oil</strong> <strong>Task</strong> <strong>Force</strong> 173
Indeed, it is estimated that the U.S. food system uses 17 percent <strong>of</strong> the total energy<br />
consumed in the nation each year – about 10 barrels <strong>of</strong> oil equivalent per person. 222<br />
Food Retail<br />
0.3 calorie<br />
Packaging<br />
0.5 calorie<br />
Processing<br />
1.2 calories<br />
Commercial Food Service<br />
0.5 calorie<br />
Transport<br />
1 calorie<br />
Farming<br />
1.6 calories<br />
Household Storage &<br />
Preparation<br />
2.3 calories<br />
Energy Used to Yield One Food Calorie. 223 The U.S. American food system uses 7.3 calories to produce and<br />
deliver one calorie <strong>of</strong> food energy.<br />
222<br />
Pat Murphy, Plan C: Community Survival Strategies for <strong>Peak</strong> <strong>Oil</strong> and Climate Change. (Gabriola Island, BC:<br />
New Society Publishers, 2008).<br />
223 Adapted from Heinberg and Bomford, Food and Farming and M.C. Heller and G.A. Keoleian, Life CycleBased<br />
Sustainability Indicators for Assessment <strong>of</strong> the U.S. Food System, University <strong>of</strong> Michigan (2000).<br />
<strong>Report</strong> <strong>of</strong> the <strong>Bloomington</strong> <strong>Peak</strong> <strong>Oil</strong> <strong>Task</strong> <strong>Force</strong> 174
VULNERABILITIES: Daily Bread<br />
The vulnerabilities inherent in our current well‐oiled way <strong>of</strong> feeding ourselves are<br />
manifold. Some <strong>of</strong> the more obvious threats to <strong>Bloomington</strong>'s food security due to peak oil<br />
include:<br />
1. Increased food prices due to fuelrelated cost hikes affecting production,<br />
processing, and transport.<br />
2. Increased food prices and/or shortages due to falling food production<br />
resulting from energyrelated shortages <strong>of</strong> agricultural inputs (fuel, fertilizer,<br />
irrigation water).<br />
3. Increased prices, or shortages <strong>of</strong> grain, cereals, and meat and dairy products<br />
due to diversion <strong>of</strong> grain to ethanol production.<br />
4. Shortages <strong>of</strong> grain due to increased purchasing by foreign governments<br />
(China, India, others) to cover shortfalls in domestic production as a result <strong>of</strong><br />
energy, climate or land problems.<br />
5. Shortages <strong>of</strong> food due to spoilage in transit or storage because <strong>of</strong> power<br />
outages due to grid electricity disruptions.<br />
6. Abrupt disruption in fuel supplies due to sudden loss <strong>of</strong> confidence in the U.S.<br />
dollar and a market or political embargo <strong>of</strong> oil shipments to this country with<br />
consequent dislocation <strong>of</strong> the trucking industry.<br />
7. A trucking strike or shutdown related to fuel price rises and a squeeze on<br />
driver incomes.<br />
8. Disruptions to the food supply system due to a lack <strong>of</strong> credit, bankruptcies, or<br />
other financial failures.<br />
9. Less than 2 percent <strong>of</strong> the food consumed by city residents is produced within<br />
the city, its surrounding region or the state.<br />
Many <strong>of</strong> these vulnerabilities are interrelated and are likely to compound each other. In a<br />
world <strong>of</strong> contracting energy supplies, our present food system is set up to fail. Therefore, it<br />
is imperative to begin creating an alternative system free <strong>of</strong> fossil fuels by which the city<br />
and area residents may be assured their daily bread.<br />
<strong>Report</strong> <strong>of</strong> the <strong>Bloomington</strong> <strong>Peak</strong> <strong>Oil</strong> <strong>Task</strong> <strong>Force</strong> 175
Local Food Production<br />
Efforts to promote local food production began more than 30 years ago and continue to<br />
grow today. <strong>Bloomington</strong> and Monroe County are fortunate to have some important<br />
elements <strong>of</strong> a local food system already in place: a large cooperative food merchandiser<br />
with three storefronts and many local suppliers, at least one commercial orchard, seasonal<br />
wild mushroom harvests, heritage animal breeds, two local wineries, two local breweries,<br />
well‐organized food pantries for the indigent, and the most vibrant farmers’ market in the<br />
Kale at local community garden<br />
state. During the past generation, the coordinated<br />
efforts <strong>of</strong> private citizens, local business, and <strong>City</strong><br />
government have done a remarkably good job <strong>of</strong><br />
weaving together many small contributions <strong>of</strong><br />
food growing to create a fabric <strong>of</strong> considerable<br />
breadth and diversity that has become a regional<br />
economic attractor and an anchor for the city's<br />
downtown. However, it would be vanity to claim<br />
that this is any more than a small down payment<br />
on a local food system.<br />
The amount <strong>of</strong> locally‐grown food sourced even<br />
through these many locally‐owned and operated<br />
outlets is small in comparison to the need.<br />
Americans consume an average <strong>of</strong> about one ton <strong>of</strong><br />
food per person per year, so <strong>Bloomington</strong>'s population <strong>of</strong> about 70,000 eats about 70,500<br />
tons <strong>of</strong> food per year, or 141,000,000 pounds. 224 Probably less than 2 percent <strong>of</strong> the food<br />
consumed by city residents in 2009 will be grown within Monroe or its immediate<br />
neighboring counties, and likely less than 5 percent will be produced within <strong>Indiana</strong>. 225<br />
224 For comparison, Mother Hubbard's Cupboard serves about 1 percent <strong>of</strong> this volume to its clients each<br />
year.<br />
225 These estimates are based on observation <strong>of</strong> produce and other goods sold in city markets, and reasonable<br />
extrapolation from published USDA statistics on agricultural production within the state and region. See<br />
<strong>Indiana</strong> Farm Direct, Fact Sheet http://www.indianafarmdirect.com/resource_guide/agriculture_tour.php<br />
<strong>Report</strong> <strong>of</strong> the <strong>Bloomington</strong> <strong>Peak</strong> <strong>Oil</strong> <strong>Task</strong> <strong>Force</strong> 176
While more and more people are planting gardens, we could grow substantially more <strong>of</strong><br />
our own food. It is likely that <strong>Bloomington</strong> tracks national gardening trends. Nationwide,<br />
approximately 32 percent <strong>of</strong> households have grown gardens. The National Gardening<br />
Association estimates that for 2009 that 38 percent <strong>of</strong> 114 million households will grow<br />
food gardens – almost 20 percent more than in 2008. 226 While it can be assumed that the<br />
portion <strong>of</strong> settled households gardening in our community is similar; the per capita yield<br />
from home production in the city is probably less than the national average because such a<br />
large portion <strong>of</strong> <strong>Bloomington</strong>'s population consists <strong>of</strong> university students – temporary<br />
landless residents. Though considerable potential for urban food production exists, at<br />
present this potential is barely realized in <strong>Bloomington</strong>.<br />
Indeed, most <strong>of</strong> <strong>Indiana</strong>'s "agricultural" production consists <strong>of</strong> feedstocks for animals or industry in the form<br />
<strong>of</strong> corn and soybeans. Commercial vegetable production within the <strong>State</strong> is very modest, averaging less than<br />
ten pounds per state resident. Most <strong>of</strong> this production is concentrated in areas far north and west <strong>of</strong> Monroe<br />
County, with tomatoes, melons, and green beans the chief measurable crops. Locally‐raised beef, pork, and<br />
lamb can be found in town, but not in large quantities, nor in many outlets. There is no dairy in Monroe<br />
County.<br />
226 National Gardening Association, Impact <strong>of</strong> Home and Community Gardening in America Survey, 2009<br />
http://www.gardenresearch.com/files/2009‐Impact‐<strong>of</strong>‐Gardening‐in‐America‐White‐Paper.pdf<br />
<strong>Report</strong> <strong>of</strong> the <strong>Bloomington</strong> <strong>Peak</strong> <strong>Oil</strong> <strong>Task</strong> <strong>Force</strong> 177
The Current U.S. Diet<br />
Americans eat an average <strong>of</strong> just under 4,000 calories per person per day. 227 Using the<br />
previously‐cited figure that 7.3 calories <strong>of</strong> fossil energy go into harvesting and serving up<br />
one calorie <strong>of</strong> solar‐derived food energy, 228 such consumption translates into about 30,000<br />
calories. This is the equivalent <strong>of</strong> 45 KWh per person per day, the energy equivalent <strong>of</strong> 450<br />
gallons <strong>of</strong> gasoline per year.<br />
At present, food energy comes two‐thirds from calorie‐intense foods (meat, dairy, eggs,<br />
fats, and sweeteners) and one‐third from nutrient‐intense foods (fruits, vegetables, grains,<br />
nuts, and legumes).<br />
THE TYPICAL U.S. AMERICAN DIET 229<br />
Annual Per Capita Consumption<br />
TOTAL % <strong>of</strong><br />
FOOD TYPE WEIGHT (lbs.) CALORIES/lb. CALORIES CALORIES<br />
Meat‐Milk‐Eggs 861.0 434 373,769 26.9<br />
Fats‐<strong>Oil</strong>s 93.7 3906 366,034 26.4<br />
Grain 192.3 1655 318,230 22.9<br />
Sweeteners 141.5 1494 209,941 15.2<br />
Vegetables 411.6 213 87,579 6.3<br />
Fruits 274.3 240 65,950 4.8<br />
Nuts 9.9 2595 25,798 1.9<br />
Legumes 7.0 1561 10,925 0.8<br />
227 Murphy, Plan C, 202.<br />
228 Heinberg, Food and Farming, 2.<br />
229 Adapted from Murphy, Plan C, 205‐211.<br />
<strong>Report</strong> <strong>of</strong> the <strong>Bloomington</strong> <strong>Peak</strong> <strong>Oil</strong> <strong>Task</strong> <strong>Force</strong> 178
The following table lists per capita averages <strong>of</strong> various food groups combined with<br />
estimates <strong>of</strong> land area needed to grow each type <strong>of</strong> food. "E" indicates “estimate” due to<br />
variations in the land intensity <strong>of</strong> products grouped together in each category. 230<br />
LAND USED TO SUSTAIN THE TYPICAL U.S. AMERICAN DIET<br />
FOOD TYPE LBS./CAPITA/YEAR SQUARE FEET/LB. ACRES/PERSON<br />
Dairy Products 592 100 E 1.36<br />
Vegetables 412 22 0.21<br />
Fruits 274 22 0.14<br />
Flour & Cereal 192 14 E 0.06<br />
Caloric<br />
Sweeteners 142 9 E 0.03<br />
Red Meats 117 150 E 0.40<br />
Poultry 99 100 E 0.23<br />
Fats & <strong>Oil</strong>s 94 44 E 0.09<br />
Eggs 33 60 E 0.05<br />
Misc vegetable<br />
foods 24 22 0.01<br />
Fish (primarily<br />
ocean/import) 17 44E<br />
Nuts 10 22 0.01<br />
Beans &<br />
Legumes 7 35 E 0.01<br />
TOTAL 2,013 2.60<br />
The Foodshed<br />
A “foodshed” is commonly understood to mean a local bioregion that grows food for a<br />
specific population. 231 Under current production methods, the land used to grow a typical<br />
diet is approximately 2.60 acres per person. Thus, <strong>Bloomington</strong>'s current foodshed<br />
amounts to 182,000 acres or 285 square miles <strong>of</strong> productive land distributed across the<br />
United <strong>State</strong>s and the rest <strong>of</strong> the world. The area <strong>of</strong> Monroe County is 390 square miles, most<br />
<strong>of</strong> which is not agriculturally suitable. On the face <strong>of</strong> it, Monroe County could not hope to<br />
feed itself. But what does the picture look like if we expand the territory to include the six<br />
counties surrounding Monroe County?<br />
230 Yield figures are derived from commercial averages.<br />
231 Arthur Getz, “Urban Foodsheds,” Permaculture Activist, 7(3) (1991).<br />
<strong>Report</strong> <strong>of</strong> the <strong>Bloomington</strong> <strong>Peak</strong> <strong>Oil</strong> <strong>Task</strong> <strong>Force</strong> 179
Regional Land and Population<br />
The prime agricultural land in the seven‐county region surrounding <strong>Bloomington</strong> (Monroe,<br />
Brown, Greene, Owen, Lawrence, Morgan, and Jackson counties) equals 1,232 square miles.<br />
While that is enough land to sustain over four times the population <strong>of</strong> <strong>Bloomington</strong> (based<br />
on current patterns <strong>of</strong> consumption and average agricultural yields by present methods), it<br />
is only enough for about 85 percent <strong>of</strong> the population <strong>of</strong> the region—still not enough prime<br />
farmland to feed the seven‐county region a standard American diet.<br />
PRIME AGRICULTURAL ACERAGE<br />
AND<br />
POPULATION OF 7COUNTY REGION SURROUNDING<br />
BLOOMINGTON 232<br />
PRIME AS<br />
% OF<br />
TOTAL POPULATION<br />
COUNTY TOTAL LAND<br />
PRIME<br />
FARMLAND<br />
Monroe 262,899 59,941 22.8 128,643<br />
Brown 203,137 16,251 8.0 14,760<br />
Greene 349,637 175,518 50.2 32,692<br />
Owen 248,193 108,212 43.6 22,398<br />
Lawrence 289,508 74,114 25.6 46,033<br />
Morgan 261,847 154,228 58.9 69,874<br />
Jackson 329,074 200,406 60.9 42,184<br />
TOTAL 1,944,295 788,670 40.6 356,254<br />
It is important to qualify these numbers. More land may be available for agriculture than is<br />
presently indicated by the category, "prime farmland," which is defined by the U.S.D.A. as<br />
"prime and important farmable soils, possibly needing some drainage or flood protection in<br />
some areas, but not requiring large‐scale amendment, preparation, grading, or terracing to<br />
be used as highly productive farmland for a large variety <strong>of</strong> crops." 233 Despite this<br />
definition, an examination <strong>of</strong> the region’s agricultural history paints a more productive<br />
picture <strong>of</strong> the land available to us for food production.<br />
232 Adapted from U.S. Census <strong>of</strong> Agriculture, 2007.<br />
233 Soil Survey Staff. "Soil Survey Manual". Soil Conservation Service. U.S. Department <strong>of</strong> Agriculture<br />
Handbook, 1993. http://soils.usda.gov/technical/manual/print_version/complete.html.<br />
<strong>Report</strong> <strong>of</strong> the <strong>Bloomington</strong> <strong>Peak</strong> <strong>Oil</strong> <strong>Task</strong> <strong>Force</strong> 180
<strong>Indiana</strong> agriculture reached its apex in 1900. In that year, approximately 21.6 million acres<br />
<strong>of</strong> the state’s 23 million acres were in farms and Monroe County had 237,500 acres <strong>of</strong> its<br />
land in farms. By 1930, Monroe County farmland had dropped to 191,985 acres due to<br />
increased competition from western growers, decline <strong>of</strong><br />
commodity prices, general economic contraction, and<br />
urbanization resulting from economic and social change,<br />
with a consequent fall in the rural population. Of the land<br />
in production in 1930, 47,842 acres were harvested<br />
cropland and 84,748 were pastured land. While data from<br />
earlier periods is obscure, we can assume that at the time<br />
<strong>of</strong> <strong>Indiana</strong>’s agricultural peak in 1900, the same<br />
proportions <strong>of</strong> total farmland were used in crop and<br />
pasture as in 1930: 25 percent in crops, 45 percent in<br />
pasture and 30 percent in woodland or other uses (or<br />
neglect). Thus, as much as 59,000 acres <strong>of</strong> Monroe County<br />
may at one time have been planted in crops, and as much<br />
as 107,000 acres may have been in pasture.<br />
This deduced figure for cropland in 1900 closely matches the 2007 Census data for prime<br />
A Monroe County Farm<br />
farmland. Land farmed and total value <strong>of</strong> farm<br />
production has fallen steadily in the state and<br />
region since 1900 and by as much as 25 percent<br />
from 1997 to 2002. A reasonable inference from<br />
this is that even within the past decade,<br />
significantly more land has been used for farming<br />
in the seven‐county region than was inventoried<br />
in 2007, and that under changed economic<br />
conditions, some <strong>of</strong> that land might be brought into production again.<br />
Loss <strong>of</strong> Prime Farmland<br />
Much prime farmland has<br />
been lost to development ‐‐<br />
most <strong>of</strong> it in the 20th century<br />
and most <strong>of</strong> it enabled by the<br />
availability <strong>of</strong> cheap oil.<br />
From 1982‐1992, <strong>Indiana</strong><br />
lost 150,000 acres <strong>of</strong><br />
farmland to development.<br />
Based on population,<br />
Monroe County's share <strong>of</strong><br />
that loss would have been<br />
about 2,800 acres.<br />
Development continued<br />
statewide during the 1990s<br />
and early 2000s at a similar<br />
rate, but has slowed since<br />
2003, and virtually ceased<br />
since 2007.<br />
<strong>Report</strong> <strong>of</strong> the <strong>Bloomington</strong> <strong>Peak</strong> <strong>Oil</strong> <strong>Task</strong> <strong>Force</strong> 181
Can <strong>Bloomington</strong> Feed Itself?<br />
Feeding ourselves is a critical goal. As we saw in the summer <strong>of</strong> 2008, food prices tend to<br />
follow in lock step with oil prices. As discussed previously in this <strong>Report</strong>, we expect oil<br />
prices to increase again. As they do<br />
so, some disruptions in the current<br />
distribution <strong>of</strong> food and other goods<br />
are likely.<br />
One critical way to mitigate the effects<br />
<strong>of</strong> ever‐increasing food costs is to<br />
grow more food locally. In addition to<br />
farmland available in the rural areas<br />
surrounding the city, there are many<br />
spaces to grow food within the city<br />
itself. Some <strong>of</strong> these spaces are held<br />
by local government, some by IU, and<br />
some by private entities. Much<br />
productive land is available right in<br />
our own backyards. Maximizing the<br />
amount <strong>of</strong> food we produce just<br />
within the city has the distinct<br />
advantage <strong>of</strong> reducing the amount <strong>of</strong><br />
energy it takes to get the food to the<br />
people and the people to the food.<br />
Potatoes at the <strong>Bloomington</strong> Community Farmers’ Market<br />
Source: Daniel Orr<br />
The greenspace available within the city limits was mapped by the <strong>City</strong>’s Environmental<br />
Commission in 2007. 234 As <strong>of</strong> the last inventory on July 1, 2007, 6,429 acres <strong>of</strong> greenspace<br />
were available within <strong>Bloomington</strong> corporate boundaries ‐‐ about 3900 square feet per city<br />
234 <strong>City</strong> <strong>of</strong> <strong>Bloomington</strong> Environmental Commission, Greenspace Trends in <strong>Bloomington</strong>, 20032007(2007).<br />
http://bloomington.in.gov/media/media.php?media_id=2738<br />
<strong>Report</strong> <strong>of</strong> the <strong>Bloomington</strong> <strong>Peak</strong> <strong>Oil</strong> <strong>Task</strong> <strong>Force</strong> 182
esident. Of this, 1,222 acres were held by <strong>Indiana</strong> University, 1,376 acres were controlled<br />
by Parks and Recreation, and 3,831 acres were in private hands. In addition, over 3,500<br />
acres <strong>of</strong> the city are zoned single‐family residential. Even if all this residential land is<br />
developed, then at least 2,500 <strong>of</strong> the 3,500 residential acres not covered with buildings or<br />
pavement might be made suitable for gardening, adding an additional 1,400 square feet per<br />
city resident. Therefore, approximately 5,300 square feet <strong>of</strong> open ground are presently<br />
available in <strong>Bloomington</strong> per city resident.<br />
Example <strong>of</strong> biointensive gardens.<br />
Source: www.homefarming.com<br />
To place these numbers in perspective, John Jeavons,<br />
author <strong>of</strong> How to Grow More Vegetables Than You Ever<br />
Thought Possible on Less Land Than You Can<br />
Imagine, 235 has clearly demonstrated that enough food<br />
can be produced to support one adult for one year on<br />
4,000 square feet without compromising nutritional<br />
requirements. Jeavon’s approach is a biointensive one<br />
which focuses on maximum yields from a minimum<br />
area <strong>of</strong> land while simultaneously improving the soil.<br />
This approach suggests that enough land exists, even<br />
within the corporate boundary <strong>of</strong> <strong>Bloomington</strong>, to<br />
provide a basic, albeit primarily vegetarian, diet to all<br />
city residents.<br />
In assessing the present and future capacity <strong>of</strong> <strong>Bloomington</strong> to feed itself, many factors<br />
must be taken into account. First <strong>of</strong> all, under conditions <strong>of</strong> food price increase and<br />
shortage, people are strongly motivated to consider alternatives to their present modes <strong>of</strong><br />
eating and sourcing food. This was the case in Cuba during the Special Period <strong>of</strong> 1991‐94.<br />
During this period, oil supplies plummeted and mechanized agriculture ground to a halt.<br />
As a result, residents in Havana and other cities planted just about every available square<br />
foot <strong>of</strong> land and adopted a diet which included approximately 85 percent less meat. The<br />
235 John Jeavons, How to Grow More Vegetables Than You Ever Thought Possible on Less Land Than You Can<br />
Imagine (Berkeley: Ten Speed Press, rvsd. ed., 1991).<br />
<strong>Report</strong> <strong>of</strong> the <strong>Bloomington</strong> <strong>Peak</strong> <strong>Oil</strong> <strong>Task</strong> <strong>Force</strong> 183
population maintained health, while critical groups (pregnant women and children<br />
especially) received extra rations.<br />
Under conditions <strong>of</strong> food shortage, <strong>Bloomington</strong>ians would likely be similarly motivated to<br />
increase local food production by gardening, and could be expected to accept significant<br />
changes to dietary habits. A modified American diet that incorporated relatively easy<br />
adjustments would serve about 87 percent <strong>of</strong> the weight <strong>of</strong> food <strong>of</strong> the present diet and<br />
would more than meet World Health Organization average daily nutritional needs while<br />
requiring substantially less land—about 1.85 acres per person. (See table, following page).<br />
Such a modified diet would:<br />
• eliminate most caloric sweeteners (substituting smaller amounts <strong>of</strong> honey, maple<br />
syrup, and sorghum syrup—all locally sourced sugars);<br />
• reduce the amount <strong>of</strong> fats and oils by 60 percent while doubling the volume <strong>of</strong> nuts<br />
and seeds;<br />
• reduce dairy consumption by about one‐third;<br />
• provide two‐fifths <strong>of</strong> the meat consumed today;<br />
• add about seven times as many beans and legumes; and<br />
• add about 50 percent more grain, flour and cereals.<br />
This diet assumes no change in farming practices or land intensity <strong>of</strong> production, though<br />
under such constraints, these would likely also shift.<br />
It is reasonable to conclude that the land base <strong>of</strong> the seven‐county region surrounding<br />
<strong>Bloomington</strong> is more than adequate to produce the amount <strong>of</strong> food needed to sustain the<br />
present population <strong>of</strong> the area in a state <strong>of</strong> health. Indeed, a reduction in fats, caloric<br />
sweeteners, red meat, and the substitution <strong>of</strong> whole grains and flours for denatured cereal,<br />
plus the substitution <strong>of</strong> smaller amounts <strong>of</strong> wild game and other locally harvested wild<br />
foods such as mushrooms for ocean fish now eaten would likely improve health.<br />
<strong>Report</strong> <strong>of</strong> the <strong>Bloomington</strong> <strong>Peak</strong> <strong>Oil</strong> <strong>Task</strong> <strong>Force</strong> 184
A LocallyGrown Diet<br />
The diet suggested above is one that is based on familiar foods and is roughly the same<br />
volume and calories per person as current average consumption. This diet, and the land<br />
required to maintain it, is detailed below.<br />
A LOCALLYGROWN DIET<br />
LAND REQUIRED TO PROVIDE FOR<br />
AVERAGE PER CAPITA PER YEAR CONSUMPTION<br />
FOOD TYPE POUNDS<br />
SQUARE<br />
FEET/POUND ACRES<br />
Vegetables 500 22 0.25<br />
Dairy Products<br />
Grain, Flour,<br />
400 100E 0.91<br />
and Cereals 300 14E 0.10<br />
Fruits<br />
Beans &<br />
275 22 0.14<br />
Legumes 60 35E 0.05<br />
Red Meats 55 150 0.19<br />
Eggs 40 60 0.05<br />
Poultry 35 100 0.08<br />
Fats & <strong>Oil</strong>s 35 44E 0.04<br />
Misc vegetable<br />
foods 35 22 0.02<br />
Nuts & Seeds<br />
20 22 0.01<br />
Caloric<br />
Sweeteners<br />
Fish<br />
(aquaculture &<br />
15 9E 0.00<br />
wild local) 10 44 0.01<br />
Game 5 0 0.00<br />
TOTAL 1,785 1.85<br />
Of concern in making the above estimates is the nature <strong>of</strong> the agricultural system itself.<br />
What would be its sources <strong>of</strong> fertility in the absence <strong>of</strong> most chemical nitrates and<br />
phosphates? Leguminous and other cover crops would need to be grown in rotations,<br />
especially in shoulder and cold seasons to the extent possible. A larger population <strong>of</strong><br />
livestock would be needed to exploit available pasture land and to provide adequate meat<br />
even for a lower‐calorie diet. Composted <strong>of</strong>fal and animal remains from local<br />
slaughterhouses, plus human and other animal manures, would need to be recaptured for<br />
<strong>Report</strong> <strong>of</strong> the <strong>Bloomington</strong> <strong>Peak</strong> <strong>Oil</strong> <strong>Task</strong> <strong>Force</strong> 185
fertility inputs and yields <strong>of</strong> surplus biomass would need to be harvested from non‐<br />
croplands throughout the region. Assuming that most <strong>of</strong> the 60 percent <strong>of</strong> the region's land<br />
area not in prime farmland is wooded or could be sown to compost crops, it is likely that a<br />
regenerative agricultural system for the region could be designed and implemented given<br />
sufficient cooperation and willingness. Of course, the best innovative techniques for soil<br />
fertility management and biointensive production should be employed. Yet, even without<br />
these potential improvements to productivity, it seems likely that the region could feed<br />
itself if other factors <strong>of</strong> production could be mobilized.<br />
Factors Which Moderate Food Demand<br />
While we’ve determined that the agricultural land base <strong>of</strong> <strong>Bloomington</strong>’s seven‐county<br />
region is sufficient to provide <strong>Bloomington</strong> and its neighbors with a healthy diet, we’ve<br />
come to this conclusion in light <strong>of</strong> the following factors which moderate local food demand.<br />
1. Many students at <strong>Indiana</strong> University and other area colleges depart the region for<br />
travel, study, or to return home to family during breaks, reducing by several<br />
percentage points the food requirements <strong>of</strong> the area. In the event that food<br />
shortages emerge as a chronic social condition, the resident population may be<br />
reduced as students seek refuge with their families in other parts <strong>of</strong> the state or the<br />
nation.<br />
2. The American diet is widely acknowledged to be excessive and most people could<br />
live better and longer on somewhat less food. Sugars and bad fats could be reduced<br />
with an expected increase in health, and perhaps less hunger, as these empty<br />
calories <strong>of</strong>ten strip the body <strong>of</strong> nutrients and leave it craving even more food.<br />
3. Much less meat and dairy in the diet could be anticipated in the event <strong>of</strong> extreme<br />
conditions. Price increases for these energy‐ and land‐intensive foods will tend to<br />
reduce consumption, even absent shortages. This change alone would dramatically<br />
reduce the amount <strong>of</strong> land required to feed the regional population <strong>of</strong> 350,000.<br />
4. Conventional American agriculture uses little labor but much land, energy, and<br />
capital. Home gardening produces 2‐7 times as much food per acre as commercial<br />
farming. Jeavons' biointensive gardening methods produce 11 times the fruits and<br />
vegetables per unit <strong>of</strong> land as conventional American agriculture. (Indeed, using<br />
Jeavons’ method, Jules Dervaes and his family raise 6,000 lbs. <strong>of</strong> food annually on<br />
<strong>Report</strong> <strong>of</strong> the <strong>Bloomington</strong> <strong>Peak</strong> <strong>Oil</strong> <strong>Task</strong> <strong>Force</strong> 186
one‐fifth <strong>of</strong> an acre in Pasadena, California.) 236<br />
In conclusion, arable land available within the <strong>City</strong> <strong>of</strong> <strong>Bloomington</strong> alone (as much<br />
as 8,000 acres, or upwards <strong>of</strong> 5,000 square feet per resident) is potentially sufficient<br />
to meet most <strong>of</strong> the vegetable, fruit, egg, and some poultry requirements <strong>of</strong> city<br />
residents were it to be cultivated to the maximum extent possible using the most<br />
productive and intensive garden‐scale methods.<br />
236 http://www.patht<strong>of</strong>reedom.com/about/urbanhomestead.shtml<br />
<strong>Report</strong> <strong>of</strong> the <strong>Bloomington</strong> <strong>Peak</strong> <strong>Oil</strong> <strong>Task</strong> <strong>Force</strong> 187
MITIGATION GOALS & STRATEGIES: PLANTING SEEDS<br />
While <strong>Bloomington</strong> may be a long way from<br />
achieving self‐reliance in food – and indeed may<br />
never be required to be completely self sufficient –<br />
we should begin now to increase all forms <strong>of</strong> food<br />
production, processing, and storage in an effort to<br />
build community resilience.<br />
The short‐term goals and strategies presented here<br />
aim to mobilize the community to begin self‐<br />
provisioning. These recommendations are also<br />
intended to change attitudes so as to make both<br />
legitimate and preferable the idea <strong>of</strong> a locally‐<br />
centered food system and to set in place<br />
infrastructure and launch initiatives that will make<br />
Photo: Cheryl DeWolfe, Wikimedia Commons<br />
possible a rapid expansion <strong>of</strong> local capacity in the medium term. In 30 years, the aim <strong>of</strong><br />
these recommendations is to realize a significant level <strong>of</strong> local self‐reliance for the<br />
<strong>Bloomington</strong> region, thereby ensuring the well‐being and food security <strong>of</strong> the citizenry.<br />
These initiatives should be understood as innovative, experimental, and aimed at preparing<br />
the ground for a much larger effort to follow. Empirical feedback and rapid incorporation <strong>of</strong><br />
new learning must be integral to the work. This process will depend to a great deal on the<br />
support <strong>of</strong> the public sector and on the willingness <strong>of</strong> private citizens to share their<br />
knowledge and discoveries. The community – and local government especially – can aid<br />
this process by exhortation and encouragement. The rewards <strong>of</strong> local food production are<br />
potentially substantial: improved nutrition and health, a more beautiful and productive<br />
environment, less waste, enhanced food security, and a new basis for local industry and<br />
commerce. With this greater self‐sufficiency, we can also hope for an increase in sociability<br />
and prosperity in our neighborhoods and for stronger households and families.<br />
<strong>Report</strong> <strong>of</strong> the <strong>Bloomington</strong> <strong>Peak</strong> <strong>Oil</strong> <strong>Task</strong> <strong>Force</strong> 188
Toward Greater Local Food Production<br />
The recommendations which follow are based on these principles:<br />
1) Enlist private sector cooperation;<br />
2) Advocate for local food production and increase access to relevant<br />
information to support food production and processing;<br />
3) Remove or reduce legal, institutional, and cultural barriers to farming within<br />
and around the city, and open institutional markets to local food;<br />
4) Reserve open land for agriculture and make additional land available for food<br />
production;<br />
5) Create and expand local food processing and distribution systems;<br />
6) Organize direct support by the city and other public agencies to address<br />
infrastructure needs for water supply, fertility collection and distribution,<br />
food processing, storage, and marketing; and<br />
7) Create specific forms <strong>of</strong> support for new farmers, including training, land<br />
access, low‐cost start‐up loans, and property tax abatements or land rent<br />
<strong>of</strong>fsets.<br />
<strong>Report</strong> <strong>of</strong> the <strong>Bloomington</strong> <strong>Peak</strong> <strong>Oil</strong> <strong>Task</strong> <strong>Force</strong> 189
SHORTTERM STRATEGIES (15 Years)<br />
In the interest <strong>of</strong> increasing all forms <strong>of</strong> food production within and around the city such<br />
that the city achieves 20 percent self‐provision in vegetables, fruits, nuts, seeds, and small<br />
animal proteins, the following is recommended: 237<br />
1. Create a community food security plan. Work closely with the private sector and<br />
<strong>Indiana</strong> University to outline a detailed plan for community food security, using this<br />
<strong>Report</strong> as guidance.<br />
2. The <strong>City</strong> should plant edible landscapes on public property. The <strong>City</strong> <strong>of</strong><br />
<strong>Bloomington</strong>’s Parks and Recreation Department already does a great job <strong>of</strong><br />
fostering a few community gardens and a burgeoning orchard through its<br />
Community Gardens initiative. The <strong>City</strong> should expand these efforts substantially<br />
and plant edible public<br />
landscapes along streets,<br />
in parks and surrounding<br />
public buildings,<br />
especially <strong>City</strong> Hall. For<br />
example, North Vancouver<br />
is considering a plan to<br />
create edible boulevards.<br />
The idea is to bring food<br />
production within social<br />
spaces.<br />
Under consideration: edible boulevards in North Vancouver. Source: Green Skin Labs<br />
3. Organize <strong>City</strong>led horticultural services to include organic waste collection,<br />
processing, and distribution.<br />
• Create a <strong>City</strong> nursery to supply edible perennials to the <strong>City</strong>’s Parks and<br />
Recreation and Street Departments;<br />
• Work to establish perennial food forests on public land by grafting and<br />
planting fruit and nut trees;<br />
• Institute an urban forestry and composting program to harvest the carbon<br />
flow through the city and compost it for growers. (e.g., cardboard, hair<br />
from salons, pre‐ and post‐consumer food waste, brush trimmings);<br />
• Promote home‐scale composting <strong>of</strong> kitchen wastes;<br />
• Create a <strong>City</strong> arboretum <strong>of</strong> economic species; and<br />
• Establish additional seed banking facilities in <strong>Bloomington</strong>.<br />
237 Based on the modified diet discussed above, this would comprise about 200 lbs./person <strong>of</strong> food—or about<br />
14 million pounds in the aggregate, per year.<br />
<strong>Report</strong> <strong>of</strong> the <strong>Bloomington</strong> <strong>Peak</strong> <strong>Oil</strong> <strong>Task</strong> <strong>Force</strong> 190
4. Expand water storage within the city to support agriculture.<br />
5. Subsidize the cost <strong>of</strong> materials and education for building a resilient<br />
infrastructure. To start, establish:<br />
• farm stands or agricultural parks in areas <strong>of</strong> greatest population<br />
density and activity;<br />
• food storage systems at schools; and<br />
• grants for neighborhood associations to be used for rainwater<br />
catchment tanks, root cellars, and neighborhood‐based food businesses<br />
6. Adopt a Food Security Resolution.<br />
The resolution should affirm that “Everyone has the right to adequate, healthful,<br />
nourishing food appropriate to their cultural and physical requirements.”<br />
7. Establish <strong>Bloomington</strong> as a Slow Food <strong>City</strong>.<br />
A Slow Food <strong>City</strong> supports local food production and processing that is good, clean,<br />
and fair and that aims to effect lasting change in the food system. 238 Locally‐grown<br />
food and locally‐based cuisine should be incorporated into the Lotus Festival and at<br />
least one other showcase event or location, preferably in connection with <strong>Indiana</strong><br />
University.<br />
8. Food security should figure prominently in the <strong>City</strong>’s new Sustainable <strong>City</strong><br />
Initiative.<br />
The <strong>City</strong> should use the Initiative’s website to anchor a web presence for<br />
information related to local food production, processing, and marketing. 239<br />
9. Through education and funding, work to increase food storage in <strong>Bloomington</strong><br />
household and community pantries to three months supply for all residents—<br />
about 18,000 tons aggregate.<br />
238 See further, Slow Food USA. http://slowfoodusa.org/index.php<br />
239 http://bloomington.in.gov/documents/viewDocument.php?document_id=2121<br />
<strong>Report</strong> <strong>of</strong> the <strong>Bloomington</strong> <strong>Peak</strong> <strong>Oil</strong> <strong>Task</strong> <strong>Force</strong> 191
10. Train and deploy 300 new urban garden farmers.<br />
Toward this end, the <strong>City</strong> should:<br />
• Intensify its practical food production arts classes via People’s University;<br />
• Work with Ivy Tech for vocational training in small‐scale organic farming;<br />
• Lend support to efforts at Monroe County School Corporation (MCCSC)<br />
schools to launch gardening programs;<br />
• Request Monroe County Public Library to increase its holdings <strong>of</strong> relevant<br />
literature and media; and<br />
• Work with the <strong>State</strong> <strong>of</strong> <strong>Indiana</strong> and other stakeholders to create specific<br />
forms <strong>of</strong> support for new farmers, including training, land access, low‐cost<br />
start‐up loans and property tax abatements or land rent <strong>of</strong>fsets.<br />
Volunteers harvesting at Banneker Community Garden<br />
<strong>Report</strong> <strong>of</strong> the <strong>Bloomington</strong> <strong>Peak</strong> <strong>Oil</strong> <strong>Task</strong> <strong>Force</strong> 192
11. Remove or reduce legal, institutional, and cultural barriers to farming within<br />
and around the city, and open institutional markets to local food.<br />
• Increase the number and scale <strong>of</strong> community garden plots;<br />
• Promote local food to Monroe County Community School Corporation,<br />
<strong>Bloomington</strong> Hospital, Ivy Tech, and IU;<br />
• Make solar access for passive energy capture and food production a limited<br />
right <strong>of</strong> all city homeowners; and<br />
• Amend the <strong>City</strong>’s Unified Development Ordinance (UDO).<br />
The <strong>City</strong> Council took an important step forward in fostering urban<br />
agriculture with its recent amendment to the UDO to allow community<br />
gardens and urban agriculture in residential zones <strong>of</strong> the city. Urban<br />
agriculture allows the growing <strong>of</strong> food crops through plant cultivation and<br />
includes such activities such as: gardens (front, back and/or side yard),<br />
edible landscapes, ro<strong>of</strong>top gardens, berry patches, and other activities. This<br />
amendment does not permit animal husbandry. The UDO should be further<br />
amended in the following ways:<br />
Urban gardening and community gardens should be permitted in all<br />
zones <strong>of</strong> the city, not just residential zones;<br />
At present, livestock are only permitted in Residential Estate [RE]<br />
zones <strong>of</strong> the city. Animal husbandry should be permitted in all<br />
residential zones and appropriate non‐residential zones. Residential<br />
zones might be limited to smaller animals such as chickens, goats,<br />
rabbits and bees while bigger lots should be permitted to harbor any<br />
livestock; and<br />
The only exception to the city‐wide prohibition against animal<br />
husbandry is the “chicken ordinance.” The ordinance allows residents<br />
in RE and RS zones to keep no more than five hens if all their adjacent<br />
neighbors waive the general prohibition against chickens in these<br />
zones. Furthermore, the ordinance requires a prospective chicken<br />
harborer obtain a permit and pay a fee. Permits are only good for one<br />
year and are conditioned upon an inspection by the <strong>City</strong>’s Animal Care<br />
and Control Department. Not only does this create significant hurdles<br />
for residents wishing to raise chickens, but it also creates a significant<br />
administrative burden for the <strong>City</strong>. As more and more residents turn<br />
to growing and raising their own food, the burden will only increase.<br />
The <strong>City</strong> should eliminate its protracted waiver, permitting, fee and<br />
inspection system and permit all citizens in residential zones to keep<br />
chickens. The enforcement <strong>of</strong> the provision should shift to a<br />
complaint‐based system where problems <strong>of</strong> noise, odor, and other<br />
nuisance are addressed only after they arise.<br />
<strong>Report</strong> <strong>of</strong> the <strong>Bloomington</strong> <strong>Peak</strong> <strong>Oil</strong> <strong>Task</strong> <strong>Force</strong> 193
12. The <strong>City</strong> and other stakeholders<br />
should work to establish foodbusiness<br />
incubator programs with<br />
access to community kitchens.<br />
13. The <strong>City</strong> should dedicate at least<br />
200 acres <strong>of</strong> public land to<br />
intensive gardening and farming<br />
within city limits and identify an<br />
additional 500 acres for future use.<br />
14. The <strong>City</strong> should work to increase the area available for yearround growing<br />
(covered or greenhouse space) to 200,000 square feet (just under 5 acres).<br />
The community should increase local food marketing and processing tenfold – from<br />
an estimated 12 percent <strong>of</strong> local consumption to between 1020 percent. Toward<br />
that end, the <strong>City</strong> should:<br />
15. Identify and zone appropriately a food processing and distribution hub in<br />
each <strong>of</strong> the city's 55 Natural Neighborhood districts (See Map D, p. 101).<br />
16. Permit transitional uses in these districts to bring these hubs into existence.<br />
For example, these hubs could be outdoors initially, then be covered and then<br />
eventually add indoor space. The hubs could begin with buying clubs, becoming<br />
neighborhood‐run food co‐ops that evolve to storefront commercial operations.<br />
17. Inventory commercialrated kitchens within the city and identify unused<br />
capacity.<br />
18. Launch at least one foodprocessing business incubator.<br />
19. Acquire and make available to local animal farmers at least two mobile<br />
abattoirs for safe and economic local processing <strong>of</strong> poultry and other meat<br />
animals.<br />
<strong>Report</strong> <strong>of</strong> the <strong>Bloomington</strong> <strong>Peak</strong> <strong>Oil</strong> <strong>Task</strong> <strong>Force</strong> 194
20. Work toward a yearround regional farmers’ market.<br />
Begin working to realize a regional farmers’ market/food hub that provides year‐<br />
round facilities for covered stall and indoor stall sales by local and regional<br />
producers. Such a market should provide adequate public access and facilities for<br />
receipt and processing <strong>of</strong> farm‐scale loads <strong>of</strong> produce, on a scale at least ten times<br />
larger than the present <strong>Bloomington</strong> Community Farmers’ Market in Showers<br />
Plaza. The regional market should include indoor market space and shop space for<br />
food brokerage, processing, and other related businesses.<br />
Farmer at the <strong>Bloomington</strong> Community Farmers’ Market<br />
In the interest <strong>of</strong> a regional market, the <strong>City</strong> and community partners should:<br />
Identify an appropriate location;<br />
Seek state support and other funding (private, county, charitable); and<br />
Consider creating a tax‐funding district to channel revenues.<br />
21. Map a strategy to harvest, compost or otherwise process and recycle to soil<br />
100 percent <strong>of</strong> the city's organic waste.<br />
22. In cooperation with other stakeholders, the <strong>City</strong> should work toward the<br />
establishment <strong>of</strong> a local land trust for the banking <strong>of</strong> farmland and the<br />
acquisition and holding <strong>of</strong> development rights to preserve open space for<br />
future farm development, and to coordinate a program <strong>of</strong> placing new farmers<br />
on such land.<br />
<strong>Report</strong> <strong>of</strong> the <strong>Bloomington</strong> <strong>Peak</strong> <strong>Oil</strong> <strong>Task</strong> <strong>Force</strong> 195
23. Reserve open land for agriculture and make additional land available for food<br />
production. Specifically the community should:<br />
• Inventory existing farmable land within the city, county, and region;<br />
• Ban suburban‐type development within the <strong>City</strong>'s corporate boundary;<br />
• Shift development focus to brownfield sites and increase density in areas<br />
with good services and transit (See Land Use chapter);<br />
• Re‐zone planned greenfield developments to include larger‐scale agriculture;<br />
• Provide incentives for households to establish mini farms where<br />
appropriate;<br />
• Support the establishment or direction <strong>of</strong> regional land trusts to hold<br />
farmland for long‐term lease and usufruct; and<br />
• Discourage the conversion <strong>of</strong> golf courses, sports fields, or other large tracts<br />
<strong>of</strong> open land to development. Instead, reserve them for future food<br />
production.<br />
<strong>Report</strong> <strong>of</strong> the <strong>Bloomington</strong> <strong>Peak</strong> <strong>Oil</strong> <strong>Task</strong> <strong>Force</strong> 196
MEDIUMTERM STRATEGIES (515 Years)<br />
1. Establish an agricultural park in every Natural Neighborhood district (Map D,<br />
p. 101 ) <strong>of</strong> the city with community gardens, yearround production under<br />
greenhouses, limited processing, and food storage facilities.<br />
2. Create a yearround food market for local produce and supplementary foods<br />
in every Natural Neighborhood district (Map D, p. 101)<br />
3. Provide 100 percent organic and local<br />
or regional food to students in the<br />
Monroe County Community School<br />
Corporation schools.<br />
4. Provide 50 percent local or regionallysourced<br />
food to institutional kitchens at<br />
IU, Ivy Tech, and <strong>Bloomington</strong> Hospital.<br />
5. Implement a community service<br />
requirement for all IU undergraduates<br />
with a significant fraction <strong>of</strong> this<br />
community service dedicated to local<br />
sustenance issues.<br />
6. Establish regionwide farm training<br />
programs at local institutions and train<br />
and deploy 10,000 new farmers in the<br />
region.<br />
Source: Daniel Orr<br />
7. Design and build five million square feet <strong>of</strong> greenhouse space for year round<br />
growing <strong>of</strong> integrated aquaponics.<br />
8. Establish or expand local creamery and livestock butchering facilities.<br />
9. Create a local, publiclycontrolled seedbank and arboretum <strong>of</strong> food and useful<br />
plant species for propagation and sale within the region.<br />
10. Inventory, document, and disseminate information to the public about the<br />
local flora and fauna <strong>of</strong> the <strong>Bloomington</strong> region, including native and adapted<br />
species, economic crops, other useful plants, and socalled "weed" species, as<br />
well as their ecological relationships.<br />
<strong>Report</strong> <strong>of</strong> the <strong>Bloomington</strong> <strong>Peak</strong> <strong>Oil</strong> <strong>Task</strong> <strong>Force</strong> 197
11. Establish a credible local financing facility for the acquisition and<br />
development <strong>of</strong> farmland into small (0.5 to 20 acres), intensive integrated<br />
polyculture farmsteads.<br />
12. Encourage the IU Kelley School <strong>of</strong> Business to <strong>of</strong>fer at least a graduate degree<br />
in local business design and the School <strong>of</strong> Public and Environmental Affairs to<br />
<strong>of</strong>fer a degree in applied environmental design.<br />
13. Work with Monroe County to identify agriculturallysuitable, publiclyowned<br />
parcels within and near the city to be zoned and brought into use as small<br />
farm allotments.<br />
LONGTERM STRATEGIES (1530 Years)<br />
1. Bank at least 100,000 acres within the sevencounty region for smallfarm<br />
leaseholds (in usufruct).<br />
2. Train and deploy 50,000 additional farmers in the area.<br />
3. Create 50,000 new jobs in food, fiber, and organic goods processing and<br />
related services within the region.<br />
4. Realize the goal <strong>of</strong> being able to feed all 120,000+ people in Monroe County<br />
primarily from the resources <strong>of</strong> the region (at 2 acres per person).<br />
5. Extend the local food production system to other central and southern <strong>Indiana</strong><br />
communities within our region and support the expansion <strong>of</strong> similar systems<br />
within the state and the Midwest.<br />
<strong>Report</strong> <strong>of</strong> the <strong>Bloomington</strong> <strong>Peak</strong> <strong>Oil</strong> <strong>Task</strong> <strong>Force</strong> 198
WATER: A HOUSEHOLDER’S PERPECTIVE<br />
Water is an essential element <strong>of</strong> life’s sustenance—one we take almost entirely for granted.<br />
At present, just about all our water is provided by a highly‐centralized, fossil fuel‐driven<br />
system. By any standard our public water supply is a miracle <strong>of</strong> civic order and technical<br />
prowess. However, water’s centrality to life, health and the economy makes it especially<br />
vulnerable to a decline in cheap oil.<br />
The chapter on Municipal Services has covered much <strong>of</strong> the technical material related to the<br />
<strong>City</strong> <strong>of</strong> <strong>Bloomington</strong>'s Utility Department operations and vulnerabilities. Here, we look at<br />
the water situation from the perspective <strong>of</strong> households and local food production to see<br />
how the present centralized water system can be supplemented and the community made<br />
more water‐secure.<br />
MITIGATION GOALS & STRATEGIES<br />
There is much that households can do to help foster water security. Water security is<br />
shaped by combined supply‐ and demand‐side management. As urban agriculture<br />
increases, demand for water will also rise; however, much <strong>of</strong> this need could be met by a<br />
concerted program <strong>of</strong> rainwater and ro<strong>of</strong>water collection.<br />
At present, <strong>Bloomington</strong> households consume about 85 gallons <strong>of</strong> water per person per<br />
day. Without compromising essential services, this rate <strong>of</strong> consumption could be reduced<br />
by more than 90% by making relatively simple changes. These changes include structural<br />
ones, such as new plumbing devices and appliances, and behavioral ones. Such demand‐<br />
side changes are by far the cheapest way to foster water security.<br />
<strong>Report</strong> <strong>of</strong> the <strong>Bloomington</strong> <strong>Peak</strong> <strong>Oil</strong> <strong>Task</strong> <strong>Force</strong> 199
Households can contribute significantly to improved water management<br />
and water security. The average non‐conserving North American single‐<br />
family household consumes about 70 gallons/capita/day (gpcd) for<br />
indoor uses, and an additional 30 gpcd for outdoor uses. Of the 70 gallons used indoors,<br />
27% go to flush toilets, 18.5% are used in showers and baths, 16% flow through faucets<br />
and 22% supply washing machines, while 14% are lost to leaks. 240<br />
1. Flush smart.<br />
A program <strong>of</strong> conservation by improved plumbing fixtures has been estimated to reduce<br />
indoor water use by 40% to approximately 42 gpcd. The main source <strong>of</strong> water savings is a<br />
reduction in water used to flush toilets (over 10 gpcd), based on the installation <strong>of</strong> 1.6<br />
gallon/flush units (even more efficient toilets are available today). However, significant<br />
savings are also available through the use <strong>of</strong> low‐flow shower and faucet fixtures and from<br />
water‐efficient laundry and dishwashing machines.<br />
2. Behavioral changes.<br />
Some simple and easy‐to‐implement behavioral changes at the household level can<br />
substantially reduce water use:<br />
• Not rinsing dishes before loading them in a dishwasher can save up to 10 gallons<br />
per load, while for hand washing <strong>of</strong> dishes the use <strong>of</strong> dishpans can save half the<br />
water needed over washing under a running tap;<br />
• Toothbrushing or shaving in front <strong>of</strong> a running tap can waste up to 200 gallons per<br />
month <strong>of</strong> water;<br />
• Keeping a pitcher <strong>of</strong> water in the refrigerator provides cold water on demand<br />
without running the tap until the stream is cool;<br />
• The initial gallons <strong>of</strong> cold water discharged when running a bath or starting a<br />
shower can be collected in a bucket for flushing the toilet;<br />
• Using a stop‐valve on the showerhead when soaping and scrubbing<br />
conserves dozens <strong>of</strong> gallons <strong>of</strong> hot water with measurable cost savings;<br />
240 Christopher Kloss, Managing Wet Weather with Green Infrastructure: Municipal Handbook – Rainwater<br />
Harvesting Policies, EPA-833-F-08-010 (December 2008).<br />
<strong>Report</strong> <strong>of</strong> the <strong>Bloomington</strong> <strong>Peak</strong> <strong>Oil</strong> <strong>Task</strong> <strong>Force</strong> 200
• Running laundry machines and dishwashers at full capacity instead <strong>of</strong> doing small<br />
loads saves water on every load; and<br />
• Used bathwater can be "re‐used" for hand laundry, and dishwater (held in dishpans)<br />
is more than suitable for flushing toilets.<br />
All told, it is possible to bring household water use down to under 10 gallons per capita per<br />
day without reducing sanitation or compromising any essential services.<br />
3. New fixtures<br />
New fixtures improve water use efficiency, providing the same services at<br />
lower water cost. Repairs to leaks and changes in behavior—learning the<br />
household water cascade and its economies—conserves water that would<br />
otherwise be wasted. In a city with many rental units there are unfortunately conflicting<br />
incentives around reducing water use. Most multi‐unit buildings provide water as a service<br />
<strong>of</strong> rent, so tenants have no economic incentive to conserve. Conversely, in rented single‐<br />
family housing, old fixtures may waste water paid for by the tenant, while replacement <strong>of</strong><br />
these is a cost the landlord may seek to avoid. The same problems apply, with even more<br />
acute energy impacts, to heating and cooling equipment, insulation, etc. The incentives<br />
align, however, for owner‐occupied houses. It is recognized that water use increases with<br />
affluence, with (ironically) aridity <strong>of</strong> climate, and in older housing stock (because <strong>of</strong> leaks,<br />
older plumbing fixtures and appliances).<br />
<strong>Report</strong> <strong>of</strong> the <strong>Bloomington</strong> <strong>Peak</strong> <strong>Oil</strong> <strong>Task</strong> <strong>Force</strong> 201
4. Collect rainwater<br />
In addition to measures <strong>of</strong> conservation and efficiency at the<br />
household level, it is possible to increase water supply<br />
available for outdoor and non‐potable indoor water use by<br />
collecting rainwater from ro<strong>of</strong>s and other run<strong>of</strong>f. The use <strong>of</strong><br />
rain barrels is becoming widespread, while in some areas<br />
where water supply is already critical (such as Austin, Texas),<br />
the construction and use <strong>of</strong> household cisterns is<br />
commonplace today as it was a century ago in southern<br />
<strong>Indiana</strong>. An expected increase in urban gardening and farming<br />
with a consequent need for more irrigation water in summer gives focus and purpose to a<br />
community‐wide program <strong>of</strong> rainwater catchment.<br />
Source: U.S. EPA. A rain barrel used<br />
to collect ro<strong>of</strong>top run<strong>of</strong>f using a<br />
gutter/downspout system.<br />
<strong>Report</strong> <strong>of</strong> the <strong>Bloomington</strong> <strong>Peak</strong> <strong>Oil</strong> <strong>Task</strong> <strong>Force</strong> 202
WASTE: THE PERSPECTIVE OF LOCAL FOOD<br />
PRODUCTION<br />
The <strong>City</strong> collects mixed household waste and yard waste from residents. County residents<br />
take bagged, mixed household waste to transfer stations. As discussed in the Municipal<br />
Services chapter, there is no local landfill. All community mixed waste is trucked 55 miles<br />
away to Vigo County. Yard waste and leaves collected by the <strong>City</strong> are disposed in one <strong>of</strong> two<br />
ways: 1) the waste is taken to a private company which the <strong>City</strong> pays to dump the<br />
trimmings (the company turns the trimming into mulch and sells the mulch on the open<br />
market); 2) the leaves are deposited at a decommissioned wastewater plant contaminated<br />
by PCBs. Liquid waste is delivered via underground pipes to centralized plants which use<br />
aerobic methods <strong>of</strong> treatment and chemicals for finishing. No methane is captured in this<br />
energy‐intensive process.<br />
VULNERABILITIES<br />
The practice <strong>of</strong> shipping our trash a considerable distance is certainly vulnerable to a<br />
decline in cheap oil. So too is the <strong>City</strong>’s centralized waste treatment plant. Sewage<br />
treatment – like water treatment – is highly reliant on a series <strong>of</strong> electric pumps and is<br />
subject to disruptions <strong>of</strong> the electrical grid.<br />
However, while these waste streams are a source <strong>of</strong> vulnerability, they also represent<br />
potential resources for local food production. We throw away a lot <strong>of</strong> organic material that<br />
we should be using to fertilize our gardens. Yard trimmings and food residuals constitute<br />
approximately 24 percent <strong>of</strong> our waste stream. 241 The building <strong>of</strong> a local food system<br />
requires that we redirect local organic nutrients from the landfill to the garden through<br />
composting, chip‐and‐mulch, and other appropriate processes. In addition to tree and<br />
shrub trimmings, grass clippings and collected yard waste, a great deal <strong>of</strong> the community’s<br />
solid waste consists <strong>of</strong> organic and compostable materials such as food waste, boxboard,<br />
241 US Environmental Protection Agency. Wastes Resource Conservation Reduce, Reuse, Recycle –<br />
Composting. http://www.epa.gov/waste/conserve/rrr/composting/basic.htm<br />
<strong>Report</strong> <strong>of</strong> the <strong>Bloomington</strong> <strong>Peak</strong> <strong>Oil</strong> <strong>Task</strong> <strong>Force</strong> 203
and paper. Sources include households, restaurants, and institutional food servers. Hair<br />
trimmings from salons and barbershops, stable waste, and cardboard cartons are also<br />
available. Because it already collects a large fraction <strong>of</strong> the community's organic waste<br />
materials, the <strong>City</strong> is in the best position to organize the large‐scale chipping and<br />
composting <strong>of</strong> this material to supply soil nutrients to urban farmers and gardeners.<br />
MITIGATION GOALS & STRATEGIES<br />
In the long‐term, the only way<br />
to mitigate the costs and<br />
vulnerabilities presented to our<br />
current waste system is to<br />
capture and divert the organic<br />
fraction <strong>of</strong> <strong>Bloomington</strong>'s<br />
present waste stream to supply<br />
fertilizer for the local food<br />
system.<br />
SHORT TERM (15 Years)<br />
Yard waste and food scraps are rich sources <strong>of</strong> soil nutrients when composted.<br />
Source: Wikimedia Commons<br />
1. Establish a centralized composting system for largevolume processing. This<br />
can be the initiative <strong>of</strong> the <strong>City</strong>, the Solid Waste Management District, <strong>Indiana</strong><br />
University, or a private entity.<br />
2. Create a "compost corner" in each <strong>of</strong> the 55 Natural Neighborhoods where<br />
smallerscale composting could go on to supply the community gardens and<br />
home. (See Map D, p. 101).<br />
3. Encourage home composting to divert residential organic waste.<br />
4. Encourage organic source separation by city residents; reequip the Sanitation<br />
Department's fleet and/or restructure collections to handle this stream.<br />
5. Work with commercial kitchens, groceries, and institutional food servers to<br />
harvest food wastes to supply the compost operation, balancing this nitrogenrich<br />
source with "brown" material in the form <strong>of</strong> dead plant matter and<br />
shredded paper and cardboard.<br />
<strong>Report</strong> <strong>of</strong> the <strong>Bloomington</strong> <strong>Peak</strong> <strong>Oil</strong> <strong>Task</strong> <strong>Force</strong> 204
MEDIUM TERM (515 Years)<br />
1. Consider mandating source separation <strong>of</strong> organics from commercial and<br />
institutional sources.<br />
2. Add in nonfood organic waste sources as the capacity for materials handling<br />
is built.<br />
<strong>Report</strong> <strong>of</strong> the <strong>Bloomington</strong> <strong>Peak</strong> <strong>Oil</strong> <strong>Task</strong> <strong>Force</strong> 205
HEALTH CARE<br />
The implications <strong>of</strong> peak oil for health care is a topic <strong>of</strong> increasing discussion, not only<br />
among self‐organized community groups, but also among and between mainstream health<br />
care organizations, such as the American Medical Association and Johns Hopkins. 242<br />
Marion County, <strong>Indiana</strong> has one <strong>of</strong> the first county health departments to initiate a task<br />
force devoted to examining the implications <strong>of</strong> peak oil for public health. 243<br />
Observers generally point out that peak oil will affect our current health care system in at<br />
least four ways. Writing in the Journal <strong>of</strong> the American Medical Association, Dr. Howard<br />
Frumkin <strong>of</strong> the Centers for Disease Control and co‐authors suggest that oil scarcity will<br />
affect health care through effects on: 1) medical supplies and equipment,<br />
2) transportation, 3) energy generation, and 4) food production. 244 Many medications such<br />
as aspirin and antibiotics are made from petroleum derivates, and many medical supplies<br />
(such as bandages, prosthetics, syringes, tubing, etc) contain oil‐derived plastics. Similarly,<br />
the current health care system is highly reliant on oil for transport: ambulances, organ<br />
transport, workers travelling to work, patients travelling to appointments, and the<br />
movement <strong>of</strong> medical equipment. Lastly, as current food production is so dependent on<br />
petroleum for its production, processing and transport, any reduction in affordable, healthy<br />
food has implications for community health.<br />
While we have worked to address ways to shift our food production away from petroleum<br />
reliance, early on the <strong>Task</strong> <strong>Force</strong> agreed that a protracted examination <strong>of</strong> the implications<br />
<strong>of</strong> peak oil for local health care was largely beyond the purview <strong>of</strong> the group. However, the<br />
subject is addressed here in the interest <strong>of</strong> highlighting the implications <strong>of</strong> peak oil and<br />
health care on a local level. We hope that local health providers and stakeholders will<br />
examine this more closely.<br />
242 <strong>Peak</strong> oil has been identified as a topic for mitigation by the Johns Hopkins Public Health Preparedness Programs. In<br />
March 12, 2009, Johns Hopkins hosted a <strong>Peak</strong> <strong>Oil</strong> and Health Conference<br />
http://www.jhsph.edu/preparedness/Images/<strong>Peak</strong><strong>Oil</strong>FinalAgenda.pdf<br />
243 Mary McKee, A Local Health Department Plans for <strong>Peak</strong> <strong>Oil</strong>. Paper presented at: 134th Annual Meeting <strong>of</strong> the American<br />
Public Health Association; November 6, 2006; Boston, MA. http://peakoilmedicine.com/2006/11/12/how‐local‐health‐<br />
care‐authorities‐can‐prepare‐for‐peak‐oil/<br />
244 Frumkin, Howard; Jeremy Hess; Stephen Vindigni, “<strong>Peak</strong> Petroleum and Public Health” Journal <strong>of</strong> the American Medical<br />
Association 298, no 14 (2007): 1688‐1690.<br />
<strong>Report</strong> <strong>of</strong> the <strong>Bloomington</strong> <strong>Peak</strong> <strong>Oil</strong> <strong>Task</strong> <strong>Force</strong> 206
VULNERABILITIES<br />
Until now, health care in the United <strong>State</strong>s has been primarily a private concern that has<br />
evolved in an era <strong>of</strong> cheap energy. It has been predicated on the<br />
assumption that specialized equipment and teams <strong>of</strong> highly‐skilled<br />
pr<strong>of</strong>essionals are the critical elements in health care. While this model<br />
<strong>of</strong> health‐care delivery is superb at dealing with trauma, it is less well‐<br />
suited to dealing with the environmentally‐induced or diet‐based<br />
degenerative illnesses that have become so common.<br />
Medical care in the U.S. today is among the most energy‐dependent sectors <strong>of</strong> the economy.<br />
Costs are spiraling out <strong>of</strong> control and have contributed significantly to the nation's<br />
economic dilemmas. High cost care is not necessarily high quality care. The World Health<br />
Organization ranks the U.S. 37 th among nations in quality <strong>of</strong> health care. 245 Already<br />
excessively dependent on emergency interventions at high cost, the system is likely to lurch<br />
further toward poor care as energy‐based economic contraction leads people to avoid<br />
timely and preventive care. A rise in the number <strong>of</strong> uninsured people poses potential<br />
financial burdens. Of course, rising energy costs and shortages <strong>of</strong> energy‐intensive supplies,<br />
plus fuel cost and supply problems related to patient and employee access to services<br />
threaten to push the system out <strong>of</strong> control.<br />
<strong>Bloomington</strong> Hospital is a major employer <strong>of</strong> people from throughout the region and serves<br />
10 <strong>Indiana</strong> counties. The hospital is situated in <strong>Bloomington</strong>’s downtown and is served by<br />
<strong>Bloomington</strong> Transit (BT). The hospital has recently merged with a large <strong>Indiana</strong>polis‐<br />
based group <strong>of</strong> hospitals and has plans to relocate outside <strong>of</strong> the <strong>City</strong>'s corporate boundary<br />
– ostensibly to better serve the wider region by emphasizing ease <strong>of</strong> commuting by<br />
highway. BT is limited to operations within the <strong>City</strong>’s corporate limits. If the hospital were<br />
to relocate out <strong>of</strong> the city center it would make services less accessible to those unable to<br />
drive, a portion <strong>of</strong> the public certain to rise substantially over the next decade.<br />
Source: Wikimedia Commons<br />
245<br />
WHO World Health <strong>Report</strong> 2000 Health Systems, Improving Performance,<br />
http://www.who.int/whr/2000/en/index.html; http://www.photius.com/rankings/healthranks.html<br />
The United <strong>State</strong>s was ranked behind nations like San Marino, Andorra, Malta, Singapore, Oman, Iceland, Luxembourg,<br />
Netherlands, Colombia, Saudi Arabia, United Arab Emirates, Chile, Dominica, Morocco, Cyprus, and Costa Rica.<br />
<strong>Report</strong> <strong>of</strong> the <strong>Bloomington</strong> <strong>Peak</strong> <strong>Oil</strong> <strong>Task</strong> <strong>Force</strong> 207
MITIGATION GOALS & STRATEGIES:<br />
REIMAGINING CARE<br />
While the <strong>City</strong> has little direct influence over the health care <strong>of</strong> its citizens, it can support a<br />
new way <strong>of</strong> thinking about health that may make our increasingly‐scarce health dollars<br />
stretch further and may help a vulnerable medical establishment transition to an era <strong>of</strong><br />
lower energy resources. Our present medical model is so dependent on oil in part because<br />
it focuses on intervention rather than prevention. Beyond just working to substitute<br />
materials for the medical supplies that are so petroleum dependent, we need a new model<br />
<strong>of</strong> taking care <strong>of</strong> ourselves and each other.<br />
<strong>Peak</strong> oil presents us with an opportunity to do things better. We will need to re‐conceive<br />
our present notion <strong>of</strong> personal responsibility away from paying for one's own insurance<br />
and medical care to better measures <strong>of</strong> personal care beginning with diet and family health.<br />
It is instructive to re‐imagine our system <strong>of</strong> care as a series <strong>of</strong> concentric zones, wherein<br />
the most frequented systems <strong>of</strong> care are at the core, and the less‐frequented but still<br />
necessary components <strong>of</strong> the system are more distant.<br />
The Core: Individual and Family<br />
Conceiving health care as existing in a set <strong>of</strong> concentric zones, the individual and the family<br />
are properly the center <strong>of</strong> the health‐care system. The most effective care consists <strong>of</strong><br />
personal and household practices that are healthy, including: proper nutrition, exercise,<br />
reduction <strong>of</strong> stress, contact with nature, and avoidance <strong>of</strong> environmental toxins. Both<br />
government and the medical establishment would better serve public health by educating<br />
and regulating with these aims in mind. Health is really only possible when this layer is<br />
vigorous, well‐informed and supported by public policy and cultural expectations.<br />
<strong>Report</strong> <strong>of</strong> the <strong>Bloomington</strong> <strong>Peak</strong> <strong>Oil</strong> <strong>Task</strong> <strong>Force</strong> 208
The Second Layer: Community Support and Complementary Modalities<br />
The next layer <strong>of</strong> care in a restructured system would consist <strong>of</strong> mutual support from<br />
community members and what are sometimes called complementary or alternative<br />
modalities. These modalities <strong>of</strong>fer non‐invasive, accessible, and lower‐cost care for a wide<br />
variety <strong>of</strong> conditions. Many millions <strong>of</strong> Americans already use these methods and systems,<br />
but they exist mostly outside the formal structure <strong>of</strong> insurance, hospitals, and recognized<br />
medicine. Perhaps more significantly,<br />
we exist in a matrix <strong>of</strong> social<br />
and environmental<br />
relations. The stronger<br />
and more connected<br />
the community is,<br />
the more easily<br />
individuals can<br />
maintain their own<br />
health.<br />
The Third Layer:<br />
Decentralized Delivery<br />
Systems<br />
A third layer <strong>of</strong> health care<br />
provision ‐‐ one that is largely absent from<br />
Palliative, Nursing or<br />
Maintenance Care<br />
Pr<strong>of</strong>essional Care<br />
Pr<strong>of</strong>essional Care – Decentralized<br />
Community Support &<br />
Complementary Modalities<br />
Individual & Family<br />
the U.S. system but which is present in countries such as France and Cuba ‐‐ is local<br />
provision <strong>of</strong> formal medical services. The nationalized French health service provides home<br />
visits by physicians to patients as needed, while in Cuba, doctors’ <strong>of</strong>fices are located in<br />
every neighborhood. As transportation becomes more costly, it will be necessary to<br />
decentralize care and move services down the scale <strong>of</strong> energy intensity. Besides<br />
physicians' <strong>of</strong>fices, these facilities might include smaller health clinics for outpatient<br />
services.<br />
<strong>Report</strong> <strong>of</strong> the <strong>Bloomington</strong> <strong>Peak</strong> <strong>Oil</strong> <strong>Task</strong> <strong>Force</strong> 209
The Fourth Layer: Pr<strong>of</strong>essional Care in Centralized Locations<br />
The fourth layer <strong>of</strong> care in a restructured system would consist <strong>of</strong> what is <strong>of</strong>ten the first line<br />
<strong>of</strong> medical attention today: the provision <strong>of</strong> services by pr<strong>of</strong>essionals in a centralized<br />
hospital or clinic. Hospitals will need to revise their equipment and organization to<br />
respond to shortages <strong>of</strong> disposable supplies and pharmaceuticals (which derive from oil),<br />
the inability <strong>of</strong> employees to commute as frequently, or as far, and even to the possibility <strong>of</strong><br />
regular power interruptions.<br />
The Fifth Layer: Palliative, Nursing & Maintenance Care<br />
A fifth layer <strong>of</strong> care, which exists today primarily in the hospice setting, would be an<br />
expansion <strong>of</strong> palliative, nursing, or maintenance care for those individuals at the end <strong>of</strong> life<br />
or whose conditions are either not responsive to medical intervention, or for whom the<br />
choice <strong>of</strong> medical manipulation is unwelcome. It's quite within the realm <strong>of</strong> imagination<br />
that proper medical care, even for patients whose conditions can heal, might lie in<br />
providing supportive care and guidance outside either home or hospital, as in a spa or<br />
sanitorium, where time and retraining in new personal health practices could result in the<br />
reversal or remission <strong>of</strong> illness. 246<br />
Some elements <strong>of</strong> this layered care system exist today, though arguably the first and most<br />
important <strong>of</strong> these is the weakest, and is under constant assault by commercial interests. A<br />
layered approach to health is most effective when all the elements in it are integrated and<br />
mutually reinforcing. Regrettably, the current medical model is poorly equipped to suture<br />
the layers <strong>of</strong> health together as conceived above. As citizens, as consumers <strong>of</strong> medical<br />
services, and as individuals and families concerned with our own well‐being, we will have<br />
to demand more holistic thinking from everyone about the sources and pathways to health.<br />
With costs lowered by structural reorganization and new thinking, it might be possible to<br />
implement community scale health coverage for all, regardless <strong>of</strong> what does or does not<br />
come about from federal action.<br />
246 Thanks to Dr. Jifunza Wright, M.D. <strong>of</strong> Chicago, Illinois for suggestions contributing to the new model <strong>of</strong><br />
care.<br />
<strong>Report</strong> <strong>of</strong> the <strong>Bloomington</strong> <strong>Peak</strong> <strong>Oil</strong> <strong>Task</strong> <strong>Force</strong> 210
The aim <strong>of</strong> a healthy post‐peak <strong>Bloomington</strong> should be to:<br />
• Create a resilient health care system which provides care that is more affordable<br />
and which minimizes the need for energy‐intensive interventions and support<br />
systems;<br />
• Increase the flexibility and range <strong>of</strong> responses available to local health care<br />
providers; and<br />
• Support a concentration <strong>of</strong> essential medical services to remain in the central city<br />
location accessible by public transit and pedestrians.<br />
MITIGATION GOALS & STRATEGIES<br />
This discussion is <strong>of</strong>fered as guidance and direction for policy and public discussion. Few <strong>of</strong><br />
these recommendations involve action steps for <strong>City</strong> government.<br />
1. Expand and support alternative health care options as set out above.<br />
2. Create a mobile medical corps: for both house calls and disaster responses.<br />
3. Encourage more nurse practitioners: they can perform many <strong>of</strong> the same<br />
procedures as a doctor, but their training is less expensive and timeconsuming.<br />
Offices could be sited in more neighborhoods.<br />
4. Consider how to create communitylevel health insurance to include a wide<br />
range <strong>of</strong> therapeutic modalities.<br />
5. <strong>Bloomington</strong> will still need a hospital.<br />
a) Maintain the present downtown location <strong>of</strong> <strong>Bloomington</strong> Hospital;<br />
b) Build dormitory facilities for shortterm use by hospital employees to<br />
mitigate against transportation problems;<br />
c) Expand the reuse <strong>of</strong> medical equipment, where appropriate and<br />
protective <strong>of</strong> health: reinstate the use <strong>of</strong> autoclave equipment; 247 and<br />
d) Prepare to manage intermittent power outages.<br />
• Increase onsite fuel storage and<br />
• Provide employee training in lowenergy diagnoses needing only<br />
lowtech tools and materials.<br />
247 Equipment used to sterilize equipment at high temperatures.<br />
<strong>Report</strong> <strong>of</strong> the <strong>Bloomington</strong> <strong>Peak</strong> <strong>Oil</strong> <strong>Task</strong> <strong>Force</strong> 211
Opportunities for Citizen Action:<br />
What can YOU do?<br />
“Find your place on the planet. Dig in, and take responsibility from there.”<br />
– Gary Snyder<br />
<strong>Peak</strong> oil is both a personal and collective call to action. It is an opportunity to find out what<br />
we can do when we apply our collective adaptability and creativity. While most <strong>of</strong> this<br />
<strong>Report</strong> focuses on what institutional actors can do to mitigate the effects <strong>of</strong> peak oil, there<br />
are many things we can all do to reduce our reliance on petroleum. These changes will be<br />
good for our community, the local economy, the environment and our own pocketbooks.<br />
Learn<br />
Learn more about peak oil. The Further Reading references at the end <strong>of</strong> this <strong>Report</strong> might<br />
be a good place to start. Share what you learn with others.<br />
Drive Less<br />
• Carpool, walk, ride your bike, or take the bus.<br />
• Telecommute if possible.<br />
• Ask your employer to consider a four‐day work week.<br />
• Move closer to work or work closer to home, if possible.<br />
• If you own any vehicle that gets less than 20 miles per gallon, it is time to trade it for<br />
a far more economical means <strong>of</strong> transportation.<br />
• If you must use your personal automobile or truck, don’t travel during peak traffic<br />
periods, consolidate your trips to reduce fuel consumption, drive slower, and make<br />
sure your tires are properly inflated.<br />
• Campaign for dramatic increases in funding for public transportation.<br />
<strong>Report</strong> <strong>of</strong> the <strong>Bloomington</strong> <strong>Peak</strong> <strong>Oil</strong> <strong>Task</strong> <strong>Force</strong> 212
“Power Down” at Home<br />
Electricity<br />
Simple changes at home can make a big difference. Residents can reduce energy costs by<br />
10‐50% by implementing relatively simple measures such as the following: 248<br />
• Adjust your thermostat. For every degree that you lower your heat in<br />
the 60‐70º range, you can save up to 5 percent on heating costs in the<br />
winter. Similar savings can be achieved by raising your thermostat by a<br />
few degrees in the summer.<br />
• Lower your hot water temperature. Set your water heater to the<br />
"normal" or 120º setting.<br />
• Replace or clean furnace filters once a month. Dirty filters restrict<br />
airflow and increase energy use. Keeping your furnace clean, lubricated,<br />
and properly adjusted can reduce heating costs by as much as 5 percent.<br />
• Insulate your water pipes. Insulating the first five feet <strong>of</strong> pipe coming<br />
out <strong>of</strong> the top <strong>of</strong> your water heater can save considerable energy. Pipe<br />
insulation is available from your hardware store.<br />
• Seal air leaks. Caulk leaks around windows and doors. Look for places<br />
where you have pipes, vents or electrical conduits that go through the<br />
wall, ceiling, or floor. Check the bathroom, underneath the kitchen sink,<br />
pipes inside a closet, etc. If you find a gap at the point where the pipe or<br />
vents goes through the wall, seal it up. Caulk works best on small gaps.<br />
Your hardware store should have products to close the larger gaps.<br />
• Consider replacing your old gas appliances. If your gas water heater<br />
is over 12 years old, consider replacing it with a newer, more efficient<br />
ENERGY STAR model. The best indicator <strong>of</strong> a water heater's efficiency is<br />
the Energy Factor (EF). The higher the EF, the more efficient the water<br />
heater. If your furnace is over 15 years old, consider replacing it with an<br />
ENERGY STAR rated model that is at least 15 percent more efficient than<br />
standard models.<br />
• Wash clothes in cold water.<br />
• Air dry dishes instead <strong>of</strong> using your dishwasher's drying cycle.<br />
• Air dry your clothes. Put up a clothesline.<br />
• Turn <strong>of</strong>f your computer, monitor and other appliances when not in<br />
use.<br />
248 Parts <strong>of</strong> this list are borrowed from: <strong>Bloomington</strong> Environmental Quality Indicators <strong>Report</strong> (BEQI <strong>Report</strong>)<br />
EnergySaving Tips. http://bloomington.in.gov/documents/viewDocument.php?document_id=2987<br />
<strong>Report</strong> <strong>of</strong> the <strong>Bloomington</strong> <strong>Peak</strong> <strong>Oil</strong> <strong>Task</strong> <strong>Force</strong> 213
• Use power strips for your home electronics, such as TVs and DVD<br />
players, being sure to turn them <strong>of</strong>f when the equipment is not in use<br />
(TVs and DVDs in standby mode still use several watts <strong>of</strong> power).<br />
• Buy ENERGY STAR home appliances and products. ENERGY STAR<br />
products meet strict efficiency guidelines set by the U.S. Environmental<br />
Protection Agency and the U.S. Department <strong>of</strong> Energy.<br />
• Use compact fluorescent light bulbs. Changing your light bulbs to<br />
compact fluorescents will reduce your electric bill. A single 100‐watt<br />
bulb replaced with a 25‐watt screw‐in compact fluorescent can save you<br />
as much as $75 on your power bill over the life <strong>of</strong> that bulb.<br />
Water<br />
It is possible to bring household water use down to under 10 gallons per capita per day<br />
without reducing sanitation or compromising any essential services.<br />
• Flush Smart. Most flush toilets use over 10gpcd. Low flow toilets are 1.6<br />
gallon/flush units which are estimated to reduce indoor water use by 40% to<br />
approximately 42 gpcd.<br />
• Take short showers.<br />
• Don’t rise dishes before loading them. Not rinsing dishes before loading them in a<br />
dishwasher can save up to 10 gallons per load, while for hand washing <strong>of</strong> dishes the<br />
use <strong>of</strong> dishpans can save half the water needed over washing under a running tap.<br />
• Turn tap <strong>of</strong>f while you brush and shave. Toothbrushing or shaving in front <strong>of</strong> a<br />
running tap can waste up to 200 gallons per month <strong>of</strong> water.<br />
• Keep a pitcher <strong>of</strong> cold water in the refrigerator. This provides cold water on<br />
demand without running the tap until the stream is cool.<br />
• Recycle your bath water. The initial gallons <strong>of</strong> cold water discharged when<br />
running a bath or starting a shower can be collected in a bucket for flushing the<br />
toilet. Used bathwater can be "re‐used" for hand laundry. Dishwater (held in<br />
dishpans) is more than suitable for flushing toilets.<br />
• Install a stopvalve on the showerhead. Using such a valve when soaping and<br />
scrubbing conserves dozens <strong>of</strong> gallons <strong>of</strong> hot water with measurable cost savings.<br />
• Wash only full loads <strong>of</strong> dishes and clothes. Running laundry machines and<br />
dishwashers at full capacity instead <strong>of</strong> doing small loads saves water on every load.<br />
• Install new fixtures. New fixtures improve water use efficiency and providing the<br />
same services at a lower water cost.<br />
• Collect rainwater. It is possible to increase water supply available for outdoor and<br />
non‐potable indoor water use by collecting rainwater from ro<strong>of</strong>s and other run<strong>of</strong>f.<br />
<strong>Report</strong> <strong>of</strong> the <strong>Bloomington</strong> <strong>Peak</strong> <strong>Oil</strong> <strong>Task</strong> <strong>Force</strong> 214
Make efficiency improvements<br />
The following sites provide guidance for making your home more energy efficient.<br />
• Building America: Related Links for Homeowners<br />
This site provides links to information regarding energyefficient houses, resources<br />
from the US Department <strong>of</strong> Energy, and other websites.<br />
http://www1.eere.energy.gov/buildings/building_america/homeowners.html<br />
• Renewable Energy Policy Project: Efficiency<br />
A source <strong>of</strong> information regarding a number <strong>of</strong> energy efficiency issues, such as<br />
lowering monthly utility bills and suggestions for improving energy efficiency around<br />
the house. http://www.repp.org/efficiency/index.html<br />
Explore alternative power<br />
Only after you’ve worked to conserve as much energy as you can, does it make sense to<br />
explore alternative power. Since solar panels are still expensive, it doesn’t make sense to<br />
pay for the purchase and installation <strong>of</strong> panels that will produce energy simply to be<br />
wasted. <strong>Bloomington</strong> is fortunate to have available a community organization, Southern<br />
<strong>Indiana</strong> Renewable Energy Network (SIREN), whose mission is to educate citizens about<br />
renewable energy and assist in renewable energy projects. 249 Below are a few places to<br />
start your exploration:<br />
• Southern <strong>Indiana</strong> Renewable Energy Network (SIREN)<br />
Mission: to educate citizens about renewable energy and assist in renewable energy<br />
projects. www.sirensolar.org<br />
• Build It Solar: Solar Energy Projects for DoItYourselfers<br />
A resource which gives suggestions, advice, and information on hundreds <strong>of</strong><br />
sustainable projects, “from changing a light bulb to building a solar home.”<br />
http://www.builditsolar.com/index.htm<br />
• Ro<strong>of</strong> Ray: What’s Your Solar Potential?<br />
As their website states, “We are a solar array modeling service and community<br />
determined to help consumers evaluate solar for their home or business and to create<br />
greater awareness for solar overall.” http://www.ro<strong>of</strong>ray.com/<br />
249 See www.sirensolar.org for more information<br />
<strong>Report</strong> <strong>of</strong> the <strong>Bloomington</strong> <strong>Peak</strong> <strong>Oil</strong> <strong>Task</strong> <strong>Force</strong> 215
<strong>State</strong> and utility residential renewable energy and efficiency incentives<br />
A number <strong>of</strong> residential efficiency and renewable energy incentives are available for<br />
homeowners. These incentives range from property tax credits, to public and private<br />
grants and rebates. The terms <strong>of</strong> these incentives frequently change. Please consult with<br />
the appropriate entity for the specifics <strong>of</strong> each program.<br />
• Database <strong>of</strong> <strong>State</strong> Incentives for Renewables and Efficiency<br />
“DSIRE is a comprehensive source <strong>of</strong> information on state, local, utility, and federal<br />
incentives and policies that promote renewable energy and energy efficiency.<br />
Established in 1995 and funded by the U.S. Department <strong>of</strong> Energy, DSIRE is an ongoing<br />
project <strong>of</strong> the N.C. Solar Center and the Interstate Renewable Energy Council.”<br />
http://www.dsireusa.org.<br />
• Energy Star: Federal Tax Credits For Energy Efficiency<br />
http://www.energystar.gov/index.cfm?c=tax_credits.tx_index<br />
• Duke Energy: Smart $aver Program<br />
http://www.duke‐energy.com/indiana/savings/smart‐saver.asp<br />
• <strong>Indiana</strong> Office <strong>of</strong> Energy Development<br />
www.in.gov/oed/<br />
• South Central <strong>Indiana</strong> REMC – Heating and Cooling Rebate Program<br />
“South Central <strong>Indiana</strong> REMC’s rebate program is designed to encourage members<br />
to purchase energy efficient equipment. The rebates are based on the Seasonal<br />
Energy Efficiency Rating (S.E.E.R.). The higher the S.E.E.R. the more efficient<br />
the equipment resulting in lowering operating costs.” The program focuses on central<br />
air, heat pumps and geothermal heat pumps.<br />
http://www.dsireusa.org/library/includes/incentive2.cfm?Incentive_Code=IN13F&<br />
state=IN&CurrentPageID=1&RE=1&EE=1<br />
Leverage local expertise<br />
<strong>Bloomington</strong> is home to a growing number <strong>of</strong> energy efficiency and renewable energy<br />
experts. Local experts are listed on the <strong>City</strong> <strong>of</strong> <strong>Bloomington</strong> Environmental Commission’s<br />
green building page: http://bloomington.in.gov/green‐building‐local‐resources<br />
Learn to make simple repairs around your home.<br />
You can learn a large number <strong>of</strong> home repair skills at classes <strong>of</strong>fered by the <strong>City</strong> and by<br />
local home improvement stores. Can you repair a break in a water line? Repair weather‐<br />
stripping? Install or repair rain gutters? Learning to handle these skills with manual tools<br />
could be a real security issue, not to mention a potential source <strong>of</strong> future income. 250<br />
250 Source: Austin’s Crude Awakening, Preparing for a Post-<strong>Peak</strong> Lifestyle,<br />
http://www.crudeawakening.org/Preparing.htm<br />
<strong>Report</strong> <strong>of</strong> the <strong>Bloomington</strong> <strong>Peak</strong> <strong>Oil</strong> <strong>Task</strong> <strong>Force</strong> 216
Be Neighborly<br />
• Get to know your neighbors.<br />
Close groups <strong>of</strong> neighbors can really strengthen a neighborhood. It is generally<br />
unrealistic to assume that any individual or family can become skilled in every<br />
vocation needed to be completely self sufficient. Getting to know your neighbors<br />
helps you to find out what they know how to do. Exchange your services. Pool your<br />
resources. 251<br />
• Build a Neighborhood Skills Database<br />
Compile a database <strong>of</strong> who has what practical skills in your neighborhood. You may<br />
be surprised at the talents your neighbors have, from general skills like carpentry<br />
and gardening to very specific skills like computer repair. A skills database is a great<br />
way to start relocalizing because it helps everyone access the resources that are<br />
right in their own neighborhood. 252<br />
Buy Local!<br />
The average food item travels more than 1,500 miles before it ends up on your kitchen<br />
table. Each consumed product that comes from a non‐local source requires a lot <strong>of</strong> oil to<br />
transport it while our hard‐earned dollars are exported to other communities, instead <strong>of</strong><br />
strengthening our own local economy.<br />
Plant an edible garden.<br />
Plant your own garden or work with your neighbors to plant a community garden. Study<br />
bio‐intensive organic gardening techniques – a way <strong>of</strong> dramatically increasing the yields<br />
from your backyard garden. Plant vegetables as landscaping features – a bed <strong>of</strong> cabbages,<br />
onions, broccoli and carrots for example. Learn how to save seeds for the next season.<br />
Create compost out <strong>of</strong> your kitchen and yard waste. Use drip irrigation to save water. The<br />
Monroe County Extension Office is a good resource for home gardeners.<br />
Create a Neighborhood Garden Tool Pool. Read How To Grow More Vegetables (and Fruit,<br />
Nuts, Berries, Grains and Other Crops) Than You Ever Thought Possible on Less Land Than<br />
You Can Imagine by John Jeavons. This book describes biointensive approaches to<br />
vegetable gardening.<br />
251 Ibid.<br />
252 The Relocalization Network, Build a Neighborhood Skills Database,<br />
http://www.relocalize.net/guide/skillsdatabase<br />
<strong>Report</strong> <strong>of</strong> the <strong>Bloomington</strong> <strong>Peak</strong> <strong>Oil</strong> <strong>Task</strong> <strong>Force</strong> 217
CONCLUSION<br />
The peaking <strong>of</strong> production in liquid fuels and other energy sources in the near future will<br />
reshape our everyday lives. It will pr<strong>of</strong>oundly affect our community most in the areas <strong>of</strong><br />
sustenance, transportation, land use, housing, and municipal services. We must all begin<br />
now to build other, more resilient supports for our common life. These supports will<br />
consist <strong>of</strong> understandings, agreements, assumptions, physical structures, and cultural<br />
practices that will recognize lower energy availability not as a problem, but as an<br />
opportunity and a condition to which we must adapt ourselves individually and<br />
collectively.<br />
Many <strong>of</strong> us need to become part‐time farmers and water harvesters, to learn some effective<br />
health practices, and to notice and become responsible for collecting and conserving<br />
organic matter everywhere. Many <strong>of</strong> us must learn how to insulate our homes better. Many<br />
<strong>of</strong> us will have to learn how to better navigate public transit. Many <strong>of</strong> us will ride our bikes<br />
to work and carpool with neighbors to the grocery. Many <strong>of</strong> us will be required to continue<br />
on the path <strong>of</strong> vigilant resource conservation. The <strong>City</strong> <strong>of</strong> <strong>Bloomington</strong> will have to intensify<br />
its already‐active efforts to foster sustainable community well‐being by re‐thinking the way<br />
it provides services to residents.<br />
Some <strong>of</strong> these forms <strong>of</strong> adaptation will be familiar or recognizable from past eras. Others<br />
have never been applied. In all cases, the answers require us to take greater responsibility<br />
for self‐provision, for thoughtful cooperation with those around us, and for greater<br />
attention to the resources and possibilities <strong>of</strong> our homes, our neighborhoods, and our<br />
community.<br />
<strong>Report</strong> <strong>of</strong> the <strong>Bloomington</strong> <strong>Peak</strong> <strong>Oil</strong> <strong>Task</strong> <strong>Force</strong> 218
FURTHER READING<br />
The following sources provide useful information about peak oil and peak energy and<br />
reveal a diverse range ideas on those topics. The <strong>Task</strong> <strong>Force</strong> does not necessarily endorse<br />
every opinion in every work listed.<br />
BOOKS<br />
BROWN, Lester. Plan B 2.0: Rescuing a Planet Under Stress and a Civilization in<br />
Trouble. W.W. Norton, 2006. Plan B has three components: (1) a restructuring <strong>of</strong> the<br />
global economy so that it can contain civilization; (2) an all‐out effort to eradicate poverty,<br />
stabilize population, and restore hope in order to elicit participation in the developing<br />
countries; and (3) a systematic effort to restore natural systems. http://www.earth‐<br />
policy.org/Books/PB2/index.htm.<br />
CAMPBELL, C.J. The Coming <strong>Oil</strong> Crisis. Multi‐Science Publishing, 2004. An<br />
interdisciplinary treatment <strong>of</strong> how much oil remains to be found and for how long global oil<br />
resources can continue to support the expected growth in demand. Campbell concludes<br />
that given current production rates, peak production will be reached some time in the first<br />
decade <strong>of</strong> the new millennium. Based on this conclusion, Campbell examines three<br />
scenarios and <strong>of</strong>fers some interesting insights into the possible consequences to a world<br />
that has to adjust to a dwindling oil supply.<br />
CATTON, William Robert. Overshoot: the Ecological Basis <strong>of</strong> Revolutionary Change.<br />
University <strong>of</strong> Illinois Press, 1980. Suggests that humanity has already exceeded the long‐<br />
term carrying capacity <strong>of</strong> the earth and is now relying on the “phantom carrying capacity”<br />
<strong>of</strong> non‐renewable resources that will some day disappear.<br />
DEFFEYES, Kenneth. Hubbert’s <strong>Peak</strong>: The Impending World <strong>Oil</strong> Shortage. Revised ed.<br />
Princeton University Press, 2002. Deffeyes employs the methods <strong>of</strong> M. King Hubbert to<br />
conclude that world oil production will peak in this decade.<br />
DEFFEYES, Kenneth. Beyond <strong>Oil</strong>: The View from Hubbert’s <strong>Peak</strong>. Hill and Wang, 2005.<br />
Similar to Deffeyes’ earlier book, Hubbert’s <strong>Peak</strong>, but with updated information. Deffeyes<br />
explains why Hubbert’s theory <strong>of</strong> peak oil obtains and makes a call for public and private<br />
entities to develop urgent mitigation plans.<br />
EBERHART, Mark. Feeding the Fire: The Lost History and Uncertain Future <strong>of</strong><br />
Mankind’s Energy Addiction. Harmony, 2007. Eberhart documents the history <strong>of</strong> energy<br />
and the evolution <strong>of</strong> energy dependence. He demonstrates the imminence <strong>of</strong> the crisis that<br />
looms if we continue current consumption patterns.<br />
<strong>Report</strong> <strong>of</strong> the <strong>Bloomington</strong> <strong>Peak</strong> <strong>Oil</strong> <strong>Task</strong> <strong>Force</strong> 219
GILBERT, Richard, and Anthony Perl. Transport Revolutions: Moving People and<br />
Freight Without <strong>Oil</strong>. London: Earthscan, 2008. Asserts that, in the future, land<br />
transportation will shift toward movement by grid‐connected electric vehicles, while air<br />
travel and air freight will go into severe decline.<br />
GOODSTEIN, David. Out <strong>of</strong> Gas: The End <strong>of</strong> the Age <strong>of</strong> <strong>Oil</strong>. W.W. Norton, 2005. Goodstein<br />
outlines the scientific principles <strong>of</strong> the inevitable fossil fuel shortage and points to the<br />
promise afforded by switching to other sources <strong>of</strong> energy.<br />
GREER, John Michael. The Long Descent: a User's Guide to the End <strong>of</strong> the Industrial<br />
Age. New Society Publishers, 2008. Greer contends that peak oil will lead to the “catabolic<br />
collapse” <strong>of</strong> industrial civilization – not an immediate collapse, but a long, slow one lasting<br />
many decades, with periods <strong>of</strong> relative equilibrium alternating with periods <strong>of</strong> decline<br />
HEINBERG, Richard. Blackout: Coal, Climate and the Last Energy Crisis. New Society<br />
Publishers, 2009. Heinberg notes that “Only recently have a few analysts attempted<br />
peaking forecasts for world coal, and those forecasts show a likely peak for world coal<br />
production before mid‐century, possibly as soon as 2025.” He also highlights the<br />
dependency <strong>of</strong> coal as an energy source on petroleum‐based transportation, suggesting<br />
that “<strong>Peak</strong> <strong>Oil</strong> May hasten <strong>Peak</strong> Coal.”<br />
HEINBERG, Richard, and C.J. Campbell. The <strong>Oil</strong> Depletion Protocol. New Society<br />
Publishers, 2006. Describes a possible international agreement, the “oil depletion<br />
protocol” (originally proposed by Campbell), whereby nations would voluntarily reduce<br />
their oil production and oil imports. The purpose <strong>of</strong> the protocol is to reduce international<br />
rivalry over oil supplies and prevent possible resource wars. The book provides a review<br />
<strong>of</strong> the history and literature <strong>of</strong> peak oil and explains the protocol and its implications for<br />
government and industry. It also explains how municipalities and citizens can become<br />
involved.<br />
HEINBERG, Richard. The Party's Over: <strong>Oil</strong>, War and the Fate <strong>of</strong> Industrial Societies.<br />
New Society Publishers, 2005. A useful , eye‐opening introduction to the subject <strong>of</strong> peak<br />
oil. Heinberg was a member <strong>of</strong> the Oakland peak oil task force whose report is cited above.<br />
HEINBERG, Richard. Powerdown: Options and Actions for a PostCarbon World. New<br />
Society Publishers, 2004. In this sequel to The Party’s Over, Heinberg provides and update<br />
and reviews four primary ways that society can approach energy supply issues. He<br />
concludes that the prudent way to handle the energy shortage is to “power down” through<br />
intelligent, informed, cooperative means while simultaneously working to build community<br />
solidarity and to preserve knowledge, artifacts, and tools.<br />
HOPKINS, Rob. The Transition Handbook: From <strong>Oil</strong> Dependency to Local Resilience.<br />
Green, 2008. Declaring that “peak oil and climate change mean that small is inevitable,”<br />
Hopkins argues for economic relocalization, with individual communities to prepare<br />
“energy descent action plans” for the transition to a low‐energy future.<br />
<strong>Report</strong> <strong>of</strong> the <strong>Bloomington</strong> <strong>Peak</strong> <strong>Oil</strong> <strong>Task</strong> <strong>Force</strong> 220
JEAVONS, John. How to Grow More Vegetables Than You Ever Thought Possible on Less<br />
Land Than You Can Imagine. Ten Speed Press, 1991. Describes a biointensive approach to<br />
gardening. The method requires minimal watering and care and provides guidance for those<br />
wishing to plant a few plants in a tiny space to those who wish to plant enough to feed a family<br />
<strong>of</strong> four on less than half an acre.<br />
KUNSTLER, James Howard. The Long Emergency: Surviving the End <strong>of</strong> the <strong>Oil</strong> Age,<br />
Climate Change, and Other Converging Catastrophes. Atlantic Monthly Press, 2005.<br />
This controversial author discusses peak oil in the context <strong>of</strong> climate change, infrastructure<br />
challenges, and habitat destruction. Describing the political, social, and economic<br />
consequences <strong>of</strong> peak oil, he argues that our way <strong>of</strong> life will have to become intensely more<br />
local, that our economy will have to be structured around food production, and that land<br />
will have to be reallocated.<br />
LERCH, Daniel. Post Carbon Cities: Planning for Energy and Climate Uncertainty. Post<br />
Carbon Institute, 2007. “Provides guidance and support to local government <strong>of</strong>ficials and<br />
staff for meeting three critical goals: breaking community dependence on oil, stopping<br />
community contributions to global warming, and preparing the community to thrive in a<br />
time <strong>of</strong> energy and climate uncertainty.”<br />
LOVINS, Amory, et al. Winning the <strong>Oil</strong> Endgame: Innovation for Pr<strong>of</strong>it, Jobs, and<br />
Security. Rocky Mountain Institute, 2005. Co‐funded by the Pentagon, this study provides<br />
a plan for reducing U.S. oil use by 50% by 2025 and ending dependence on foreign oil. To<br />
achieve these goals, Lovins proposes four steps: (1) Double the efficiency <strong>of</strong> oil use through<br />
measures such as ultra‐light vehicle design. (2) Apply creative business models and public<br />
policies to speed the pr<strong>of</strong>itable adoption <strong>of</strong> super‐efficient light vehicles, heavy trucks, and<br />
airplanes. (3) Embark on the crash development <strong>of</strong> bi<strong>of</strong>uels, cellulosic ethanol in<br />
particular. (4) Apply efficiency measures to save 50% <strong>of</strong> the projected 2025 use <strong>of</strong> natural<br />
gas.<br />
MACKAY, David J.C. 2009. Sustainable Energy – Without the Hot Air. UIT Cambridge<br />
Ltd., 2009. Attempts to answer somewhat the question: Is it possible to power modern<br />
civilization with renewable energy alone. The answer is “Yes but” – it would take “country‐<br />
sized” facilities, and it wouldn’t be easy. Also available online at<br />
http://www.withouthotair.com. The focus is primarily on Britain, but there are also<br />
discussions on North America and the world.<br />
MOBBS, Paul. Energy Beyond <strong>Oil</strong>. Matador Press, 2005. Mobbs provides a detailed<br />
account <strong>of</strong> the peak oil phenomenon and makes the argument that, while it will be a<br />
collective shock, life after the peak promises a more sustainable reality.<br />
MURPHY, Pat. Plan C: Community Survival Strategies for <strong>Peak</strong> <strong>Oil</strong> and Climate<br />
Change. New Society Publishers, 2008. Explores the risks inherent in trying to continue our<br />
energy-intensive lifestyle. A resource for anyone interested in living a lower-energy sustainable<br />
lifestyle.<br />
<strong>Report</strong> <strong>of</strong> the <strong>Bloomington</strong> <strong>Peak</strong> <strong>Oil</strong> <strong>Task</strong> <strong>Force</strong> 221
PIMENTEL, David, ed. Bi<strong>of</strong>uels, Solar and Wind as Renewable Energy Systems: Benefits<br />
and Risks. Springer, 2008. A detailed look at some specific aspects <strong>of</strong> renewable energy<br />
production.<br />
ROBERTS, Paul. The End <strong>of</strong> <strong>Oil</strong>: On the Edge <strong>of</strong> a Perilous New World. Houghton Mifflin,<br />
2004. Roberts documents the alarming rate at which the global supply <strong>of</strong> petroleum is<br />
being depleted and explores which energy sources will replace oil, who will control them,<br />
and how disruptive the transition to the post‐petroleum world will be. He stresses the<br />
importance <strong>of</strong> acting now in order to bring about meaningful long‐term results.<br />
RUBIN, Jeff. Why Your World is About to Get a Whole Lot Smaller: <strong>Oil</strong> and the End <strong>of</strong><br />
Globalization. Random House, 2009. Traces the connection between the present economic<br />
crisis and the preceding run‐up in oil prices. As the subtitle indicates, argues that<br />
increasingly expensive oil in the future will lead to the “end <strong>of</strong> globalization” because <strong>of</strong> the<br />
greater cost <strong>of</strong> transporting goods over long distances.<br />
SIMMONS, Matthew. Twilight in the Desert. J. Wiley & Sons, 2005. Investment banker<br />
Simmons provides a field‐by‐field assessment <strong>of</strong> Saudi Arabia’s key oilfields, highlights<br />
many discrepancies between the kingdom’s actual production potential and its seemingly<br />
extravagant resource claims, and predicts oil prices approach $190/bbl soon.<br />
STRAHERN, David. The Last <strong>Oil</strong> Shock. McArthur & Co./John Murray, 2007. Good for its<br />
thorough treatment <strong>of</strong> the history <strong>of</strong> the oil industry, M. King Hubbert, world oil reserves,<br />
and its finding that most peak oil assessments are so close as to provide a near‐consensus<br />
that oil will peak before 2020.<br />
TERTZAKIAN, Peter. A Thousand Barrels a Second: The Coming <strong>Oil</strong> Break Point and<br />
the Challenges Facing an Energy Dependent World. McGraw‐Hill Pr<strong>of</strong>essional, 2007.<br />
The title refers to the staggering rate <strong>of</strong> oil production and consumption as the world nears<br />
peak. Tertzakian tracks the impact <strong>of</strong> energy sources through a historical lens, arguing<br />
how inherent mismatches between dwindling supply and growing demand lead to crises<br />
that can be resolved only by innovation.<br />
TRAINER, Ted. Renewable Energy Cannot Sustain a Consumer Society. Springer, 2007.<br />
An extended review <strong>of</strong> the literature on renewable energy which arrives at the conclusion<br />
stated in the title: however useful various forms <strong>of</strong> alternative energy might be,<br />
individually and collectively they cannot provide enough energy reliably to permit the<br />
continuation <strong>of</strong> “consumer society.”<br />
<strong>Report</strong> <strong>of</strong> the <strong>Bloomington</strong> <strong>Peak</strong> <strong>Oil</strong> <strong>Task</strong> <strong>Force</strong> 222
GOVERNMENT PUBLICATIONS<br />
HIRSCH, R.L, R. BEZDEK, AND WENDLING, R. “<strong>Peak</strong>ing <strong>of</strong> World <strong>Oil</strong> Production: Impacts,<br />
Mitigation & Risk Management.” U.S. Dept. <strong>of</strong> Energy, National Energy Technology<br />
Laboratory, Feb. 2005.<br />
http://www.netl.doe.gov/publications/others/pdf/<strong>Oil</strong>_<strong>Peak</strong>ing_NETL.pdf. Commonly<br />
referred to as the “Hirsch <strong>Report</strong>.”<br />
U.S. CONGRESS. HOUSE. SUBCOMMITTEE ON ENERGY AND AIR QUALITY.<br />
“Understanding the <strong>Peak</strong> <strong>Oil</strong> Theory: Hearing Before the Subcommittee on Energy and Air<br />
Quality <strong>of</strong> the Committee on Energy and Commerce, House <strong>of</strong> Representatives, One<br />
Hundred Ninth Congress, First Session.” Dec. 7, 2005.<br />
http://www.access.gpo.gov/congress/house.<br />
U.S. DEPT. OF ENERGY. “20% Wind Energy by 2030: Increasing Wind Energy’s<br />
Contribution to U.S. Electricity Supply: Executive Summary.” May 2008.<br />
http://www1.eere.energy.gov/windandhydro/pdfs/41869.pdf.<br />
U.S. GOVERNMENT ACCOUNTING OFFICE. “Crude <strong>Oil</strong>: Uncertainty about Future <strong>Oil</strong><br />
Supply Makes Important to Develop a Strategy for Addressing a <strong>Peak</strong> and Decline in <strong>Oil</strong><br />
Production,” GAO‐07‐283, Feb. 2007. http://www.gao/gov/new.items/d07283.pdf.<br />
WESTERVELT, Eileen, et al. “Energy Trends and Their Implications for U.S. Army<br />
Installations,” a report prepared for U.S. Army Corps <strong>of</strong> Engineers, ERDC/CERL TN‐05‐1,<br />
Sept. 2005. http://www.energybulletin.net/docs/EnergyTrendsUSArmySummary.pdf.<br />
ARTICLES<br />
AYRES, Robert U., and Benjamin Warr. “Accounting for Growth: The Role <strong>of</strong> Physical<br />
Work.” http://www.iea.org/Textbase/work/2004/eewp/Ayres‐paper1.pdf.<br />
BITTLE, Scott, Jonathan Rochkind, and Amber Ott. “The Energy Learning Curve: Coming<br />
from Different Starting Points, the Public Sees Similar Solutions.” Public Agenda, 2009.<br />
http://www.publicagenda.org/files/pdf/energy_learning_curve.pdf.<br />
DALY, Herman. “Economics in a Full World.” Scientific American, Sept. 2005, pp. 100‐107.<br />
DALY, Herman. “Herman Daly: Towards a Steady‐<strong>State</strong> Economy.” May 5, 2008.<br />
http://www.theoildrum.com/node/3941.<br />
DAVID GARDINER & ASSOCIATES, LLC. “Fighting <strong>Oil</strong> Addiction: Ranking <strong>State</strong>s’ <strong>Oil</strong><br />
Vulnerability and Solutions for Change.” National Resources Defense Council, July 2008.<br />
http://www.nrdc.org/energy/states/states.pdf.<br />
<strong>Report</strong> <strong>of</strong> the <strong>Bloomington</strong> <strong>Peak</strong> <strong>Oil</strong> <strong>Task</strong> <strong>Force</strong> 223
ENERGY WATCH GROUP. “Coal: Resources and Future Production.” EWG‐Paper No. 1/07,<br />
Mar. 2007.<br />
http://www.energywatchgroup.org/fileadmin/global/pdf/EWG_<strong>Report</strong>_Coal_10‐07‐<br />
2007ms.pdf.<br />
FRUMKIN, Howard, Jeremy Hess, and Stephen Vindigni. “<strong>Peak</strong> Petroleum and Public<br />
Health.” Journal <strong>of</strong> the American Medical Association, Oct. 10, 2007pp. 1688‐1690.<br />
HEINBERG, Richard, and Michael Bomford. “The Food & Farming Transition: Toward a<br />
Post Carbon Food System.” Post Carbon Institute, Spring 2009.<br />
http://www.postcarbon.org/files/PCI‐food‐and‐farming‐transition.pdf.<br />
JACKSON, Tim. “Prosperity Without Growth?: The Transition to a Sustainable Economy.<br />
UK Sustainable Development Commission, Mar. 2009. http://www.sd‐<br />
commission.org.uk/publications/downloads/prosperity_without_growth_report.pdf<br />
KARLENZIG, Warren. “Major US <strong>City</strong> Preparedness for an <strong>Oil</strong> Crisis: Which Cities and<br />
Metro Areas are Best Prepared for $4 a Gallon Gas and Beyond?” Mar. 4, 2008.<br />
http://www.commoncurrent.com/pubs/<strong>Oil</strong>Crisis3.4.08.final.pdf.<br />
KAVALOV, D., and S.D. Peteves. “The Future <strong>of</strong> Coal.” DG JRC Institute for Energy, Feb.<br />
2007.<br />
http://ie.jrc.ec.europa.eu/publications/scientific_publications/2007/EUR22744EN.pdf.<br />
MOHIUDDIN, Syed. “BloomingHOURS Re‐visited: Local Currency for a Sustainable<br />
Business Community”. Unpublished paper prepared for the <strong>Bloomington</strong> <strong>Peak</strong> <strong>Oil</strong> <strong>Task</strong><br />
<strong>Force</strong>, July 2008.<br />
MOHR, S.H., and G.M. Evans. “Forecasting Coal Production Until 2100.” Apr. 7, 2009.<br />
http://www.theoildrum.com/node/5256.<br />
PEW CHARITABLE TRUSTS, “The Clean Energy Economy: Repowering Jobs, Businesses<br />
and Investments Across America,” June 2009.<br />
http://www.pewcenteronthestates.org/uploadedFiles/Clean_Economy_<strong>Report</strong>_Web.pdf.<br />
TVERBERG, Gail. “<strong>Peak</strong> <strong>Oil</strong> and the Financial Markets: A Forecast for 2008.” Jan. 9, 2008.<br />
http://www.theoildrum.com/node/3382.<br />
WESCOTT, Robert F. “What Would $120 <strong>Oil</strong> Mean for the Economy?” Apr. 2006.<br />
http://www.secureenergy.org/files/files/149_westcott_report.pdf.<br />
ZWEIBEL, Ken, James Mason, and Vasilis Fthenakis. “A Solar Grand Plan: By 2050 Solar<br />
Power Could End U.S. Dependence on Foreign <strong>Oil</strong> and Slash Greenhouse Gas Emissions.”<br />
Scientific American, Jan. 2008, pp. 64‐73. http://www.solarplan.org/Research/Z‐M‐<br />
F_A%20Solar%20Grand%20Plan_Scientific%20American_January%202008.pdf.<br />
<strong>Report</strong> <strong>of</strong> the <strong>Bloomington</strong> <strong>Peak</strong> <strong>Oil</strong> <strong>Task</strong> <strong>Force</strong> 224
WEB SITES<br />
Energy Bulletin (http://www.energybulletin.net). “A clearinghouse for information<br />
regarding the peak in global energy supply.”<br />
The <strong>Oil</strong> Drum (http://www.theoildrum.com). A collective and very active collective blog<br />
whose self‐proclaimed mission is “to facilitate civil, evidence‐based discussions about<br />
energy and its impact on our future.” One or two major articles are posted daily. An<br />
especially useful feature is the “DrumBeat” column, a daily compilation <strong>of</strong> articles from all<br />
over the web related broadly to the topic <strong>of</strong> peak oil.<br />
The Post Carbon Institute (http://www.postcarbon.org/). “[H]elps individuals and<br />
communities understand and respond to the environmental, societal, and economic crises created<br />
by our dependence on fossil fuels.”<br />
OTHER MAJOR PEAK OIL TASK FORCE REPORTS<br />
Portland, Oregon, Descending the <strong>Oil</strong> <strong>Peak</strong>: Navigating the Transition from <strong>Oil</strong> and Natural<br />
Gas (March 2007) http://www.portlandonline.com/OSD/index.cfm?a=145732&c=42894<br />
San Buenaventura, California, Transforming Urban Environments for a Post<strong>Peak</strong> <strong>Oil</strong><br />
Future (2007):<br />
http://www.city<strong>of</strong>ventura.net/files/public_works/maintenance_services/environmental_s<br />
ervices/resources/post‐peakoil.pdf<br />
Oakland, California, <strong>Oil</strong> Independent Action Plan (February 2008)<br />
http://www.oaklandnet.com/oil/pdfs/OIO‐ActionPlan‐020608.pdf<br />
San Francisco, California, San Francisco <strong>Peak</strong> <strong>Oil</strong> Preparedness <strong>Report</strong> (March 2009)<br />
http://www.sfenvironment.org/downloads/library/peakoil_final_report.pdf<br />
Berkeley, California, Berkeley Energy Descent 20092020: Transitioning to the Post Carbon<br />
Era (April 2009) http://postcarboncities.net/files/BerkeleyEnergyDescentPlan.pdf<br />
<strong>Report</strong> <strong>of</strong> the <strong>Bloomington</strong> <strong>Peak</strong> <strong>Oil</strong> <strong>Task</strong> <strong>Force</strong> 225
APPENDICES
APPENDIX I<br />
FACTORS AFFECTING THE GLOBAL DECLINE RATE<br />
The International Energy Agency recently completed a study <strong>of</strong> the world’s 400 largest oil<br />
fields. 253 They concluded that these fields collectively, without added investment, were<br />
experiencing an annual decline <strong>of</strong> 9.1%. Therefore, almost 7mbd <strong>of</strong> additional capacity<br />
must come on line every year just to <strong>of</strong>fset these giant fields.<br />
Besides the decline in these, the largest fields, what else might affect the observable rate <strong>of</strong><br />
oil production and its availability to the world?<br />
1. Technology A. Technology may bring more oil on‐stream, both from old fields<br />
where advanced recovery may yield oil previously thought inaccessible, and from<br />
new fields that are <strong>of</strong>ten at the margins <strong>of</strong> what current technology can bring to the<br />
market. To be economically viable, both <strong>of</strong> these options require capital investment.<br />
More importantly, they are limited by the energy required to extract the resource.<br />
Since it does not make energetic sense to invest more energy than one receives in<br />
return, some oil will ultimately remain inaccessible.<br />
2. Technology B. Very advanced oil extraction technology has already been employed<br />
to raise production and extend the life <strong>of</strong> major fields, such as Canterell (Mexico),<br />
and the North Sea (England, Denmark and Norway). However, although advanced<br />
technology may extend the production plateau, or raise the rate <strong>of</strong> production<br />
initially, it <strong>of</strong>ten results in a steeper rate <strong>of</strong> decline (15‐20% for the cases mentioned<br />
above). Thus, it represents an unintended consequence that may increase the<br />
overall rate <strong>of</strong> decline in a very rapid manner.<br />
3. Investment in oil exploration and recovery in a time <strong>of</strong> high volatility <strong>of</strong> price.<br />
Exotic oil recovery, in the form <strong>of</strong> tar sands, heavy – high sulfur oils, and the deep<br />
sea requires high prices. The current collapse in the price <strong>of</strong> oil has limited<br />
investment, and thus less resource development has occurred. Since even<br />
conventional oil requires years from discovery to delivery, price booms and busts<br />
may only add to the discontinuity <strong>of</strong> supply.<br />
4. Export Land Model. Developed most fully by petroleum exploration geologist<br />
Jeffrey Brown, in its most simple form this model describes decline in oil exports as<br />
a consequence <strong>of</strong> greater demand by the exporting country. This has been cogently<br />
253 International Energy Agency, World Energy Outlook 2008; See also, Neil King & Fritsch, “Energy Watchdog<br />
Warns Of <strong>Oil</strong>‐Production Crunch IEA Official Says Supplies May Plateau Below Expected Demand,” Wall Street<br />
Journal, May 22, 2008. http://online.wsj.com/article/SB121139527250011387.html?mod=hpp_us_whats_news<br />
<strong>Report</strong> <strong>of</strong> the <strong>Bloomington</strong> <strong>Peak</strong> <strong>Oil</strong> <strong>Task</strong> <strong>Force</strong> 226
argued by Brown to dramatically decrease oil supply to importing consumers and to<br />
do so at a rate above the observed geologic rate <strong>of</strong> decline.<br />
5. Geopolitical conflict. Some 17 million barrels per day are shipped out <strong>of</strong> a very<br />
narrow waterway, the Gulf <strong>of</strong> Hormuz, in the Middle East. Obstruction <strong>of</strong> this key<br />
point <strong>of</strong> access, in the event <strong>of</strong> conflict in the region, would have immediate and<br />
severe effects on oil importing countries. This is just one <strong>of</strong> many possible global<br />
flashpoints that may affect future oil supply.<br />
6. The U.S. dollar. Denominating oil in dollars brings a clear advantage to the U.S., as<br />
does the status <strong>of</strong> the dollar as the world reserve currency. It is far from certain that<br />
this arrangement will continue, as a number <strong>of</strong> countries have spoken openly <strong>of</strong><br />
diversifying their exchange portfolio to include the euro, the yuan and the yen. If<br />
these proposed arrangements come to pass, the value <strong>of</strong> the dollar may plunge, and<br />
imported oil may become unaffordable for many U.S. citizens.<br />
7. Heavy oil, oil shales, tar sands, and bi<strong>of</strong>uels. These resources <strong>of</strong>fer some limited<br />
supply but are constrained either energetically or by other resource inputs (e.g.<br />
water, land to grow crops). They will <strong>of</strong>fer only a modest supply <strong>of</strong> liquid fuels in<br />
the future.<br />
8. The discovery <strong>of</strong> new, large fields. Although fewer and far between, the possibility<br />
remains that large fields <strong>of</strong> tens <strong>of</strong> billions <strong>of</strong> barrels may yet be discovered. Some<br />
finds <strong>of</strong> late, such as Tupi <strong>of</strong>f the coast <strong>of</strong> Brazil in development by Petrobras, or<br />
deep water Gulf <strong>of</strong> Mexico (e.g., the Tiber Field developed by British Petroleum).<br />
While these fields may yield billions <strong>of</strong> barrels <strong>of</strong> oil, one needs to place it within the<br />
context <strong>of</strong> current world use (a billion barrels are consumed every 11 days). It is<br />
also observed that these latest finds are incredibly expensive, and stretch current<br />
technology to the limit (Tiber, for instance, requires drilling in deepwater, and at a<br />
total depth <strong>of</strong> 35,000 ft.). Lastly, because field development may take many years,<br />
oil discovered today may not be available for some time.<br />
<strong>Report</strong> <strong>of</strong> the <strong>Bloomington</strong> <strong>Peak</strong> <strong>Oil</strong> <strong>Task</strong> <strong>Force</strong> 227
APPENDIX II<br />
COAL: NOT AS PLENTIFUL AS WIDELY BELIEVED<br />
Projected <strong>Peak</strong>: 2030<br />
Of all the non‐renewable fuels, coal is widely believed to be the most plentiful and the one<br />
whose production will probably peak the last. It is true that the United <strong>State</strong>s is<br />
particularly well‐placed with regard to coal reserves, with 120 billion tons <strong>of</strong> oil equivalent<br />
(Btoe) as <strong>of</strong> 2005. This is almost twice the amount <strong>of</strong> reserves claimed by its closest rival,<br />
Russia, with 69 Btoe. 254 However, there is good reason to doubt the conventional wisdom<br />
about coal being available in superabundance.<br />
Unfortunately, estimates <strong>of</strong> the amount <strong>of</strong> recoverable coal worldwide are subject to a good<br />
deal <strong>of</strong> uncertainty because <strong>of</strong> the poor quality <strong>of</strong> reserves data. According to a 2007 report<br />
by Germany’s Energy Watch Group, “the data quality in general is very poor and the<br />
reported data cannot be regarded as a realistic assessment <strong>of</strong> ‘proved recoverable coal<br />
reserves,’” and “there is probably much less coal left to be burnt than most people think.” 255<br />
Lending weight to this conclusion were huge revisions in reserve assessments by the World<br />
Energy Council for particular countries over the past two decades. Examples, for<br />
bituminous and anthracite, include the following:<br />
• In 1991, the reserve estimate for China was reduced from 152,831 million tons (Mt)<br />
to 62,200 Mt and then not subsequently revised despite rapidly rising<br />
production/consumption.<br />
• In 2003, the reserve estimate for Germany was reduced from 23,000 Mt to 183 Mt, a<br />
reduction <strong>of</strong> 99%. This is because, as the Energy Watch Group wryly noted, “large<br />
reserves formerly seen as proven have been reassessed as being speculative.”<br />
• 1998, the reserve estimate for Poland was reduced from 29,100 Mt to 12,113 Mt. In<br />
2001, it was raised to 20,300 Mt. Then, in 2004, it was reduced again, this time to<br />
14,000 Mt.<br />
254 Energy Watch Group, Coal: Resources and Future Production<br />
(http://www.energywatchgroup.org/fileadmin/global/pdf/EWG_<strong>Report</strong>_Coal_10‐07‐2007ms.pdf), Mar.<br />
2007, 6.<br />
255 Ibid., 24 and 4.<br />
<strong>Report</strong> <strong>of</strong> the <strong>Bloomington</strong> <strong>Peak</strong> <strong>Oil</strong> <strong>Task</strong> <strong>Force</strong> 228
In general, the trend has been for coal reserve estimates to be downgraded significantly<br />
rather than upgraded significantly, although there have been exceptions. One <strong>of</strong> the most<br />
notable exceptions was an upgrade in the reserve estimate for India in 1990 from 12,610<br />
Mt to 60,098 Mt, and then in four additional steps through 2004 to 90,085 Mt. 256 By 2007,<br />
however, the World Energy Council was reporting a reserve estimate for Indian bituminous<br />
<strong>of</strong> only 52,240 Mt 257 after India stopped reporting “in situ” coal and started reporting<br />
“recoverable” coal. 258 The World Energy Council’s estimate <strong>of</strong> total recoverable coal in the<br />
world as <strong>of</strong> the end <strong>of</strong> 2005 was 847,388 Mt (430,896 Mt <strong>of</strong> anthracite and bituminous,<br />
266,837 Mt <strong>of</strong> sub‐bituminous, and 149,744 Mt <strong>of</strong> lignite). 259 Pr<strong>of</strong>. David Rutledge <strong>of</strong><br />
Caltech believes that the actual amount is considerably lower: 662,000 Mt. 260<br />
<strong>State</strong>ments to the effect that “We have hundreds <strong>of</strong> years <strong>of</strong> coal remaining” are suspect<br />
and apt to be rather misleading. We should be very careful about taking such statements<br />
at face value. The amount <strong>of</strong> coal (or oil, or natural gas) remaining is <strong>of</strong>ten expressed in<br />
terms <strong>of</strong> a reserve‐to‐production (R/P) ratio – that is, the estimate amount <strong>of</strong> remaining<br />
reserves, divided by the current year’s production. Such estimates can be made for the<br />
entire world, for a single nation, or for part <strong>of</strong> a nation.<br />
256 Ibid., 26.<br />
257 World Energy Council, 2007 Survey <strong>of</strong> Energy Resources<br />
(http://www.worldenergy.org/documents/ser2007_final_online_version_1.pdf), 10.<br />
258 Ibid., 2.<br />
259 Ibid., 11.<br />
260 David Rutledge, Hubbert’s <strong>Peak</strong>, the Coal Question, and Climate Change, Watson Lecture at California<br />
Institute <strong>of</strong> Technology, 10/17/2007, http://today.caltech.edu/theater/item?story%5fid=24502<br />
<strong>Report</strong> <strong>of</strong> the <strong>Bloomington</strong> <strong>Peak</strong> <strong>Oil</strong> <strong>Task</strong> <strong>Force</strong> 229
For example, according to the <strong>Indiana</strong> Geological Survey, <strong>Indiana</strong> has about 17.54 billion<br />
tons <strong>of</strong> “available coal resources” remaining:<br />
The term “available coal resources” is defined as:<br />
Original coal resources, minus coal mined and lost in mining, minus coal restricted by<br />
land use, minus coal restricted by technological factors. 261<br />
The <strong>Indiana</strong> Geological Survey states, “Taking into account the current level <strong>of</strong> coal<br />
production in <strong>Indiana</strong> (approximately 30 million [mln] short tons a year), 17.54 billion tons<br />
<strong>of</strong> coal could last about 585 years.” 262<br />
261 Maria Mastalerz et al., Characterization <strong>of</strong> <strong>Indiana</strong>’s Coal Resource: Availability <strong>of</strong> the Reserves, Physical and<br />
Chemical Properties <strong>of</strong> the Coal, and Present and Potential Uses, Open‐File Study 04‐02, <strong>Indiana</strong> Geological<br />
Survey, July 2004, 16.<br />
262 Ibid., 23‐24.<br />
<strong>Report</strong> <strong>of</strong> the <strong>Bloomington</strong> <strong>Peak</strong> <strong>Oil</strong> <strong>Task</strong> <strong>Force</strong> 230
Unfortunately, stated coal R/P ratios are subject to wild fluctuations, depending on<br />
revisions in estimates on the amount <strong>of</strong> recoverable coal remaining, and changes in the<br />
amount <strong>of</strong> coal currently being produced. In general, R/P ratios for coal have tended to be<br />
adjusted downward rather than upward (in part because, as noted above, there has been a<br />
tendency to adjust reserve estimates downward). For example, the earliest R/P ratio<br />
estimate for the United <strong>State</strong>s, made in the 1920’s, claimed that the U.S. had enough coal to<br />
last for over 4000 years, 263 but this calculation was badly flawed, partly because <strong>of</strong> an<br />
exaggerated estimate on the amount <strong>of</strong> recoverable coal in the country. More recent R/P<br />
ratio estimates claim that the U.S. has enough coal to last a little over 200 years.<br />
The <strong>Indiana</strong> Geological Survey's statement that<br />
<strong>Indiana</strong> coal "could last about 585 years" is based<br />
on the Survey's conclusion that <strong>Indiana</strong> has<br />
approximately 17.5 billion tons <strong>of</strong> available coal<br />
resources. There is a major discrepancy between<br />
that figure and the figure currently being reported<br />
by the federal Energy Information Administration<br />
(EIA): a “demonstrated reserve base” <strong>of</strong> 9.379<br />
billion tons, and “estimated recoverable reserves” <strong>of</strong><br />
4.001 billion tons. 264 Clearly, if the EIA figure is correct, then <strong>Indiana</strong>’s coal would not last<br />
585 years at the current production rate, but considerably less – using a figure <strong>of</strong> 4.001<br />
billion tons <strong>of</strong> recoverable reserves, the R/P ratio would point to about 134 years.<br />
When queried about the discrepancy between the <strong>Indiana</strong> Geological Survey and Energy<br />
Information Agency figures regarding <strong>Indiana</strong> coal reserves, George Warholic <strong>of</strong> the EIA<br />
attributed it to “EIA’s current inability to incorporate updated reserve data into [its]<br />
existing database” because <strong>of</strong> lack <strong>of</strong> funding – an admission that the data provided by the<br />
263 Rutledge, Hubbert’s <strong>Peak</strong>.<br />
We have all heard the coal<br />
industry’s <strong>of</strong>ten repeated boast<br />
that America is the “Saudi Arabia<br />
<strong>of</strong> coal.” The idea that America<br />
has 250 years <strong>of</strong> coal supplies<br />
has been repeated so <strong>of</strong>ten that<br />
has become almost a part <strong>of</strong> our<br />
culture and unfortunately gives<br />
policymakers what I believe to<br />
be excessive comfort.<br />
– Robert A. Hefner, The GET, 2009.<br />
264 Energy Information Administration, “Recoverable Coal Reserves at Producing Mines, Estimated<br />
Recoverable Reserves, and Demonstrated Reserve Base by Mining Method,” <strong>Report</strong> no. DOE/EIA 0584<br />
(2007), released September 2008 (http://www.eia.doe.gov/cneaf/coal/page/acr/table15.html)<br />
<strong>Report</strong> <strong>of</strong> the <strong>Bloomington</strong> <strong>Peak</strong> <strong>Oil</strong> <strong>Task</strong> <strong>Force</strong> 231
federal agency charged with producing the “<strong>of</strong>ficial energy statistics from the U.S.<br />
government” are perhaps somewhat questionable.<br />
According to Warholic, there was another likely explanation as well: “differences in<br />
recoverable reserves definitions.” The statement that <strong>Indiana</strong> has 585 years <strong>of</strong> coal left at<br />
the current production rate comes from a 2004 report by the <strong>Indiana</strong> Geological Survey<br />
entitled Characterization <strong>of</strong> <strong>Indiana</strong>’s Coal Resource: Availability <strong>of</strong> the Reserves, Physical<br />
and Chemical Properties <strong>of</strong> the Coal, and Present and Potential Uses. Warholic indicated<br />
familiarity with this document, and said, “The report does not seem to provide any<br />
recovery factors, i.e., the amount <strong>of</strong> coal recovered from mining the available resources.<br />
For <strong>Indiana</strong> coal production, EIA uses recovery ratios <strong>of</strong> 41.4 percent for underground and<br />
58.5 percent for surface mines. These recovery factors would substantially deflate the<br />
reserve estimate <strong>of</strong> 17 billion tons.” 265 Indeed they would. Assuming that <strong>Indiana</strong> has 2.0<br />
billion tons <strong>of</strong> coal “available” for surface mining and 15.5 billion tons “available” for<br />
underground mining, then the total amount <strong>of</strong> coal actually “recoverable” would be,<br />
according to the EIA’s recovery ratios, 1.17 billion tons from surface mining and 6.417<br />
billion tons from underground mining, or 7.587 billion tons. This is considerably more<br />
than the 4.001 billion tons according to the EIA’s “<strong>of</strong>ficial” figures, but considerably less<br />
than the 17.5 billion tons according to the <strong>Indiana</strong> Geological Survey and would point to a<br />
R/P ratio that would imply that <strong>Indiana</strong> has about “254 years” <strong>of</strong> coal left, not 585 years.<br />
Unfortunately, the <strong>Task</strong> <strong>Force</strong> does not have the expertise to judge which numbers ‐‐ those<br />
<strong>of</strong> the <strong>Indiana</strong> Geological Survey or those <strong>of</strong> the Energy Information Administration ‐‐<br />
represent a more accurate picture <strong>of</strong> <strong>Indiana</strong> coal reserves.<br />
In addition to considering the “reserves” numerator in the R/P ratio somewhat uncertain,<br />
we must also note that the “production” divisor is subject to change from year to year.<br />
Thus, if the production rate goes down, the recoverable coal will last longer, while if the<br />
production rate goes up, the recoverable coal will not last as long. Coal production in<br />
<strong>Indiana</strong> has been subject to considerable variation over the past century, rising to one peak<br />
265 Personal communication from George Warholic, Energy Information Administration, December 9, 2008.<br />
<strong>Report</strong> <strong>of</strong> the <strong>Bloomington</strong> <strong>Peak</strong> <strong>Oil</strong> <strong>Task</strong> <strong>Force</strong> 232
during World War I, then falling as production shifted to non‐union mines in other states<br />
and because <strong>of</strong> the Great Depression, then rising to a second peak during World War II,<br />
then falling into another trough during the 1950’s, and then rising once again to a new and<br />
even higher peak, or series <strong>of</strong> peaks:<br />
Source: Maria Mastalerz et al., Characterization <strong>of</strong> <strong>Indiana</strong>’s Coal Resource, 2004, p. 76<br />
After 1990, <strong>Indiana</strong> coal production took a dip because high‐sulfur Illinois Basin coal could<br />
not be burned in many power plants due to new federal environmental regulations.<br />
Typically, such power plants began using coal from the Powder River Basin <strong>of</strong> Wyoming<br />
instead. This sub‐bituminous coal is inferior in heat content to bituminous Illinois Basin<br />
coal, but is lower in sulfur. Now, many <strong>of</strong> the power plants burning Powder River coal have<br />
had scrubbers installed to deal with the sulfur problem, and have begun using Illinois Basin<br />
coal again. As a result, <strong>Indiana</strong> coal production is again near an all‐time high. In March<br />
2009, Peabody Energy announced a new mine in Sullivan County that will be the largest<br />
surface mine in the eastern United <strong>State</strong>s and will produce 8 million tons <strong>of</strong> coal per year.<br />
This single mine would increase coal production in <strong>Indiana</strong> by about 25% ‐‐ with a<br />
corresponding decrease in the amount <strong>of</strong> time that <strong>Indiana</strong>’s remaining coal can be<br />
expected to last. 266<br />
266 “<strong>Indiana</strong> Plans Spur to Big Coal Mine,” Trains, June 2009, 13.<br />
<strong>Report</strong> <strong>of</strong> the <strong>Bloomington</strong> <strong>Peak</strong> <strong>Oil</strong> <strong>Task</strong> <strong>Force</strong> 233
The statement that “<strong>Indiana</strong> has 585 <strong>of</strong> coal remaining at the current rate <strong>of</strong> production” is<br />
apt to be particularly misleading unless consideration is given to the current rate <strong>of</strong><br />
consumption. The fact is that, at least until recently, <strong>Indiana</strong> has been consuming about<br />
twice as much coal as it produces, with most <strong>of</strong> the “imported” coal coming from the states<br />
<strong>of</strong> Wyoming, West Virginia, and Illinois:<br />
If <strong>Indiana</strong> were required to be self‐sufficient in coal, it would (barring a halving <strong>of</strong><br />
consumption) have to double its coal production, which means that current coal reserves<br />
would last only half as long as they would at the present production rate.<br />
<strong>Report</strong> <strong>of</strong> the <strong>Bloomington</strong> <strong>Peak</strong> <strong>Oil</strong> <strong>Task</strong> <strong>Force</strong> 234
Although the prevailing sense among governments and certainly among the general public<br />
is that there is “plenty” <strong>of</strong> coal left in the world,<br />
the Energy Watch Group warns that global<br />
production could peak as early as 2020‐2025. The<br />
EWG is particularly concerned about the supply<br />
situation in China, where consumption has been<br />
rising especially rapidly over the last decade. It<br />
believes that “China will reach maximum<br />
production within the next 5‐15 years, probably<br />
around 2015…. The steep rise in production <strong>of</strong><br />
the past few years must be followed by a steep<br />
decline after 2020.” 267 It also believes that “the<br />
strongly rising production <strong>of</strong> China will have a<br />
substantial influence on the peak <strong>of</strong> world coal<br />
production. Once China cannot increase its<br />
production any more global coal production will<br />
peak.” 268<br />
Startling as the conclusion that global coal production will peak by 2020‐2025, even more<br />
startling is the Energy Watch Group’s conclusion that U.S. coal production may already<br />
have peaked: “Though total production volumes are still increasing due to the expanding<br />
production <strong>of</strong> subbituminous coal in Wyoming, coal production in terms <strong>of</strong> energy had<br />
already peaked in 1998 at 598 Mtoe [million tons <strong>of</strong> oil equivalent] compared to 576 Mtoe<br />
in 2005.” 269 On the other hand, the EWG notes that the U.S. still retains, if the <strong>of</strong>ficial<br />
figures are to be believed, substantial remaining coal reserves in several other states. Its<br />
argument that “it is not probable that the huge reserves in Montana, Illinois, Western<br />
267 Energy Watch Group, Coal, 27.<br />
268 Ibid., 15.<br />
269 Loc cit.<br />
The peak <strong>of</strong> world oil<br />
production in 2010 will impact<br />
the world economy<br />
pr<strong>of</strong>oundly. Without a<br />
coherent effort to proactively<br />
reduce energy consumption<br />
further while developing<br />
renewable sources, the decline<br />
<strong>of</strong> coal toward the middle <strong>of</strong><br />
the century will deliver a coup<br />
de grace to industrial<br />
civilization, making the<br />
maintenance <strong>of</strong> the electrical<br />
grid impossible. We will then<br />
have come to the end <strong>of</strong> the<br />
road, having used nature’s<br />
endowment <strong>of</strong> cheap, energy‐<br />
dense fuels without having<br />
built a bridge to the future.<br />
What follows is the final<br />
Blackout.” Source: Heinberg,<br />
Blackout, p. 167.<br />
<strong>Report</strong> <strong>of</strong> the <strong>Bloomington</strong> <strong>Peak</strong> <strong>Oil</strong> <strong>Task</strong> <strong>Force</strong> 235
Kentucky and Ohio will be converted into production” 270 is not entirely convincing. Should<br />
global coal production peak early and leave the world hungry for hydrocarbons, it seems<br />
unlikely that these reserves would remain untapped.<br />
<strong>Indiana</strong> currently exports only a small amount <strong>of</strong> coal to power plants in neighboring<br />
states, it is possible to imagine a scenario in which <strong>Indiana</strong> participates in an export boom<br />
and significantly increases its production. Should that happen, there would be an increase<br />
in the size <strong>of</strong> the production divisor in the state’s R/P ratio, reducing the “number <strong>of</strong> years”<br />
that the state’s coal would last. This would especially be the case if demand for coal‐<br />
generated electricity increases significantly because peak oil causes the world to turn to<br />
electric vehicles or coal‐to‐liquids (CTL) production. On the other hand, the increase in<br />
demand could be moderated by rapid penetration <strong>of</strong> wind‐ or solar‐generated electricity<br />
into the marketplace – or, possibly even more likely, as a result <strong>of</strong> the widespread<br />
substitution <strong>of</strong> natural gas for coal (see below).<br />
A careful recent study <strong>of</strong> when world coal production will peak is an article by S.H. Mohr<br />
and G.M. Evans, “Forecasting Coal Production Until 2100,” accepted for publication in the<br />
journal Fuel. According to Mohr and Evans, depending on the actual amount <strong>of</strong> ultimately<br />
recoverable coal in the world, production could “peak between 2010 and 2048 on a mass<br />
basis and between 2011 and 2047 on an energy basis. The Best Guess scenario assumed a<br />
URR [ultimately recoverable resource] <strong>of</strong> 1144 Gt and peaks in 2034 on a mass basis, and<br />
in 2026 on an energy basis.” 271 Given a “best guess” that world coal production will peak in<br />
2026 “on an energy basis,” the <strong>Task</strong> <strong>Force</strong> feels that it would be prudent to assume that the<br />
peak will occur by 2030.<br />
270 Ibid., 38.<br />
271 S.H. Mohr and G.M. Evans, “Forecasting Coal Production Until 2100,”<br />
http://www.theoildrum/com/node/5256.<br />
<strong>Report</strong> <strong>of</strong> the <strong>Bloomington</strong> <strong>Peak</strong> <strong>Oil</strong> <strong>Task</strong> <strong>Force</strong> 236
The following projection <strong>of</strong> future coal production trends by the Energy Watch Group is<br />
consistent with the estimate by Mohr and Evans:<br />
Source: Energy Watch Group, Coal: Resources and Future Production, March 2007<br />
<strong>Report</strong> <strong>of</strong> the <strong>Bloomington</strong> <strong>Peak</strong> <strong>Oil</strong> <strong>Task</strong> <strong>Force</strong> 237
APPENDIX III<br />
NATURAL GAS: PLENTIFUL – AT LEAST FOR NOW<br />
WHEN WILL IT PEAK?<br />
As recently as 2005, natural gas production levels in North America were stagnant or<br />
declining, and it was beginning to appear that they had peaked. This was significant<br />
because, while natural gas elsewhere in the world, particularly in the Middle East and<br />
Russia, is still plentiful, transporting it to the United <strong>State</strong>s presents a problem: in its<br />
ordinary gaseous state, it cannot be carried across the ocean in bulk tankers. Transoceanic<br />
shipment <strong>of</strong> natural gas requires that the gas be super‐cooled and liquefied, then shipped in<br />
special tankers. These tankers require special terminals for loading and unloading. With a<br />
potential natural gas shortage in North America looming on the horizon, substantial<br />
investments were made to construct liquefied natural gas (LNG) shipping and terminal<br />
facilities.<br />
In the past few years, the North American natural gas situation has changed rather<br />
dramatically. Instead <strong>of</strong> going down, production was, until the current recession drastically<br />
curtailed demand, actually going up. This development is mainly due to new drilling<br />
technologies – horizontal drilling, and hydraulic fracturing (“fracing”). Fracing is a<br />
particularly noteworthy development that has made it possible to recover substantial<br />
amounts <strong>of</strong> gas from shale formations previously considered unsuitable for drilling.<br />
A non‐pr<strong>of</strong>it organization <strong>of</strong> volunteer experts called the “Potential Gas Committee” (PGC)<br />
regularly reviews the U.S. natural situation and issues a biennial assessment <strong>of</strong> supplies. In<br />
June, 2009, the PGC announced its latest report and declared an “unprecedented increase<br />
in magnitude <strong>of</strong> [the] U.S. natural gas resource base” amounting to an increase <strong>of</strong> over 25%<br />
from the previous report. The revised estimate <strong>of</strong> the “resource base,” 1,836 trillion cubic<br />
feet (Tcf) is “the highest resource evaluation in the Committee’s 44‐year history,” and the<br />
committee pegged the nation’s “total available future supply” at 2,074 Tcf. The committee<br />
<strong>Report</strong> <strong>of</strong> the <strong>Bloomington</strong> <strong>Peak</strong> <strong>Oil</strong> <strong>Task</strong> <strong>Force</strong> 238
asserted, “Consequently, our present assessment demonstrates an exceptionally strong and<br />
optimistic gas supply picture for the nation.” 272<br />
This announcement was immediately followed by a press release from T. Boone Pickens,<br />
who declared,<br />
Today’s report substantiates what I’ve been saying for years: there’s plenty <strong>of</strong><br />
natural gas in the U.S. I launched the Pickens Plan a year ago to help reduce our<br />
dangerous dependence on foreign oil, and using our abundant supply <strong>of</strong> natural gas<br />
as a transition fuel for fleet vehicles and heavy‐duty trucks is a key element <strong>of</strong> that<br />
plan. On the same day this report is going out, diesel prices are again on the rise,<br />
squeezing the trucking industry. Now more than ever we need to take action to<br />
enact energy reform that will immediately reduce oil imports. The 2,074 trillion<br />
cubic feet <strong>of</strong> domestic natural gas reserves cited in the study is the equivalent <strong>of</strong><br />
nearly 350 billion barrels <strong>of</strong> oil, about the same as Saudi Arabia’s oil reserves. 273<br />
The famous “Pickens Plan,” launched with so much fanfare in July 2008, calls for the<br />
substitution <strong>of</strong> wind energy for natural gas in electricity production so that the natural gas<br />
can be diverted for use as a transportation fuel. However, efforts to find financing for<br />
Pickens’ wind project collapsed along with the credit markets. By January 2009, Pickens<br />
declared that “the wind stuff is deader than hell right now.” 274<br />
Where Pickens advocates diverting natural gas from electricity production to<br />
transportation, climate change activist (and former Acting Assistant Secretary <strong>of</strong> Energy for<br />
Energy Efficiency and Renewable Energy) Joseph Romm is pushing an almost opposite<br />
strategy. Romm wants to use our apparently plentiful gas supply as a “climate action game<br />
changer”: “Natural gas alone could essentially meet the entire Waxman‐ Markey CO2 target<br />
for 2020 – without requiring gobs <strong>of</strong> new power plants to be sited and built or thousands <strong>of</strong><br />
miles <strong>of</strong> new transmission lines. There is simply no doubt that, other than energy efficiency<br />
272 “Potential Gas Committee <strong>Report</strong>s Unprecedented Increase in Magnitude <strong>of</strong> U.S. Natural Gas Resource<br />
Base,” http://www.mines.edu/Potential‐Gas‐Committee‐reports‐unprecedented‐increase‐in‐magnitude‐<strong>of</strong>‐<br />
U.S.‐natural‐gas‐resource‐base.<br />
273 ” T. Boone Pickens <strong>State</strong>ment on Surge in Estimated Natural Gas Reserves,”<br />
http://www.pickensplan.com/news/2009/06/18/t‐boone‐pickens‐statement‐on‐surge‐in‐estimated‐<br />
natural‐gas‐reserves/.<br />
274 Neil King, Jr., “Pickens’s Windmills Title Against Market Realities,” Wall Street Journal, Jan. 13, 2009,<br />
http://online.wsj.com/article/SB123180966118075887.html?mod=googlenews_wsj.<br />
<strong>Report</strong> <strong>of</strong> the <strong>Bloomington</strong> <strong>Peak</strong> <strong>Oil</strong> <strong>Task</strong> <strong>Force</strong> 239
and conservation, the lowest‐cost option for achieving large‐scale CO2 reductions by 2020<br />
is simply replacing electricity by burning coal with power generated by burning more<br />
natural gas in the vast array <strong>of</strong> currently underutilized gas fired plants…. Natural gas is the<br />
cheapest, low‐carbon baseload power around.” 275 The <strong>Task</strong> <strong>Force</strong> is cautiously optimistic<br />
that recent upward revisions in the estimated U.S. natural gas resource base are<br />
reasonable, and cautiously hopeful that they are not wildly misleading. While natural gas is<br />
certainly not a zero‐carbon fuel, compared to petroleum, and certainly compared to coal, it<br />
produces far less carbon dioxide. 276 It is less polluting in other ways as well. What is<br />
unclear is whether it is now so abundant that we could easily use it to phase out most <strong>of</strong><br />
our coal‐fired power plants and at the same time run half our existing auto fleet on it – that<br />
is, to pursue Pickens’ vision and Romm’s vision simultaneously.<br />
While natural gas now appears to be plentiful, no one should be deceived into believing<br />
that it will permanently “solve” our energy problem. <strong>Oil</strong> production is peaking now, and at<br />
some point, natural gas production will surely do so as well. However, because <strong>of</strong> the<br />
uncertainty surrounding the extent <strong>of</strong> the world’s natural gas supplies, it is difficult to<br />
assign a very precise date to “peak natural gas.” In 2006, Jean Laherrere estimated that<br />
natural gas production would peak around 2030. 277 Laherrere is a petroleum engineer<br />
who, with his colleague Colin Campbell, published the article “The End <strong>of</strong> Cheap <strong>Oil</strong>” in<br />
Scientific American in 1998. This article signaled the genesis <strong>of</strong> the subsequent increased<br />
attention to the peak oil phenomenon. We consider Laherrere’s work to have a<br />
considerable degree <strong>of</strong> credibility, and thus are inclined to accept his date <strong>of</strong> 2030 for the<br />
peak in natural gas production. However, it may not take sufficient account <strong>of</strong> the potential<br />
<strong>of</strong> non‐conventional gas.<br />
275 Joseph Romm, “Climate Action Game Changer, Part 1: Is There a Lot More Natural Gas than Previously<br />
Thought?” June 3, 2009, http://climateprogress.org/2009/06/03/climate‐action‐game‐changer‐<br />
unconventional‐natural‐gas‐shale/.<br />
276 ”The best natural gas power plants produce less than half as much carbon dioxide per kWh <strong>of</strong> electricity as<br />
coal fired plants.” Craig A. Severance, “Game Changer 3: New Natural Gas Supplies – Great for Low‐Cost<br />
Climate Action, Bad for Coal,” http://climateprogress.org/2009/06/25/game‐changer‐3‐new‐natural‐gas‐<br />
supplies‐great‐news‐for‐low‐cost‐climate‐action‐bad‐news‐for‐coal/.<br />
277 Jean Laherrere, <strong>Oil</strong> and Gas: What Future? (paper presented at Groningen Annual Energy Convention, Nov.<br />
21, 2006), pp. 22‐23.<br />
<strong>Report</strong> <strong>of</strong> the <strong>Bloomington</strong> <strong>Peak</strong> <strong>Oil</strong> <strong>Task</strong> <strong>Force</strong> 240
The following graph from the Association for the Study <strong>of</strong> <strong>Peak</strong> <strong>Oil</strong> and Gas Ireland shows<br />
historical oil and gas production, with a projection for future production through 2050. It<br />
appears to be compatible with the Laherrere estimate <strong>of</strong> peak natural gas around 2030. It<br />
shows the world to be on an oil‐and‐gas plateau sloping very gradually downward until<br />
about 2020, when the decline becomes much steeper. It is important to note that the most<br />
<strong>of</strong> the decline is accounted for by falling oil production. The decline in natural gas<br />
production is much more modest.<br />
Source: ASPO Ireland<br />
<strong>Report</strong> <strong>of</strong> the <strong>Bloomington</strong> <strong>Peak</strong> <strong>Oil</strong> <strong>Task</strong> <strong>Force</strong> 241
Putting it all together: “peak energy” by 2030?<br />
In summary, we think that the following dates for the peaking <strong>of</strong> the various fossil fuels are<br />
plausible:<br />
• <strong>Oil</strong>: 2008‐2015<br />
• Coal: 2030<br />
• Natural gas: 2030(?)<br />
A question mark is placed after the 2030 projected date <strong>of</strong> peak natural gas, to allow for the<br />
possibility that a peak may occur later if recent optimistic evaluations <strong>of</strong> the magnitude <strong>of</strong><br />
the non‐conventional gas resource prove correct.<br />
If all <strong>of</strong> the three fossil fuels peak in production by 2030 (or well before, in the case <strong>of</strong><br />
petroleum), we think it would be quite difficult for world energy production to grow for<br />
very long after that point, even allowing major increases in renewable energy production –<br />
and possibly nuclear energy as well.<br />
<strong>Report</strong> <strong>of</strong> the <strong>Bloomington</strong> <strong>Peak</strong> <strong>Oil</strong> <strong>Task</strong> <strong>Force</strong> 242
APPENDIX IV<br />
Vehicle Ownership per Person in Monroe County<br />
OwnerOccupied Houses/Condos RenterOccupied Apartments<br />
Total Total<br />
TOTAL<br />
VEHICLES<br />
no vehicle 762 0 no vehicle 3,001 0 0<br />
1 vehicle 6,992 6,992 1 vehicle 10,393 10,393 17,385<br />
2 vehicles 11,310 22,620 2 vehicles 5,793 11,586 34,206<br />
3 vehicles 4,449 13,347 3 vehicles 1,505 4,515 17,862<br />
4 vehicles 1,266 5,064 4 vehicles 656 2,624 7,688<br />
5 or more 519 2,595 5 or more 252 1,260 3,855<br />
Households 25,298 Households 21,600 80,996<br />
Total # <strong>of</strong> Households 46,898<br />
Total # <strong>of</strong> Households with no vehicle: 3,763<br />
Percent <strong>of</strong> households with no vehicle: 8.02%<br />
Population size Monroe<br />
County (2000) 120,563<br />
Number <strong>of</strong> Vehicles > 80,996<br />
Monroe County Vehicles<br />
per person: > .6718<br />
United <strong>State</strong>s vehicles per 1000 people 754<br />
Source: 2000 U.S. Census<br />
<strong>Report</strong> <strong>of</strong> the <strong>Bloomington</strong> <strong>Peak</strong> <strong>Oil</strong> <strong>Task</strong> <strong>Force</strong> 243
BLOOMINGTON PEAK OIL TASK FORCE MEMBERS<br />
Dave Rollo (Chair) received a Bachelor <strong>of</strong> Science in Biology at Michigan <strong>State</strong> University,<br />
and a Master's degree in Plant Sciences from <strong>Indiana</strong> University. Since 1995, Dave has been<br />
a Research Associate in the IU Department <strong>of</strong> Biology, working on a variety <strong>of</strong> projects in<br />
molecular and microbiology. He currently works on a project for bio‐solar energy<br />
production.<br />
Dave has served on the <strong>Bloomington</strong> <strong>City</strong> Council since 2003, where he presided as<br />
president in 2007. He has also served on a number <strong>of</strong> <strong>City</strong> boards and commissions,<br />
including The Environmental Commission and the Sustainability Commission, which he<br />
created by resolution in 2005. He co‐founded Bloomingpeak (http://bloomingpeak.org/),<br />
a local peak oil awareness group in 2005 and sponsored legislation recognizing peak oil<br />
and creating the <strong>Peak</strong> <strong>Oil</strong> <strong>Task</strong> <strong>Force</strong>. Since 2003, Dave has given over 50 presentations on<br />
the subject <strong>of</strong> peak oil.<br />
Peter Bane is publisher <strong>of</strong> Permaculture Activist magazine<br />
(www.permacultureactivist.net), a Visiting Pr<strong>of</strong>essor at Paul Smith's College (NY), and has<br />
been a consultant to <strong>Indiana</strong> University on permaculture design and to Slippery Rock<br />
University (PA) on curriculum for sustainability. An advisor to the Ecovillage Training<br />
Center in Tennessee, he also helped to found and design Earthaven Ecovillage, an<br />
intentional community in the North Carolina mountains. Peter holds the Diploma <strong>of</strong><br />
Permaculture Design from the British Permaculture Academy.<br />
Gary Charbonneau is Systems Librarian at <strong>Indiana</strong> University Libraries in <strong>Bloomington</strong><br />
and a member <strong>of</strong> the Libraries' Green Team. He has been "peak oil aware" since the oil<br />
shocks <strong>of</strong> the 1970s.<br />
Clay Fuqua is a Pr<strong>of</strong>essor <strong>of</strong> Biology at <strong>Indiana</strong> University, with expertise in microbiology<br />
and molecular biology, and significant research interests in environmental microbiology.<br />
Pr<strong>of</strong>essor Fuqua has authored over 70 peer‐reviewed research publications, as well as<br />
pieces for the wider community. He has served as IU Microbiology Program Director and is<br />
currently Associate Chair for Research and Facilities in the Biology Department. Pr<strong>of</strong>essor<br />
Fuqua has resided in <strong>Bloomington</strong> for over 10 years, over which he has cultivated interests<br />
in community environmental issues and <strong>Bloomington</strong>'s resilience in the face <strong>of</strong> changing<br />
resource availability.<br />
Christine Glaser is a partner in GreenFire Consulting Group, LLC. She received the<br />
equivalent <strong>of</strong> an M.A. in Economics from Mainz University in Germany and a Ph.D. in Public<br />
Affairs from Munich University. For over 20 years, she has worked as a researcher, college<br />
teacher, consultant and advocate at the intersection <strong>of</strong> environmental and economic issues.<br />
She has served on various <strong>Bloomington</strong> boards, commissions and councils, and has given<br />
numerous public talks, lectures, and workshops.<br />
<strong>Report</strong> <strong>of</strong> the <strong>Bloomington</strong> <strong>Peak</strong> <strong>Oil</strong> <strong>Task</strong> <strong>Force</strong> 244
Stephanie Kimball is a former Pr<strong>of</strong>essor <strong>of</strong> Education and is currently a homeschooling<br />
mother <strong>of</strong> two with a vision for healthy, sustainable community life. She works with Earth<br />
Care and other local non‐pr<strong>of</strong>its fighting climate change. Stephanie has organized a<br />
number <strong>of</strong> community events in <strong>Bloomington</strong>, including two Step It Up events (2007), the<br />
Earth Summit (2008) and two Cool Earth Relays (2008 & 2009).<br />
Jim Silberstein is an entrepreneur who spends his time on a variety <strong>of</strong> things. He owns a<br />
commercial and residential real estate company with properties in downtown<br />
<strong>Bloomington</strong>. Jim also teaches Business Development at Ivy Tech Community College and<br />
works as a Business Advisor for the <strong>Indiana</strong> Small Business Development Center in<br />
<strong>Bloomington</strong>. Previously, Jim created, owned, operated and sold two well‐known food<br />
businesses, Tina’s Cuisine and the Encore Café, both in <strong>Bloomington</strong>. He also has served<br />
the <strong>City</strong> <strong>of</strong> <strong>Bloomington</strong> as a member <strong>of</strong> both the Board <strong>of</strong> Zoning Appeals and the<br />
Municipal Facilities Corporation. Within the community, Jim has served as President <strong>of</strong> the<br />
<strong>Bloomington</strong> Downtown Commission and is in his twelfth year <strong>of</strong> service as a member <strong>of</strong><br />
the board <strong>of</strong> the Wonderlab Museum. Jim has a B.A. in Economics and Business from<br />
Macalester College and an M.B.A. in Marketing and Finance from the J.L. Kellogg Graduate<br />
School <strong>of</strong> Management at Northwestern University.<br />
Gregory Travis has been a Monroe County resident for thirty‐five years. A previous life as<br />
a free‐lance writer for various aviation publications, particularly focused on future aviation<br />
fuels availability, helped him become aware <strong>of</strong> the petroleum industry and infrastructure<br />
and the phenomenon <strong>of</strong> "peak oil" ‐‐ once a friend who works for Chevron explained that,<br />
that was what he meant by "field maturity." In addition to the <strong>Bloomington</strong> <strong>Peak</strong> <strong>Oil</strong> <strong>Task</strong><br />
<strong>Force</strong>, Mr. Travis serves on the Monroe County Economic Development Commission, the<br />
Monroe County Historic Review Board, the <strong>Bloomington</strong> Pr<strong>of</strong>essional Council at <strong>Indiana</strong><br />
University, and is a board member for Mother Hubbard's Cupboard. He lives with his wife,<br />
son, and several animals on a farm just large enough to grow his own food and fuel, should<br />
that become necessary.<br />
<strong>Report</strong> <strong>of</strong> the <strong>Bloomington</strong> <strong>Peak</strong> <strong>Oil</strong> <strong>Task</strong> <strong>Force</strong> 245