Peak Oil Task Force Report - City of Bloomington - State of Indiana
Peak Oil Task Force Report - City of Bloomington - State of Indiana
Peak Oil Task Force Report - City of Bloomington - State of Indiana

You also want an ePaper? Increase the reach of your titles
YUMPU automatically turns print PDFs into web optimized ePapers that Google loves.
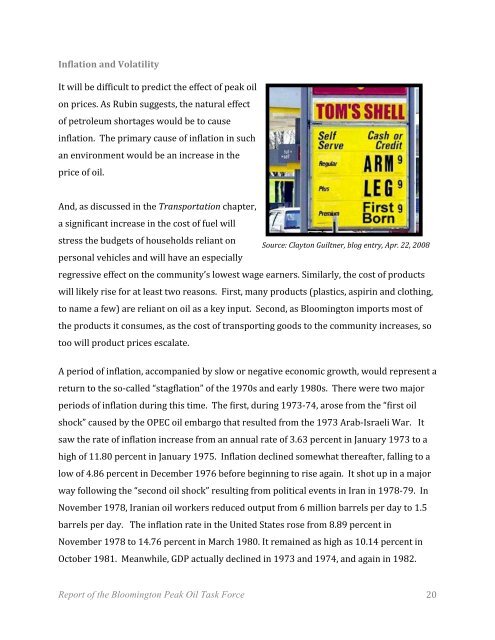
Inflation and Volatility<br />
It will be difficult to predict the effect <strong>of</strong> peak oil<br />
on prices. As Rubin suggests, the natural effect<br />
<strong>of</strong> petroleum shortages would be to cause<br />
inflation. The primary cause <strong>of</strong> inflation in such<br />
an environment would be an increase in the<br />
price <strong>of</strong> oil.<br />
And, as discussed in the Transportation chapter,<br />
a significant increase in the cost <strong>of</strong> fuel will<br />
stress the budgets <strong>of</strong> households reliant on<br />
personal vehicles and will have an especially<br />
regressive effect on the community’s lowest wage earners. Similarly, the cost <strong>of</strong> products<br />
will likely rise for at least two reasons. First, many products (plastics, aspirin and clothing,<br />
to name a few) are reliant on oil as a key input. Second, as <strong>Bloomington</strong> imports most <strong>of</strong><br />
the products it consumes, as the cost <strong>of</strong> transporting goods to the community increases, so<br />
too will product prices escalate.<br />
<strong>Report</strong> <strong>of</strong> the <strong>Bloomington</strong> <strong>Peak</strong> <strong>Oil</strong> <strong>Task</strong> <strong>Force</strong><br />
Source: Clayton Guiltner, blog entry, Apr. 22, 2008<br />
A period <strong>of</strong> inflation, accompanied by slow or negative economic growth, would represent a<br />
return to the so‐called “stagflation” <strong>of</strong> the 1970s and early 1980s. There were two major<br />
periods <strong>of</strong> inflation during this time. The first, during 1973‐74, arose from the “first oil<br />
shock” caused by the OPEC oil embargo that resulted from the 1973 Arab‐Israeli War. It<br />
saw the rate <strong>of</strong> inflation increase from an annual rate <strong>of</strong> 3.63 percent in January 1973 to a<br />
high <strong>of</strong> 11.80 percent in January 1975. Inflation declined somewhat thereafter, falling to a<br />
low <strong>of</strong> 4.86 percent in December 1976 before beginning to rise again. It shot up in a major<br />
way following the “second oil shock” resulting from political events in Iran in 1978‐79. In<br />
November 1978, Iranian oil workers reduced output from 6 million barrels per day to 1.5<br />
barrels per day. The inflation rate in the United <strong>State</strong>s rose from 8.89 percent in<br />
November 1978 to 14.76 percent in March 1980. It remained as high as 10.14 percent in<br />
October 1981. Meanwhile, GDP actually declined in 1973 and 1974, and again in 1982.<br />
20