12: Adjunct Proceedings - Automotive User Interfaces and ...
12: Adjunct Proceedings - Automotive User Interfaces and ...
12: Adjunct Proceedings - Automotive User Interfaces and ...

You also want an ePaper? Increase the reach of your titles
YUMPU automatically turns print PDFs into web optimized ePapers that Google loves.
As another interesting aspect, CL seems to directly influence<br />
the perception of time. In a user study, [2] measured<br />
the di↵erence between time intervals produced by a driver in<br />
di↵erent situations <strong>and</strong> compared the mean deviation from<br />
the actual time with the CL of the driver measured by other<br />
means. Results show a direct connection, i.e., perceived time<br />
correlates with actual cognitive workload.<br />
2.3 Physiological measures<br />
Although usually used in medical research <strong>and</strong> examination<br />
for obtaining information of state <strong>and</strong> performance of major<br />
organs, we can also use physiological sensors for obtaining<br />
information about the state of the subject. Most suitable for<br />
our purpose are obviously parameters which can not consciously<br />
be modified. For our purpose, it is important to<br />
find a completely non-intrusive method of measuring. Even<br />
small intrusion–like placing a sensor on a finger–which is easily<br />
accepted in a user study, is unlikely to find acceptance<br />
by the driver in every day driving.<br />
Measures known from literature include respiration, skin<br />
conductance, temperature, eye movement, pupil diameter,<br />
<strong>and</strong> voice analysis. Only the last three of those can be measured<br />
in an unintrusive way, but the analysis of the data<br />
can get quite complex. [8] discusses the di↵erent methods<br />
in detail.<br />
3. COGNITIVE LOAD BY CONTEXT<br />
As we discussed in the previous section, applying traditional<br />
CL measuring techniques is not always desirable in our domain.<br />
Important features are real-time conduction, immediate<br />
availability of results (e.g. results do not have to be<br />
entered manually in the system), <strong>and</strong> unintrusiveness. Table<br />
1 compares the advantages <strong>and</strong> disadvantages of di↵erent<br />
approaches.<br />
Measure Real-Time Immediate Intrusive<br />
Subjective -- - --<br />
Performance ++ + ++<br />
Physiological ++ ++ --<br />
Table 1: Suitability of cognitive load assessment for<br />
real time automotive applications is limited.<br />
As shown in Figure 2, current CL might also be estimated<br />
using another path, i.e. by assessing the impact of the environment<br />
on the driver. Although the context might not<br />
be su cient for an exact estimate of the driver’s state, we<br />
can safely assume some factors to be influential to his cognitive<br />
dem<strong>and</strong>s. Driving on the highway or in dense city<br />
tra c is probably more dem<strong>and</strong>ing than driving on a quiet<br />
rural road. Driving at a moderate speed is less stressful than<br />
driving at very high speed or being stuck in a tra c jam.<br />
Also, environmental conditions such as noise level inside <strong>and</strong><br />
outside the car can be measured <strong>and</strong> considered. The cars<br />
built-in information systems can keep a history of information<br />
presented to the driver, from which we can conduct the<br />
cognitive dem<strong>and</strong>. A lot of information flooding the driver<br />
in a very short period of time is likely to raise his CL.<br />
[18] used Dynamic Bayesian Networks (DBNs) <strong>and</strong> data obtained<br />
from the car directly to generate a continuous estimate<br />
of the drivers load. In a second step, the DBNs were<br />
transformed into arithmetic circuits for e ciency reasons,<br />
especially considering the usually limited computing power<br />
78<br />
<strong>Adjunct</strong> <strong>Proceedings</strong> of the 4th International Conference on <strong>Automotive</strong> <strong>User</strong> <strong>Interfaces</strong> <strong>and</strong><br />
Interactive Vehicular Applications (<strong>Automotive</strong>UI '<strong>12</strong>), October 17–19, 20<strong>12</strong>, Portsmouth, NH, USA<br />
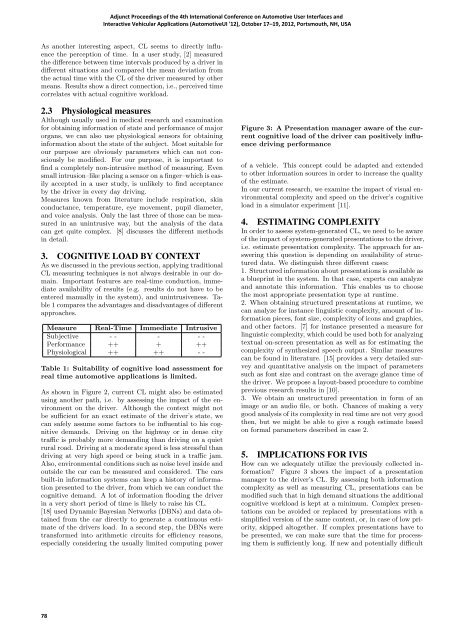
Figure 3: A Presentation manager aware of the current<br />
cognitive load of the driver can positively influence<br />
driving performance<br />
of a vehicle. This concept could be adapted <strong>and</strong> extended<br />
to other information sources in order to increase the quality<br />
of the estimate.<br />
In our current research, we examine the impact of visual environmental<br />
complexity <strong>and</strong> speed on the driver’s cognitive<br />
load in a simulator experiment [11].<br />
4. ESTIMATING COMPLEXITY<br />
In order to assess system-generated CL, we need to be aware<br />
of the impact of system-generated presentations to the driver,<br />
i.e. estimate presentation complexity. The approach for answering<br />
this question is depending on availability of structured<br />
data. We distinguish three di↵erent cases:<br />
1. Structured information about presentations is available as<br />
a blueprint in the system. In that case, experts can analyze<br />
<strong>and</strong> annotate this information. This enables us to choose<br />
the most appropriate presentation type at runtime.<br />
2. When obtaining structured presentations at runtime, we<br />
can analyze for instance linguistic complexity, amount of information<br />
pieces, font size, complexity of icons <strong>and</strong> graphics,<br />
<strong>and</strong> other factors. [7] for instance presented a measure for<br />
linguistic complexity, which could be used both for analyzing<br />
textual on-screen presentation as well as for estimating the<br />
complexity of synthesized speech output. Similar measures<br />
can be found in literature. [15] provides a very detailed survey<br />
<strong>and</strong> quantitative analysis on the impact of parameters<br />
such as font size <strong>and</strong> contrast on the average glance time of<br />
the driver. We propose a layout-based procedure to combine<br />
previous research results in [10].<br />
3. We obtain an unstructured presentation in form of an<br />
image or an audio file, or both. Chances of making a very<br />
good analysis of its complexity in real time are not very good<br />
then, but we might be able to give a rough estimate based<br />
on formal parameters described in case 2.<br />
5. IMPLICATIONS FOR IVIS<br />
How can we adequately utilize the previously collected information?<br />
Figure 3 shows the impact of a presentation<br />
manager to the driver’s CL. By assessing both information<br />
complexity as well as measuring CL, presentations can be<br />
modified such that in high dem<strong>and</strong> situations the additional<br />
cognitive workload is kept at a minimum. Complex presentations<br />
can be avoided or replaced by presentations with a<br />
simplified version of the same content, or, in case of low priority,<br />
skipped altogether. If complex presentations have to<br />
be presented, we can make sure that the time for processing<br />
them is su ciently long. If new <strong>and</strong> potentially di cult