SUBSIDIARY COMPANIES - ITC Ltd
SUBSIDIARY COMPANIES - ITC Ltd
SUBSIDIARY COMPANIES - ITC Ltd
Create successful ePaper yourself
Turn your PDF publications into a flip-book with our unique Google optimized e-Paper software.
NOTES TO THE FINANCIAL STATEMENTS (Contd.)<br />
SRINIVASA RESORTS LIMITED<br />
As at As at<br />
31st March, 2012 31st March, 2011<br />
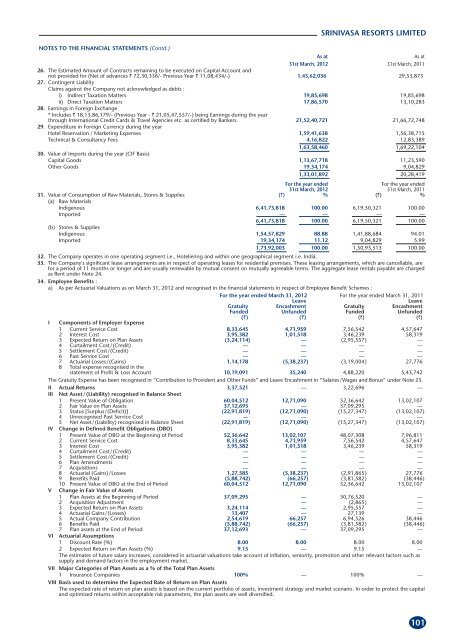
26. The Estimated Amount of Contracts remaining to be executed on Capital Account and<br />
not provided for (Net of advances ` 72,30,336/- Previous Year ` 11,08,434/-)<br />
27. Contingent Liability<br />
Claims against the Company not acknowledged as debts :<br />
1,43,62,036 29,53,873<br />
i) Indirect Taxation Matters 19,85,698 19,85,698<br />
ii) Direct Taxation Matters 17,86,570 13,10,283<br />
28. Earnings in Foreign Exchange<br />
* Includes ` 18,13,86,179/- (Previous Year - ` 21,05,47,557/-) being Earnings during the year<br />
through International Credit Cards & Travel Agencies etc. as certified by Bankers.<br />
29. Expenditure in Foreign Currency during the year<br />
21,52,40,721 21,66,72,748<br />
Hotel Reservation / Marketing Expenses 1,59,41,638 1,56,38,715<br />
Technical & Consultancy Fees 4,16,822 12,83,389<br />
30. Value of Imports during the year (CIF Basis)<br />
1,63,58,460 1,69,22,104<br />
Capital Goods 1,13,67,718 11,23,590<br />
Other Goods 19,34,174 9,04,829<br />
1,33,01,892 20,28,419<br />
For the year ended For the year ended<br />
31st March, 2012 31st March, 2011<br />
31. Value of Consumption of Raw Materials, Stores & Supplies (`) % (`) %<br />
(a) Raw Materials<br />
Indigenous 6,41,73,818 100.00 6,19,50,321 100.00<br />
Imported — — — —<br />
(b) Stores & Supplies<br />
6,41,73,818 100.00 6,19,50,321 100.00<br />
Indigenous 1,54,57,829 88.88 1,41,88,684 94.01<br />
Imported 19,34,174 11.12 9,04,829 5.99<br />
1,73,92,003 100.00 1,50,93,513 100.00<br />
32. The Company operates in one operating segment i.e., Hoteliering and within one geographical segment i.e. India.<br />
33. The Company's significant lease arrangements are in respect of operating leases for residential premises. These leasing arrangements, which are cancellable, are<br />
for a period of 11 months or longer and are usually renewable by mutual consent on mutually agreeable terms. The aggregate lease rentals payable are charged<br />
as Rent under Note 24.<br />
34. Employee Benefits :<br />
a) As per Actuarial Valuations as on March 31, 2012 and recognised in the financial statements in respect of Employee Benefit Schemes :<br />
For the year ended March 31, 2012 For the year ended March 31, 2011<br />
Leave Leave<br />
Gratuity Encashment Gratuity Encashment<br />
Funded Unfunded Funded Unfunded<br />
(`) (`) (`) (`)<br />
I Components of Employer Expense<br />
1 Current Service Cost 8,33,645 4,71,959 7,56,542 4,57,647<br />
2 Interest Cost 3,95,382 1,01,518 3,46,239 58,319<br />
3 Expected Return on Plan Assets (3,24,114) — (2,95,557) —<br />
4 Curtailment Cost/(Credit) — — — —<br />
5 Settlement Cost/(Credit) — — — —<br />
6 Past Service Cost — — — —<br />
7 Actuarial Losses/(Gains) 1,14,178 (5,38,237) (3,19,004) 27,776<br />
8 Total expense recognised in the<br />
statement of Profit & Loss Account 10,19,091 35,240 4,88,220 5,43,742<br />
The Gratuity Expense has been recognised in “Contribution to Provident and Other Funds” and Leave Encashment in “Salaries/Wages and Bonus” under Note 23.<br />
II Actual Returns 3,37,521 — 3,22,696 —<br />
III Net Asset/(Liability) recognised in Balance Sheet<br />
1 Present Value of Obligation 60,04,512 12,71,090 52,36,642 13,02,107<br />
2 Fair Value on Plan Assets 37,12,693 — 37,09,295 —<br />
3 Status [Surplus/(Deficit)] (22,91,819) (12,71,090) (15,27,347) (13,02,107)<br />
4 Unrecognised Past Service Cost — — — —<br />
5 Net Asset/(Liability) recognised in Balance Sheet (22,91,819) (12,71,090) (15,27,347) (13,02,107)<br />
IV Change in Defined Benefit Obligations (DBO)<br />
1 Present Value of DBO at the Beginning of Period 52,36,642 13,02,107 48,07,308 7,96,811<br />
2 Current Service Cost 8,33,645 4,71,959 7,56,542 4,57,647<br />
3 Interest Cost 3,95,382 1,01,518 3,46,239 58,319<br />
4 Curtailment Cost/(Credit) — — — —<br />
5 Settlement Cost/(Credit) — — — —<br />
6 Plan Amendments — — — —<br />
7 Acquisitions — — — —<br />
8 Actuarial (Gains)/Losses 1,27,585 (5,38,237) (2,91,865) 27,776<br />
9 Benefits Paid (5,88,742) (66,257) (3,81,582) (38,446)<br />
10 Present Value of DBO at the End of Period 60,04,512 12,71,090 52,36,642 13,02,107<br />
V Change in Fair Value of Assets<br />
1 Plan Assets at the Beginning of Period 37,09,295 — 30,76,520 —<br />
2 Acquisition Adjustment — (2,865) —<br />
3 Expected Return on Plan Assets 3,24,114 — 2,95,557 —<br />
4 Actuarial Gains/(Losses) 13,407 — 27,139 —<br />
5 Actual Company Contribution 2,54,619 66,257 6,94,526 38,446<br />
6 Benefits Paid (5,88,742) (66,257) (3,81,582) (38,446)<br />
7 Plan assets at the End of Period 37,12,693 — 37,09,295 —<br />
VI Actuarial Assumptions<br />
1 Discount Rate (%) 8.00 8.00 8.00 8.00<br />
2 Expected Return on Plan Assets (%) 9.15 — 9.15 —<br />
VII<br />
The estimates of future salary increases, considered in actuarial valuations take account of inflation, seniority, promotion and other relevant factors such as<br />
supply and demand factors in the employment market.<br />
Major Categories of Plan Assets as a % of the Total Plan Assets<br />
1 Insurance Companies 100% — 100% —<br />
VIII Basis used to determine the Expected Rate of Return on Plan Assets<br />
The expected rate of return on plan assets is based on the current portfolio of assets, investment strategy and market scenario. In order to protect the capital<br />
and optimised returns within acceptable risk parameters, the plan assets are well diversified.<br />
101


