SUBSIDIARY COMPANIES - ITC Ltd
SUBSIDIARY COMPANIES - ITC Ltd
SUBSIDIARY COMPANIES - ITC Ltd

Create successful ePaper yourself
Turn your PDF publications into a flip-book with our unique Google optimized e-Paper software.
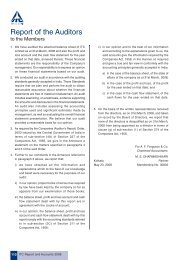
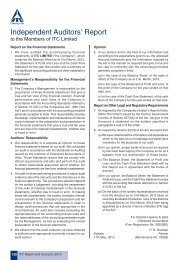
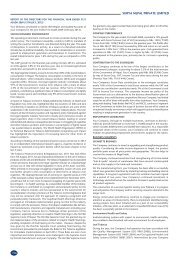
REPORT OF INDEPENDENT CERTIFIED PUBLIC ACCOUNTANTS<br />
Board of Directors<br />
King Maker Marketing, Inc.<br />
Paramus, New Jersey<br />
We have audited the accompanying balance sheets of King Maker Marketing,<br />
Inc. (”Company”) as of March 31, 2012 and 2011, and the related statements<br />
of income and retained earnings and cash flows for the years then ended.<br />
These financial statements are the responsibility of the Company’s<br />
management. Our responsibility is to express an opinion on these financial<br />
statements based on our audits.<br />
We conducted our audits in accordance with auditing standards generally<br />
accepted in the United States of America. Those standards require that we<br />
plan and perform the audits to obtain reasonable assurance about whether<br />
the financial statements are free of material misstatement. An audit includes<br />
examining, on a test basis, evidence supporting the amounts and disclosures<br />
in the financial statements. An audit also includes assessing the accounting<br />
principles used and significant estimates made by management, as well as<br />
evaluating the overall financial statement presentation. We believe that our<br />
audits provide a reasonable basis for our opinion.<br />
In our opinion, the financial statements referred to above present fairly, in<br />
all material respects, the financial position of King Maker Marketing, Inc.<br />
KING MAKER MARKETING, INC.<br />
as of March 31, 2012 and 2011, and the results of its operations and its<br />
cash flows for the years then ended in conformity with accounting principles<br />
generally accepted in the United States of America.<br />
Our audits were conducted for the purpose of forming an opinion on the<br />
financial statements taken as a whole. The supplemental information on<br />
page 199 is presented for purposes of additional analysis and is not a<br />
required part of the financial statements. Such information is the responsibility<br />
of management and was derived from and relates directly to the underlying<br />
accounting and other records used to prepare the financial statements. The<br />
information has been subjected to the auditing procedures applied in the<br />
audits of the financial statements and certain additional procedures, including<br />
comparing and reconciling such information directly to the underlying<br />
accounting and other records used to prepare the financial statements or<br />
to the financial statements themselves, and other additional procedures in<br />
accordance with auditing standards generally accepted in the United States<br />
of America. In our opinion, the information is fairly stated in all material<br />
respects in relation to the financial statements as a whole.<br />
Albany, New York<br />
April 15, 2012 Bollam, Sheedy, Torani & Co. LLP<br />
BALANCE SHEETS<br />
March 31, 2012 March 31, 2012 March 31, 2011 March 31, 2011<br />
ASSETS<br />
CURRENT ASSETS<br />
Cash and cash equivalents<br />
Restricted cash<br />
Accounts receivable<br />
Accounts receivable, other<br />
Inventory, net of reserve for write-off<br />
Due from related parties, net<br />
Prepaid expenses<br />
Income tax receivable<br />
Deferred income taxes<br />
$<br />
5,983,342<br />
1,622,167<br />
313,569<br />
300,659<br />
1,391,673<br />
1,782<br />
410,733<br />
—<br />
27,875<br />
`<br />
304,402,524<br />
82,527,746<br />
15,952,823<br />
15,296,027<br />
70,801,364<br />
90,659<br />
20,896,041<br />
—<br />
1,418,141<br />
$<br />
7,362,492<br />
1,600,000<br />
457,226<br />
282,809<br />
939,039<br />
—<br />
306,417<br />
77,852<br />
51,938<br />
`<br />
328,330,331<br />
71,352,000<br />
20,389,994<br />
12,611,867<br />
41,876,444<br />
—<br />
13,664,666<br />
3,471,810<br />
2,316,175<br />
10,051,800 511,385,325 11,077,773 494,013,288<br />
PROPERTY AND EQUIPMENT, net 25,381 1,291,258 27,729 1,236,575<br />
OTHER ASSETS 10,390 528,591 26,110 1,164,375<br />
10,087,571 513,205,174 11,131,612 496,414,238<br />
LIABILITIES AND STOCKHOLDER'S EQUITY<br />
CURRENT LIABILITIES<br />
Accounts payable 713,978 36,323,631 1,040,653 46,407,921<br />
Income tax payable 260,712 13,263,723 — —<br />
Due to related parties, net — — 69,829 3,114,024<br />
Accrued settlement charges 2,830,593 144,006,419 4,188,026 186,765,019<br />
Accrued expenses and other 137,521 6,996,381 192,500 8,584,538<br />
3,942,804 200,590,154 5,491,008 244,871,502<br />
LONG-TERM LIABILITIES<br />
Deferred income taxes 117,129 5,958,938 91,993 4,102,428<br />
COMMITMENTS AND CONTINGENCIES<br />
STOCKHOLDER'S EQUITY<br />
Common stock, voting, no par value, 1,000 shares authorized;<br />
204 shares issued and outstanding 4,080 181,948 4,080 181,948<br />
Retained earnings 6,023,558 281,037,523 5,544,531 250,852,733<br />
Foreign Exchange Translation Reserve — 25,436,611 — (3,594,373)<br />
6,027,638 306,656,082 5,548,611 247,440,308<br />
10,087,571 513,205,174 11,131,612 496,414,238<br />
The accompanying Notes to Financial Statements are an integral part of these statements.<br />
STATEMENTS OF INCOME AND RETAINED EARNINGS<br />
For the year ended<br />
31st March, 2012<br />
$<br />
For the year ended<br />
31st March, 2012<br />
`<br />
For the year ended<br />
31st March, 2011<br />
$<br />
For the year ended<br />
31st March, 2011<br />
`<br />
SALES<br />
Revenues, net of customer returns 28,360,745 1,353,800,163 37,105,170 1,660,367,133<br />
Less quick pay discounts (1,408,994) (67,258,329) (1,552,876) (69,487,319)<br />
Net sales 26,951,751 1,286,541,834 35,552,294 1,590,879,814<br />
COST OF SALES 20,315,910 962,461,528 27,138,915 1,214,978,284<br />
6,635,841 324,080,306 8,413,379 375,901,530<br />
MSA SETTLEMENT CHARGES, NET 2,176,098 103,876,038 3,068,464 137,306,093<br />
Gross profit 4,459,743 220,204,268 5,344,915 238,595,437<br />
OPERATING EXPENSES 3,794,799 181,144,730 4,828,352 216,056,681<br />
Income (loss) from operations<br />
OTHER<br />
664,944 39,059,538 516,563 22,538,756<br />
Business service income — — 360,000 16,109,100<br />
Reserve for inventory write-off — — (74,400) (3,317,868)<br />
Loss on disposal of property and equipment (4,562) (217,767) (1,499) (67,077)<br />
Interest income 104,987 5,011,554 80,825 3,616,717<br />
Other income 18,703 892,788 1,960 87,705<br />
119,128 5,686,575 366,886 16,428,577<br />
Income before provision for income taxes 784,072 44,746,113 883,449 38,967,333<br />
PROVISION FOR INCOME TAXES 305,045 14,561,323 361,846 16,191,704<br />
Net income 479,027 30,184,790 521,603 22,775,629<br />
RETAINED EARNINGS, beginning of year 5,544,531 250,852,733 5,022,928 228,077,104<br />
RETAINED EARNINGS, end of year 6,023,558 281,037,523 5,544,531 250,852,733<br />
The accompanying Notes to Financial Statements are an integral part of these statements.<br />
199