SUBSIDIARY COMPANIES - ITC Ltd
SUBSIDIARY COMPANIES - ITC Ltd
SUBSIDIARY COMPANIES - ITC Ltd

You also want an ePaper? Increase the reach of your titles
YUMPU automatically turns print PDFs into web optimized ePapers that Google loves.
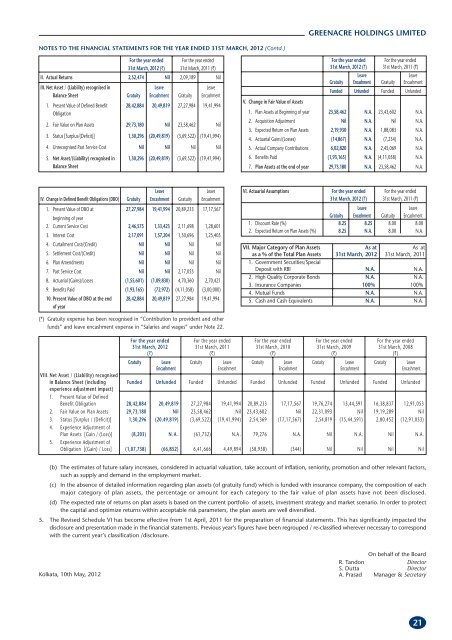
NOTES TO THE FINANCIAL STATEMENTS FOR THE YEAR ENDED 31ST MARCH, 2012 (Contd.)<br />
For the year ended For the year ended<br />
31st March, 2012 (`) 31st March, 2011 (`)<br />
II. Actual Returns 2,52,474 Nil 2,09,189 Nil<br />
III. Net Asset / (Liability) recognised in Leave Leave<br />
Balance Sheet Gratuity Encashment Gratuity Encashment<br />
1. Present Value of Defined Benefit<br />
Obligation<br />
28,42,884 20,49,819 27,27,984 19,41,994<br />
2. Fair Value on Plan Assets 29,73,180 Nil 23,58,462 Nil<br />
3. Status [Surplus/(Deficit)] 1,30,296 (20,49,819) (3,69,522) (19,41,994)<br />
4. Unrecognised Past Service Cost Nil Nil Nil Nil<br />
5. Net Asset/(Liability) recognised in<br />
Balance Sheet<br />
1,30,296 (20,49,819) (3,69,522) (19,41,994)<br />
Leave Leave<br />
IV. Change in Defined Benefit Obligations (DBO) Gratuity Encashment Gratuity Encashment<br />
1. Present Value of DBO at<br />
beginning of year<br />
27,27,984 19,41,994 20,89,233 17,17,567<br />
2. Current Service Cost 2,46,575 1,33,423 2,11,698 1,28,601<br />
3. Interest Cost 2,17,091 1,57,204 1,50,696 1,25,405<br />
4. Curtailment Cost/(Credit) Nil Nil Nil Nil<br />
5. Settlement Cost/(Credit) Nil Nil Nil Nil<br />
6. Plan Amendments Nil Nil Nil Nil<br />
7. Past Service Cost Nil Nil 2,17,055 Nil<br />
8. Actuarial (Gains)/Losses (1,55,601) (1,09,830) 4,70,360 2,70,421<br />
9. Benefits Paid (1,93,165) (72,972) (4,11,058) (3,00,000)<br />
10. Present Value of DBO at the end<br />
of year<br />
28,42,884 20,49,819 27,27,984 19,41,994<br />
(*) Gratuity expense has been recognised in “Contribution to provident and other<br />
funds” and leave encashment expense in “Salaries and wages” under Note 22.<br />
GREENACRE HOLDINGS LIMITED<br />
For the year ended For the year ended<br />
31st March, 2012 (`) 31st March, 2011 (`)<br />
Leave Leave<br />
Gratuity Encashment Gratuity Encashment<br />
Funded Unfunded Funded Unfunded<br />
V. Change in Fair Value of Assets<br />
1. Plan Assets at Beginning of year 23,58,462 N.A. 23,43,602 N.A.<br />
2. Acquisition Adjustment Nil N.A. Nil N.A.<br />
3. Expected Return on Plan Assets 2,19,930 N.A. 1,88,083 N.A.<br />
4. Actuarial Gains/(Losses) (14,867) N.A. (7,234) N.A.<br />
5. Actual Company Contributions 6,02,820 N.A. 2,45,069 N.A.<br />
6. Benefits Paid (1,93,165) N.A. (4,11,058) N.A.<br />
7. Plan Assets at the end of year 29,73,180 N.A. 23,58,462 N.A.<br />
VI. Actuarial Assumptions For the year ended For the year ended<br />
31st March, 2012 (`) 31st March, 2011 (`)<br />
Leave Leave<br />
Gratuity Encashment Gratuity Encashment<br />
1. Discount Rate (%) 8.25 8.25 8.00 8.00<br />
2. Expected Return on Plan Assets (%) 8.25 N.A. 8.00 N.A.<br />
VII. Major Category of Plan Assets As at As at<br />
as a % of the Total Plan Assets 31st March, 2012 31st March, 2011<br />
1. Government Securities/Special<br />
Deposit with RBI N.A. N.A.<br />
2. High Quality Corporate Bonds N.A. N.A.<br />
3. Insurance Companies 100% 100%<br />
4. Mutual Funds N.A. N.A.<br />
5. Cash and Cash Equivalents N.A. N.A.<br />
For the year ended For the year ended For the year ended For the year ended For the year ended<br />
31st March, 2012 31st March, 2011 31st March, 2010 31st March, 2009 31st March, 2008<br />
(`) (`) (`) (`) (`)<br />
Gratuity Leave Gratuity Leave Gratuity Leave Gratuity Leave Gratuity Leave<br />
Encashment Encashment Encashment Encashment Encashment<br />
VIII. Net Asset / (Liability) recognised<br />
in Balance Sheet (including<br />
experience adjustment impact)<br />
Funded Unfunded Funded Unfunded Funded Unfunded Funded Unfunded Funded Unfunded<br />
1. Present Value of Defined<br />
Benefit Obligation 28,42,884 20,49,819 27,27,984 19,41,994 20,89,233 17,17,567 19,76,274 15,44,591 16,38,837 12,91,053<br />
2. Fair Value on Plan Assets 29,73,180 Nil 23,58,462 Nil 23,43,602 Nil 22,31,093 Nil 19,19,289 Nil<br />
3. Status [Surplus / (Deficit)] 1,30,296 (20,49,819) (3,69,522) (19,41,994) 2,54,369 (17,17,567) 2,54,819 (15,44,591) 2,80,452 (12,91,053)<br />
4. Experience Adjustment of<br />
Plan Assets [Gain / (Loss)] (8,203) N. A . (61,732) N.A . 79,276 N.A. Nil N.A. Nil N.A.<br />
5. Experience Adjustment of<br />
Obligation [(Gain) / Loss] (1,07,738) (66,852) 6,41,666 4,49,894 (58,958) (344) Nil Nil Nil Nil<br />
(b) The estimates of future salary increases, considered in actuarial valuation, take account of inflation, seniority, promotion and other relevant factors,<br />
such as supply and demand in the employment market.<br />
(c) In the absence of detailed information regarding plan assets (of gratuity fund) which is funded with insurance company, the composition of each<br />
major category of plan assets, the percentage or amount for each category to the fair value of plan assets have not been disclosed.<br />
(d) The expected rate of returns on plan assets is based on the current portfolio of assets, investment strategy and market scenario. In order to protect<br />
the capital and optimize returns within acceptable risk parameters, the plan assets are well diversified.<br />
5. The Revised Schedule VI has become effective from 1st April, 2011 for the preparation of financial statements. This has significantly impacted the<br />
disclosure and presentation made in the financial statements. Previous year’s figures have been regrouped / re-classified wherever necessary to correspond<br />
with the current year’s classification /disclosure.<br />
Kolkata, 10th May, 2012<br />
On behalf of the Board<br />
R. Tandon Director<br />
S. Dutta Director<br />
A. Prasad Manager & Secretary<br />
21