SUBSIDIARY COMPANIES - ITC Ltd
SUBSIDIARY COMPANIES - ITC Ltd
SUBSIDIARY COMPANIES - ITC Ltd

Create successful ePaper yourself
Turn your PDF publications into a flip-book with our unique Google optimized e-Paper software.
NOTES TO THE ACCOUNTS<br />
As at As at<br />
March 31, 2012 March 31, 2011<br />
(`) (`)<br />
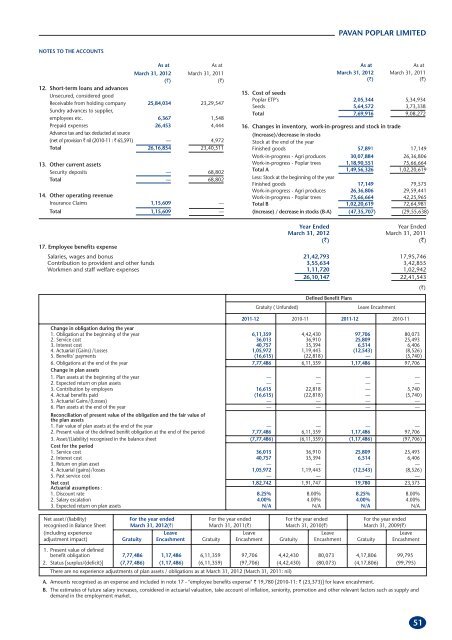
12. Short-term loans and advances<br />
Unsecured, considered good<br />
Receivable from holding company<br />
Sundry advances to supplier,<br />
25,84,034 23,29,547<br />
employees etc. 6,367 1,548<br />
Prepaid expenses<br />
Advance tax and tax deducted at source<br />
26,453 4,444<br />
(net of provision ` nil (2010-11 : ` 65,591) — 4,972<br />
Total 26,16,854 23,40,511<br />
13. Other current assets<br />
Security deposits — 68,802<br />
Total — 68,802<br />
14. Other operating revenue<br />
Insurance Claims 1,15,609 —<br />
Total 1,15,609 —<br />
17. Employee benefits expense<br />
PAVAN POPLAR LIMITED<br />
As at As at<br />
March 31, 2012 March 31, 2011<br />
(`) (`)<br />
15. Cost of seeds<br />
Poplar ETP's 2,05,344 5,34,934<br />
Seeds 5,64,572 3,73,338<br />
Total 7,69,916 9,08,272<br />
16. Changes in inventory, work-in-progress and stock in trade<br />
(Increase)/decrease in stocks<br />
Stock at the end of the year<br />
Finished goods 57,891 17,149<br />
Work-in-progress - Agri produces 30,07,884 26,36,806<br />
Work-in-progress - Poplar trees 1,18,90,551 75,66,664<br />
Total A 1,49,56,326 1,02,20,619<br />
Less: Stock at the beginning of the year<br />
Finished goods 17,149 79,575<br />
Work-in-progress - Agri produces 26,36,806 29,59,441<br />
Work-in-progress - Poplar trees 75,66,664 42,25,965<br />
Total B 1,02,20,619 72,64,981<br />
(Increase) / decrease in stocks (B-A) (47,35,707) (29,55,638)<br />
Year Ended Year Ended<br />
March 31, 2012 March 31, 2011<br />
(`) (`)<br />
Salaries, wages and bonus 21,42,793 17,95,746<br />
Contribution to provident and other funds 3,55,634 3,42,855<br />
Workmen and staff welfare expenses 1,11,720 1,02,942<br />
26,10,147 22,41,543<br />
(`)<br />
Defined Benefit Plans<br />
Gratuity ( Unfunded) Leave Encashment<br />
2011-12 2010-11 2011-12 2010-11<br />
Change in obligation during the year<br />
1. Obligation at the beginning of the year 6,11,359 4,42,430 97,706 80,073<br />
2. Service cost 36,013 36,910 25,809 25,493<br />
3. Interest cost 40,757 35,394 6,514 6,406<br />
4. Actuarial (Gains) /Losses 1,05,972 1,19,443 (12,543) (8,526)<br />
5. Benefits’ payments (16,615) (22,818) — (5,740)<br />
6. Obligations at the end of the year<br />
Change in plan assets<br />
7,77,486 6,11,359 1,17,486 97,706<br />
1. Plan assets at the beginning of the year — — — —<br />
2. Expected return on plan assets — — — —<br />
3. Contribution by employers 16,615 22,818 — 5,740<br />
4. Actual benefits paid (16,615) (22,818) — (5,740)<br />
5. Actuarial Gains/(Losses) — — — —<br />
6. Plan assets at the end of the year<br />
Reconciliation of present value of the obligation and the fair value of<br />
the plan assets<br />
— — — —<br />
1. Fair value of plan assets at the end of the year — — — —<br />
2. Present value of the defined benifit obligation at the end of the period 7,77,486 6,11,359 1,17,486 97,706<br />
3. Asset/(Liability) recognised in the balance sheet<br />
Cost for the period<br />
(7,77,486) (6,11,359) (1,17,486) (97,706)<br />
1. Service cost 36,013 36,910 25,809 25,493<br />
2. Interest cost 40,757 35,394 6,514 6,406<br />
3. Return on plan asset — — — —<br />
4. Actuarial (gains)/losses 1,05,972 1,19,443 (12,543) (8,526)<br />
5. Past service cost — — — —<br />
Net cost<br />
Actuarial assumptions :<br />
1,82,742 1,91,747 19,780 23,373<br />
1. Discount rate 8.25% 8.00% 8.25% 8.00%<br />
2. Salary escalation 4.00% 4.00% 4.00% 4.00%<br />
3. Expected return on plan assets N/A N/A N/A N/A<br />
Net asset/(liability) For the year ended For the year ended For the year ended For the year ended<br />
recognised in Balance Sheet March 31, 2012(`) March 31, 2011(`) March 31, 2010(`) March 31, 2009(`)<br />
(including experience Leave Leave Leave Leave<br />
adjustment impact) Gratuity Encashment Gratuity Encashment Gratuity Encashment Gratuity Encashment<br />
1. Present value of defined<br />
benefit obligation 7,77,486 1,17,486 6,11,359 97,706 4,42,430 80,073 4,17,806 99,795<br />
2. Status [surplus/(deficit)] (7,77,486) (1,17,486) (6,11,359) (97,706) (4,42,430) (80,073) (4,17,806) (99,795)<br />
There are no experience adjustments of plan assets / obligations as at March 31, 2012 (March 31, 2011: nil)<br />
A. Amounts recognised as an expense and included in note 17 - "employee benefits expense" ` 19,780 [2010-11: ` (23,373)] for leave encashment.<br />
B. The estimates of future salary increases, considered in actuarial valuation, take account of inflation, seniority, promotion and other relevant factors such as supply and<br />
demand in the employment market.<br />
51