Bulletin 2/2010 - Siempelkamp NIS
Bulletin 2/2010 - Siempelkamp NIS
Bulletin 2/2010 - Siempelkamp NIS

You also want an ePaper? Increase the reach of your titles
YUMPU automatically turns print PDFs into web optimized ePapers that Google loves.
SIEMPELKAMP | MACHINERY AND PLANTS<br />
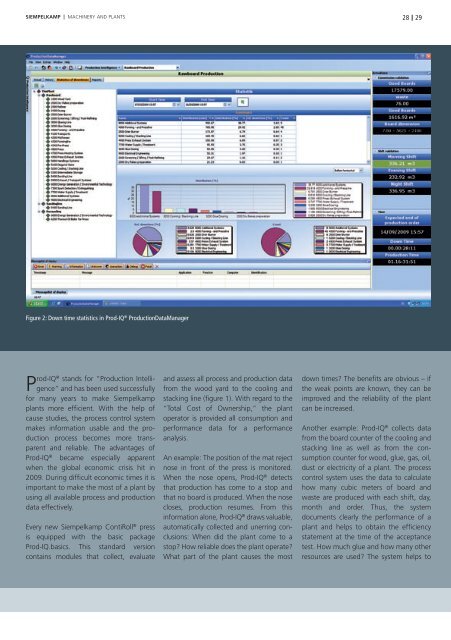
Figure 2: Down time statistics in Prod-IQ ® ProductionDataManager<br />
P rod-IQ® stands for “Production Intelligence”<br />
and has been used successfully<br />
for many years to make <strong>Siempelkamp</strong><br />
plants more effi cient. With the help of<br />
cause studies, the process control system<br />
makes information usable and the production<br />
process becomes more transparent<br />
and reliable. The advantages of<br />
Prod-IQ ® became especially apparent<br />
when the global economic crisis hit in<br />
2009. During diffi cult economic times it is<br />
important to make the most of a plant by<br />
using all available process and production<br />
data effectively.<br />
Every new <strong>Siempelkamp</strong> ContiRoll ® press<br />
is equipped with the basic package<br />
Prod-IQ.basics. This standard version<br />
contains modules that collect, evaluate<br />
and assess all process and production data<br />
from the wood yard to the cooling and<br />
stacking line (fi gure 1). With regard to the<br />
“Total Cost of Ownership,” the plant<br />
operator is provided all consumption and<br />
performance data for a performance<br />
analysis.<br />
An example: The position of the mat reject<br />
nose in front of the press is monitored.<br />
When the nose opens, Prod-IQ ® detects<br />
that production has come to a stop and<br />
that no board is produced. When the nose<br />
closes, production resumes. From this<br />
information alone, Prod-IQ ® draws valuable,<br />
automatically collected and unerring conclusions:<br />
When did the plant come to a<br />
stop? How reliable does the plant operate?<br />
What part of the plant causes the most<br />
28<br />
29<br />
down times? The benefi ts are obvious – if<br />
the weak points are known, they can be<br />
improved and the reliability of the plant<br />
can be increased.<br />
Another example: Prod-IQ ® collects data<br />
from the board counter of the cooling and<br />
stacking line as well as from the consumption<br />
counter for wood, glue, gas, oil,<br />
dust or electricity of a plant. The process<br />
control system uses the data to calculate<br />
how many cubic meters of board and<br />
waste are produced with each shift, day,<br />
month and order. Thus, the system<br />
documents clearly the performance of a<br />
plant and helps to obtain the effi ciency<br />
statement at the time of the acceptance<br />
test. How much glue and how many other<br />
resources are used? The system helps to