Bulletin 2/2010 - Siempelkamp NIS
Bulletin 2/2010 - Siempelkamp NIS
Bulletin 2/2010 - Siempelkamp NIS

Create successful ePaper yourself
Turn your PDF publications into a flip-book with our unique Google optimized e-Paper software.
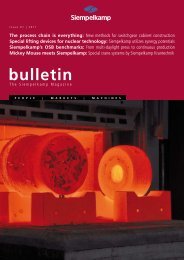
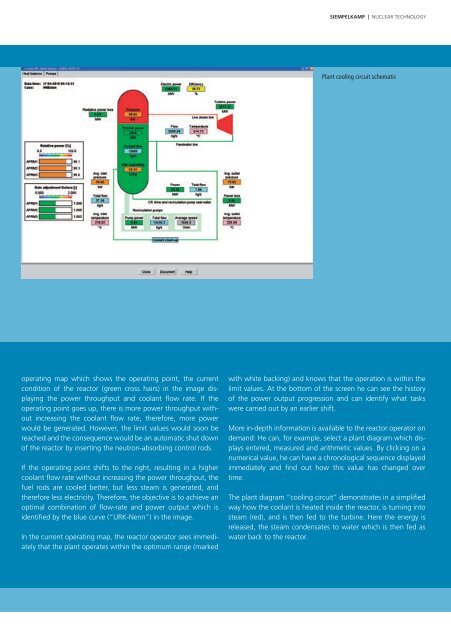
operating map which shows the operating point, the current<br />
condition of the reactor (green cross hairs) in the image displaying<br />
the power throughput and coolant fl ow rate. If the<br />
operating point goes up, there is more power throughput without<br />
increasing the coolant fl ow rate, therefore, more power<br />
would be generated. However, the limit values would soon be<br />
reached and the consequence would be an automatic shut down<br />
of the reactor by inserting the neutron-absorbing control rods.<br />
If the operating point shifts to the right, resulting in a higher<br />
coolant fl ow rate without increasing the power throughput, the<br />
fuel rods are cooled better, but less steam is generated, and<br />
therefore less electricity. Therefore, the objective is to achieve an<br />
optimal combination of fl ow-rate and power output which is<br />
identifi ed by the blue curve (“URK-Nenn”) in the image.<br />
In the current operating map, the reactor operator sees immediately<br />
that the plant operates within the optimum range (marked<br />
SIEMPELKAMP | NUCLEAR TECHNOLOGY<br />
Plant cooling circuit schematic<br />
with white backing) and knows that the operation is within the<br />
limit values. At the bottom of the screen he can see the history<br />
of the power output progression and can identify what tasks<br />
were carried out by an earlier shift.<br />
More in-depth information is available to the reactor operator on<br />
demand: He can, for example, select a plant diagram which displays<br />
entered, measured and arithmetic values. By clicking on a<br />
numerical value, he can have a chronological sequence displayed<br />
immediately and fi nd out how this value has changed over<br />
time.<br />
The plant diagram “cooling circuit” demonstrates in a simplifi ed<br />
way how the coolant is heated inside the reactor, is turning into<br />
steam (red), and is then fed to the turbine. Here the energy is<br />
released, the steam condensates to water which is then fed as<br />
water back to the reactor.