Annual Report 2012 - Dialog
Annual Report 2012 - Dialog
Annual Report 2012 - Dialog

Create successful ePaper yourself
Turn your PDF publications into a flip-book with our unique Google optimized e-Paper software.
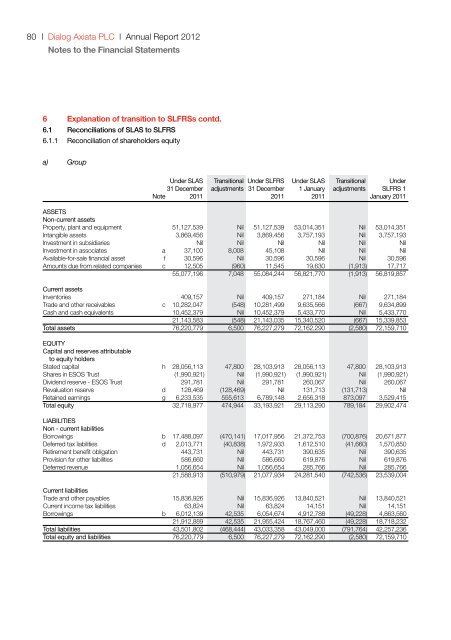
80 l <strong>Dialog</strong> Axiata PLC l <strong>Annual</strong> <strong>Report</strong> <strong>2012</strong><br />
Notes to the Financial Statements<br />
6 Explanation of transition to SLFRSs contd.<br />
6.1 Reconciliations of SLAS to SLFRS<br />
6.1.1 Reconciliation of shareholders equity<br />
a) Group<br />
Under SLAS Transitional Under SLFRS Under SLAS Transitional Under<br />
31 December adjustments 31 December 1 January adjustments SLFRS 1<br />
Note 2011 2011 2011 January 2011<br />
ASSETS<br />
Non-current assets<br />
Property, plant and equipment 51,127,539 Nil 51,127,539 53,014,351 Nil 53,014,351<br />
Intangible assets 3,869,456 Nil 3,869,456 3,757,193 Nil 3,757,193<br />
Investment in subsidiaries Nil Nil Nil Nil Nil Nil<br />
Investment in associates a 37,100 8,008 45,108 Nil Nil Nil<br />
Available-for-sale financial asset f 30,596 Nil 30,596 30,596 Nil 30,596<br />
Amounts due from related companies c 12,505 (960) 11,545 19,630 (1,913) 17,717<br />
55,077,196 7,048 55,084,244 56,821,770 (1,913) 56,819,857<br />
Current assets<br />
Inventories 409,157 Nil 409,157 271,184 Nil 271,184<br />
Trade and other receivables c 10,282,047 (548) 10,281,499 9,635,566 (667) 9,634,899<br />
Cash and cash equivalents 10,452,379 Nil 10,452,379 5,433,770 Nil 5,433,770<br />
21,143,583 (548) 21,143,035 15,340,520 (667) 15,339,853<br />
Total assets 76,220,779 6,500 76,227,279 72,162,290 (2,580) 72,159,710<br />
EQUITY<br />
Capital and reserves attributable<br />
to equity holders<br />
Stated capital h 28,056,113 47,800 28,103,913 28,056,113 47,800 28,103,913<br />
Shares in ESOS Trust (1,990,921) Nil (1,990,921) (1,990,921) Nil (1,990,921)<br />
Dividend reserve - ESOS Trust 291,781 Nil 291,781 260,067 Nil 260,067<br />
Revaluation reserve d 128,469 (128,469) Nil 131,713 (131,713) Nil<br />
Retained earnings g 6,233,535 555,613 6,789,148 2,656,318 873,097 3,529,415<br />
Total equity 32,718,977 474,944 33,193,921 29,113,290 789,184 29,902,474<br />
LIABILITIES<br />
Non - current liabilities<br />
Borrowings b 17,488,097 (470,141) 17,017,956 21,372,753 (700,876) 20,671,877<br />
Deferred tax liabilities d 2,013,771 (40,838) 1,972,933 1,612,510 (41,660) 1,570,850<br />
Retirement benefit obligation 443,731 Nil 443,731 390,635 Nil 390,635<br />
Provision for other liabilities 586,660 Nil 586,660 619,876 Nil 619,876<br />
Deferred revenue 1,056,654 Nil 1,056,654 285,766 Nil 285,766<br />
21,588,913 (510,979) 21,077,934 24,281,540 (742,536) 23,539,004<br />
Current liabilities<br />
Trade and other payables 15,836,926 Nil 15,836,926 13,840,521 Nil 13,840,521<br />
Current income tax liabilities 63,824 Nil 63,824 14,151 Nil 14,151<br />
Borrowings b 6,012,139 42,535 6,054,674 4,912,788 (49,228) 4,863,560<br />
21,912,889 42,535 21,955,424 18,767,460 (49,228) 18,718,232<br />
Total liabilities 43,501,802 (468,444) 43,033,358 43,049,000 (791,764) 42,257,236<br />
Total equity and liabilities 76,220,779 6,500 76,227,279 72,162,290 (2,580) 72,159,710
![nrypq;Nfh ,d;#ud;;]; nfhk;gdp ypkplw - Dialog](https://img.yumpu.com/15429071/1/190x245/nrypqnfh-dud-nfhkgdp-ypkplw-dialog.jpg?quality=85)